Minnesota Investment Properties for Sale
Browse homes for sale and investment properties in Minnesota. Refine your search by price, property type, or more.
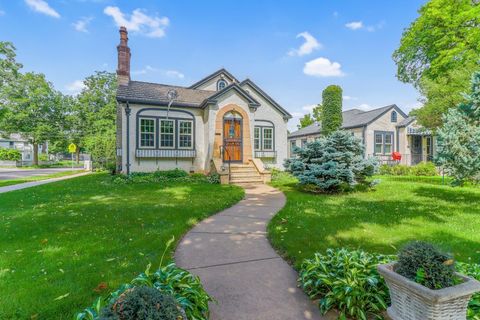
Best cash flowing properties in Minnesota
Active
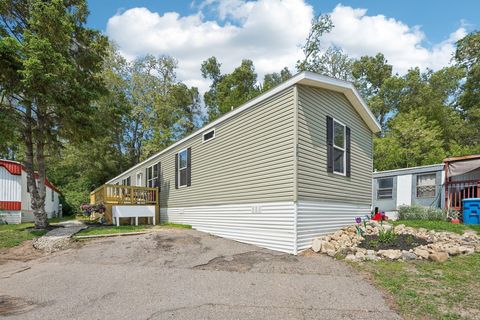
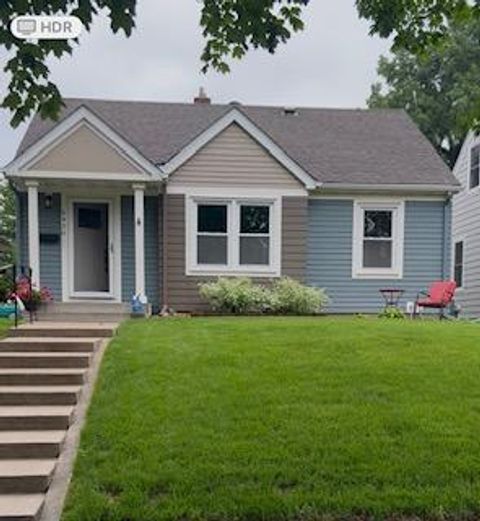
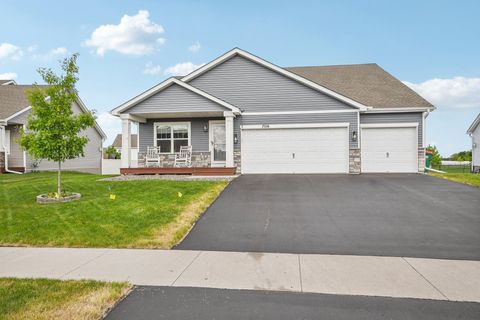
$112,000
3
bds
|
2
ba
|
1,216
sqft
|
built
2022
217 Mayfair Rd, Saint Paul, MN 55127
$850
Cash flow
39.6%
Cash-on-Cash Return
14.8%
Cap rate
1.8%
Rent to Value Ratio
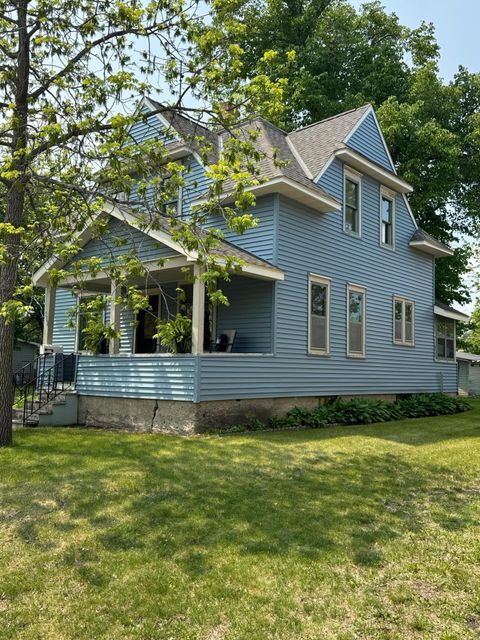
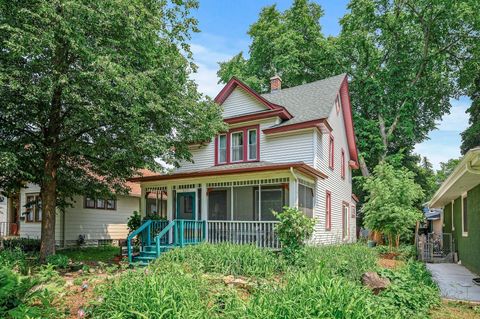
Active
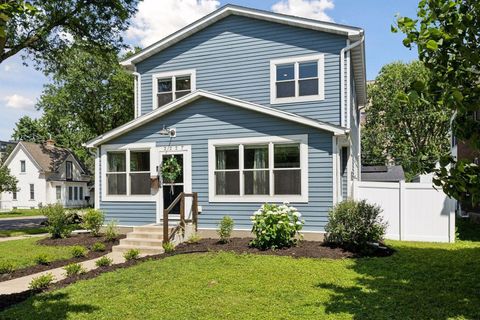
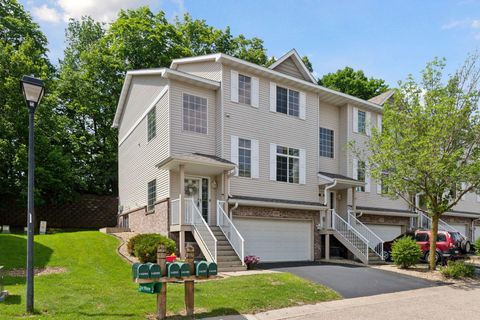
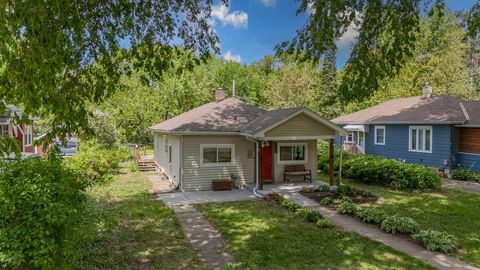
$164,900
4
bds
|
1
ba
|
1,214
sqft
|
built
1915
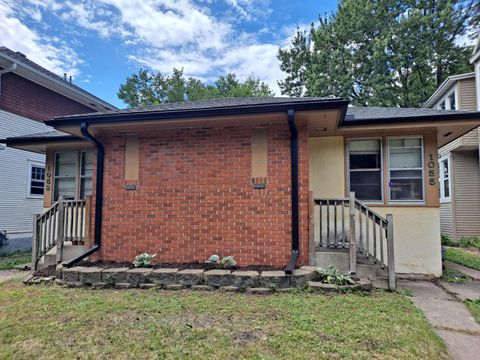
431 19 1/2 Ave N, Saint Cloud, MN 56303
$164
Cash flow
5.2%
Cash-on-Cash Return
6.9%
Cap rate
1.0%
Rent to Value Ratio
5,733 out of 15,810 properties for sale in Minnesota
Limited Results Shown
Create a free account, or log in to reveal all property listings and enjoy the complete experience.
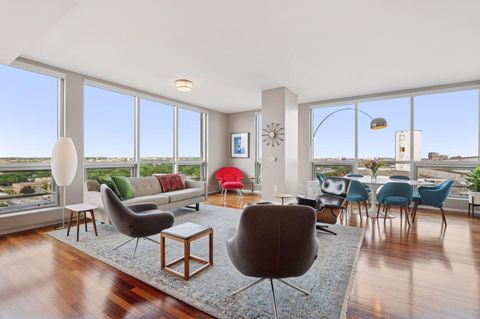
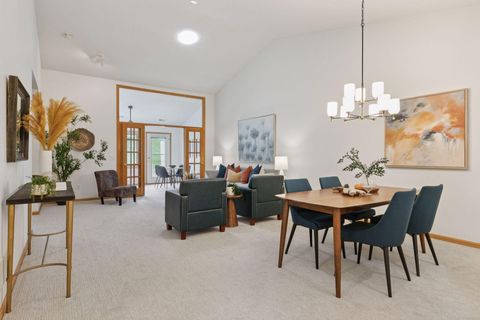
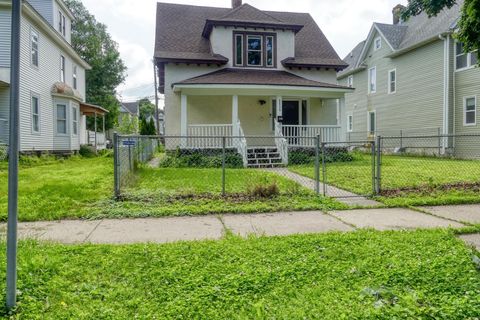
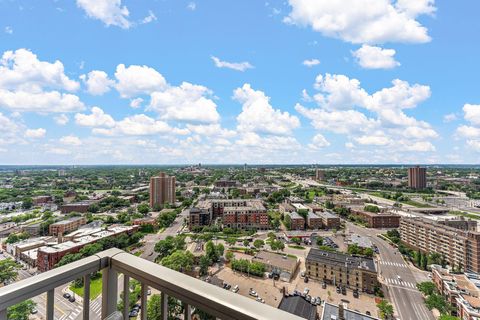
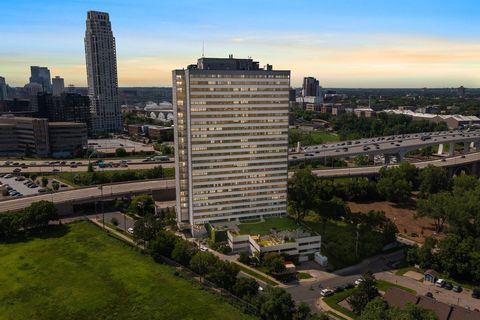
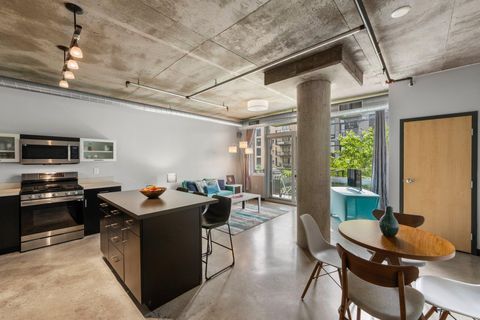
Active
$1,129,900
2
bds
|
2
ba
|
2,100
sqft
|
built
2007
222 2nd St SE, Minneapolis, MN 55414
$-5,165
Cash flow
-23.8%
Cash-on-Cash Return
0.2%
Cap rate
0.5%
Rent to Value Ratio
Active
$112,000
3
bds
|
2
ba
|
1,216
sqft
|
built
2022
217 Mayfair Rd, Saint Paul, MN 55127
$850
Cash flow
39.6%
Cash-on-Cash Return
14.8%
Cap rate
1.8%
Rent to Value Ratio
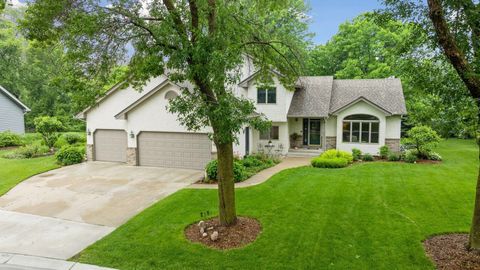
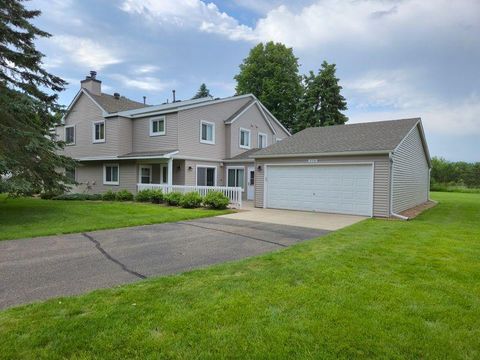
Active
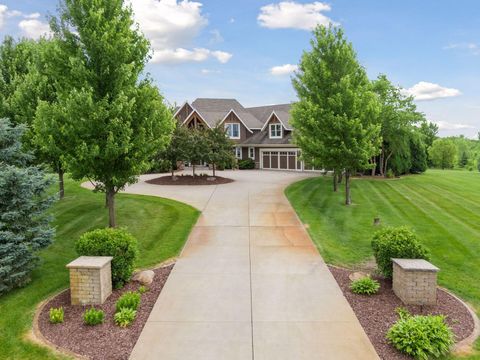
$549,900
4
bds
|
3
ba
|
2,792
sqft
|
built
1994
1378 Dunsmore Dr, Waconia, MN 55387
$-956
Cash flow
-9.1%
Cash-on-Cash Return
3.6%
Cap rate
0.6%
Rent to Value Ratio
Active
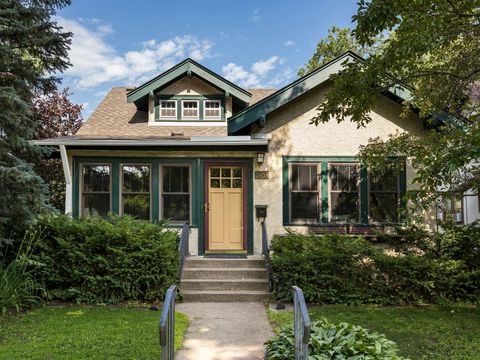
$469,900
3
bds
|
3
ba
|
2,250
sqft
|
built
1928
3660 45th Ave S, Minneapolis, MN 55406
$-792
Cash flow
-8.8%
Cash-on-Cash Return
3.7%
Cap rate
0.6%
Rent to Value Ratio
Active
$550,000
4
bds
|
3
ba
|
2,533
sqft
|
built
1910
2227 Grand St NE, Minneapolis, MN 55418
$-770
Cash flow
-7.3%
Cash-on-Cash Return
4.0%
Cap rate
0.6%
Rent to Value Ratio
Active
$310,000
2
bds
|
2
ba
|
1,764
sqft
|
built
2007
15120 French Dr N, Hugo, MN 55038
$-575
Cash flow
-9.7%
Cash-on-Cash Return
3.5%
Cap rate
0.7%
Rent to Value Ratio
Active
$105,000
1
bds
|
1
ba
|
672
sqft
|
built
1983
66 9th St E, Saint Paul, MN 55101
$-186
Cash flow
-9.2%
Cash-on-Cash Return
3.6%
Cap rate
1.4%
Rent to Value Ratio
Active
$389,900
3
bds
|
3
ba
|
2,436
sqft
|
built
2021
6645 Jody Ave S, Cottage Grove, MN 55016
$-375
Cash flow
-5.0%
Cash-on-Cash Return
4.5%
Cap rate
0.8%
Rent to Value Ratio
Active
$164,900
4
bds
|
1
ba
|
1,214
sqft
|
built
1915
431 19 1/2 Ave N, Saint Cloud, MN 56303
$164
Cash flow
5.2%
Cash-on-Cash Return
6.9%
Cap rate
1.0%
Rent to Value Ratio
Active
$199,000
2
bds
|
2
ba
|
1,190
sqft
|
built
1989
3255 80th St E, Inver Grove Heights, MN 55076
$-195
Cash flow
-5.1%
Cash-on-Cash Return
4.5%
Cap rate
0.9%
Rent to Value Ratio
Active
$450,000
5
bds
|
3
ba
|
4,006
sqft
|
built
2006
338 Aurora Ave, Saint Paul, MN 55103
$-457
Cash flow
-5.3%
Cash-on-Cash Return
4.5%
Cap rate
0.8%
Rent to Value Ratio

Active
$549,000
5
bds
|
3
ba
|
2,883
sqft
|
built
2000
3850 Oxford Dr, Woodbury, MN 55125
$-875
Cash flow
-8.3%
Cash-on-Cash Return
3.8%
Cap rate
0.6%
Rent to Value Ratio
Active
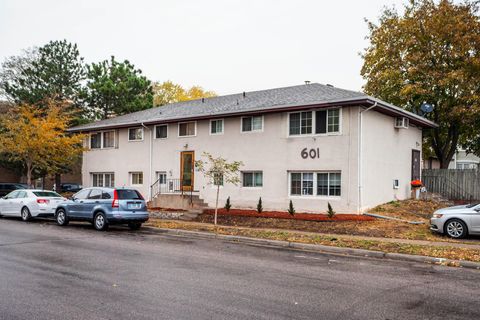
$635,000
7
bds
|
4
ba
|
3,528
sqft
|
built
1964
601 Jackson St NE, Minneapolis, MN 55413
$-2,480
Cash flow
-20.4%
Cash-on-Cash Return
1.0%
Cap rate
0.3%
Rent to Value Ratio
Active
$475,000
4
bds
|
2
ba
|
1,785
sqft
|
built
1947
5450 Washburn Ave S, Minneapolis, MN 55410
$-789
Cash flow
-8.7%
Cash-on-Cash Return
3.7%
Cap rate
0.6%
Rent to Value Ratio
Active
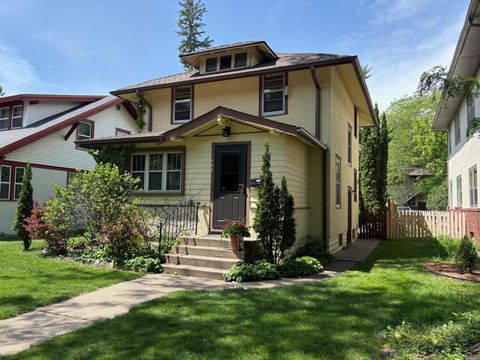
$389,900
3
bds
|
2
ba
|
1,562
sqft
|
built
1908
3231 41st Ave S, Minneapolis, MN 55406
$-455
Cash flow
-6.1%
Cash-on-Cash Return
4.3%
Cap rate
0.6%
Rent to Value Ratio
Active
$325,000
2
bds
|
2
ba
|
1,578
sqft
|
built
1995
8891 Thomas Dr, Woodbury, MN 55125
$-482
Cash flow
-7.7%
Cash-on-Cash Return
3.9%
Cap rate
0.8%
Rent to Value Ratio
Active
$320,000
3
bds
|
3
ba
|
1,510
sqft
|
built
1987
2539 Wimbledon Pl, Woodbury, MN 55125
$-661
Cash flow
-10.8%
Cash-on-Cash Return
3.8%
Cap rate
0.7%
Rent to Value Ratio
Active
$460,000
4
bds
|
3
ba
|
2,318
sqft
|
built
2021
7516 Ochoa Ave NE, Otsego, MN 55330
$-456
Cash flow
-5.2%
Cash-on-Cash Return
4.5%
Cap rate
0.7%
Rent to Value Ratio
Active
$354,900
3
bds
|
4
ba
|
2,260
sqft
|
built
2003
14205 Fountain Hills Ct NE, Prior Lake, MN 55372
$-198
Cash flow
-2.9%
Cash-on-Cash Return
5.0%
Cap rate
0.7%
Rent to Value Ratio
Active
$300,000
2
bds
|
2
ba
|
1,399
sqft
|
built
1906
2535 11th Ave S, Minneapolis, MN 55404
$-444
Cash flow
-7.7%
Cash-on-Cash Return
3.9%
Cap rate
0.6%
Rent to Value Ratio
Active
$319,900
2
bds
|
2
ba
|
0
sqft
|
built
2006
929 Portland Ave, Minneapolis, MN 55404
$-880
Cash flow
-14.4%
Cash-on-Cash Return
2.4%
Cap rate
0.8%
Rent to Value Ratio
Active
$119,000
1
bds
|
1
ba
|
0
sqft
|
built
1923
2739 Girard Ave S, Minneapolis, MN 55408
$-303
Cash flow
-13.3%
Cash-on-Cash Return
2.6%
Cap rate
0.9%
Rent to Value Ratio
Active
$114,500
1
bds
|
1
ba
|
650
sqft
|
built
1973
1920 S 1st St, Minneapolis, MN 55454
$-465
Cash flow
-21.2%
Cash-on-Cash Return
0.8%
Cap rate
1.2%
Rent to Value Ratio
Active
$1,249,900
4
bds
|
4
ba
|
3,648
sqft
|
built
2025
2084 Palace Ave, Saint Paul, MN 55105
$-2,762
Cash flow
-11.5%
Cash-on-Cash Return
3.0%
Cap rate
0.4%
Rent to Value Ratio
Active
$634,900
4
bds
|
3
ba
|
3,307
sqft
|
built
2022
13693 Applewood Trl, Rosemount, MN 55068
$-1,441
Cash flow
-11.8%
Cash-on-Cash Return
3.0%
Cap rate
0.5%
Rent to Value Ratio
Active
$1,650,000
5
bds
|
6
ba
|
8,617
sqft
|
built
2009
7530 Quail Ridge Trl, Rockford, MN 55373
$-5,650
Cash flow
-17.9%
Cash-on-Cash Return
1.6%
Cap rate
0.3%
Rent to Value Ratio
Active
$250,000
3
bds
|
2
ba
|
1,288
sqft
|
built
1917
1935 Margaret St, Saint Paul, MN 55119
$-270
Cash flow
-5.6%
Cash-on-Cash Return
4.4%
Cap rate
0.7%
Rent to Value Ratio
Active
$399,900
3
bds
|
1
ba
|
1,383
sqft
|
built
1923
2433 33rd Ave S, Minneapolis, MN 55406
$-428
Cash flow
-5.6%
Cash-on-Cash Return
4.4%
Cap rate
0.7%
Rent to Value Ratio
Active
$449,000
3
bds
|
2
ba
|
1,112
sqft
|
built
1919
408 Sheridan Ave S, Minneapolis, MN 55405
$-988
Cash flow
-11.5%
Cash-on-Cash Return
3.0%
Cap rate
0.5%
Rent to Value Ratio
Active
$489,900
4
bds
|
3
ba
|
2,706
sqft
|
built
1986
11473 199th Ave NW, Elk River, MN 55330
$-716
Cash flow
-7.6%
Cash-on-Cash Return
3.9%
Cap rate
0.6%
Rent to Value Ratio
Active
$1,700,000
5
bds
|
5
ba
|
4,856
sqft
|
built
2013
4243 Vincent Ave S, Minneapolis, MN 55410
$-7,506
Cash flow
-23.0%
Cash-on-Cash Return
0.4%
Cap rate
0.2%
Rent to Value Ratio
Active
$464,900
3
bds
|
3
ba
|
2,412
sqft
|
built
1996
1284 Otter Ridge Rd, White Bear Lake, MN 55110
$-747
Cash flow
-8.4%
Cash-on-Cash Return
3.8%
Cap rate
0.6%
Rent to Value Ratio
Active
$535,000
5
bds
|
3
ba
|
3,337
sqft
|
built
2007
816 Abbey Rd, Northfield, MN 55057
$-1,170
Cash flow
-11.4%
Cash-on-Cash Return
3.1%
Cap rate
0.5%
Rent to Value Ratio
Active
$359,900
4
bds
|
2
ba
|
2,506
sqft
|
built
1962
1053 12th Ave SE, Minneapolis, MN 55414
$-604
Cash flow
-8.8%
Cash-on-Cash Return
3.7%
Cap rate
0.6%
Rent to Value Ratio
Active
$1,297,000
4
bds
|
5
ba
|
3,730
sqft
|
built
2013
6232 Virginia Ave S, Minneapolis, MN 55424
$-4,175
Cash flow
-16.8%
Cash-on-Cash Return
1.8%
Cap rate
0.4%
Rent to Value Ratio
Active
$295,000
1
bds
|
1
ba
|
835
sqft
|
built
2007
730 N 4th St, Minneapolis, MN 55401
$-756
Cash flow
-13.4%
Cash-on-Cash Return
2.6%
Cap rate
0.7%
Rent to Value Ratio
Active
$825,000
4
bds
|
4
ba
|
3,452
sqft
|
built
2020
7904 Shadyview Ln N, Maple Grove, MN 55311
$-724
Cash flow
-4.6%
Cash-on-Cash Return
4.6%
Cap rate
0.7%
Rent to Value Ratio
Active
$219,900
4
bds
|
2
ba
|
2,311
sqft
|
built
1957
1030 32nd Ave N, Saint Cloud, MN 56303
$-125
Cash flow
-3.0%
Cash-on-Cash Return
5.0%
Cap rate
0.7%
Rent to Value Ratio
Active
$290,000
4
bds
|
2
ba
|
1,416
sqft
|
built
1900
2815 Girard Ave N, Minneapolis, MN 55411
$-85
Cash flow
-1.5%
Cash-on-Cash Return
5.3%
Cap rate
0.8%
Rent to Value Ratio

Active
$281,000
3
bds
|
2
ba
|
1,645
sqft
|
built
2004
2099 Clover Ridge Dr, Chaska, MN 55318
$-618
Cash flow
-11.5%
Cash-on-Cash Return
3.0%
Cap rate
0.7%
Rent to Value Ratio