Minnesota Investment Properties for Sale
Browse homes for sale and investment properties in Minnesota. Refine your search by price, property type, or more.
Best cash flowing properties in Minnesota
Active
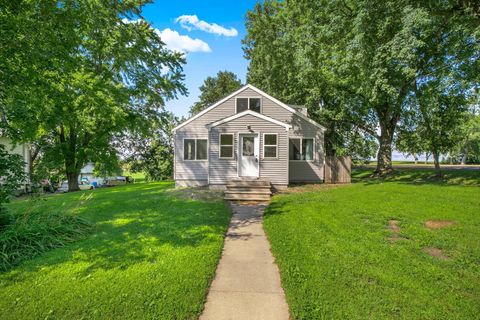
$185,000
4
bds
|
1
ba
|
1,540
sqft
|
built
1940
109 Main St E, Melrose, MN 56352
$163
Cash flow
4.6%
Cash-on-Cash Return
6.7%
Cap rate
0.9%
Rent to Value Ratio

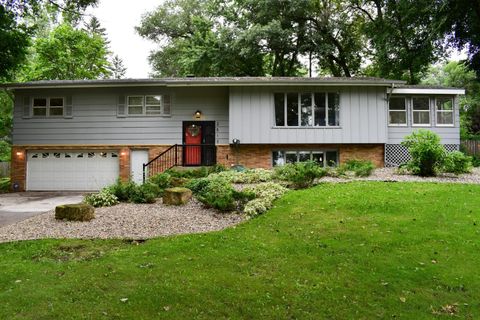
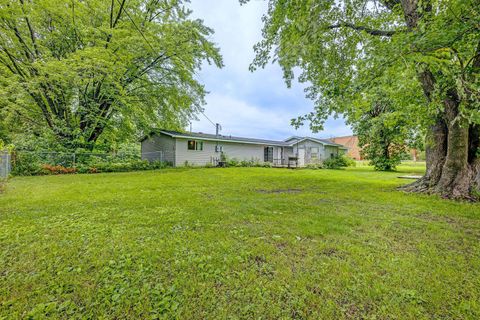
Active
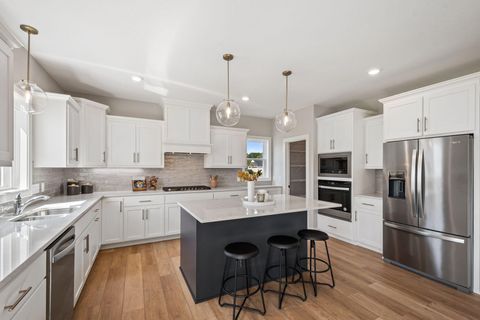
$349,000
3
bds
|
2
ba
|
1,865
sqft
|
built
1959
21555 Imperial Ave N, Forest Lake, MN 55025
$-27
Cash flow
-0.4%
Cash-on-Cash Return
5.6%
Cap rate
0.8%
Rent to Value Ratio
2,449 out of 5,975 properties for sale in Minnesota
Limited Results Shown
Create a free account, or log in to reveal all property listings and enjoy the complete experience.
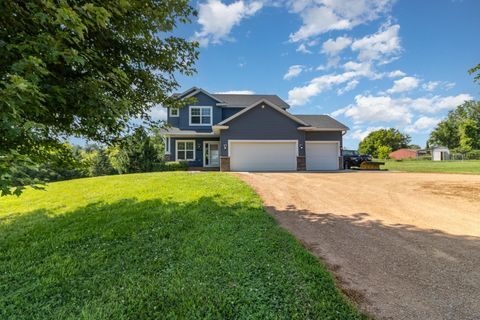
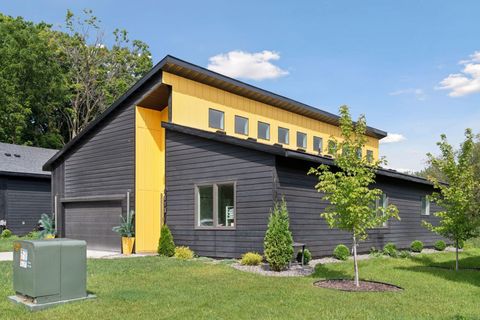
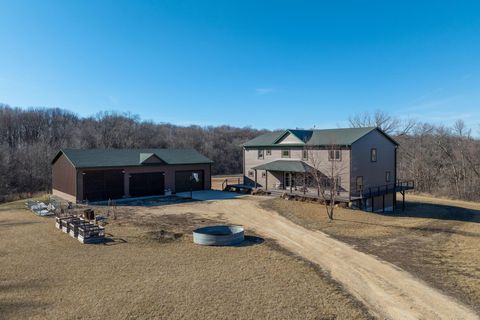
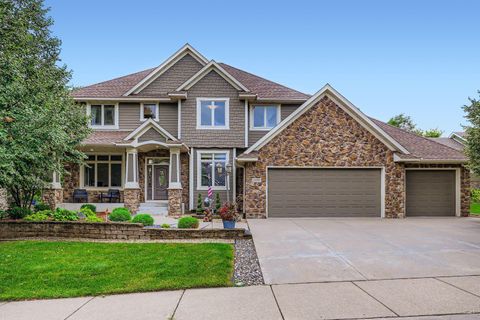
Active
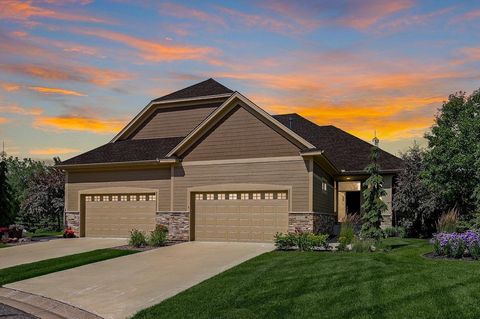
$729,900
5
bds
|
4
ba
|
3,808
sqft
|
built
2025
5324 176th St W, Lakeville, MN 55044
$-1,646
Cash flow
-11.8%
Cash-on-Cash Return
3.0%
Cap rate
0.4%
Rent to Value Ratio
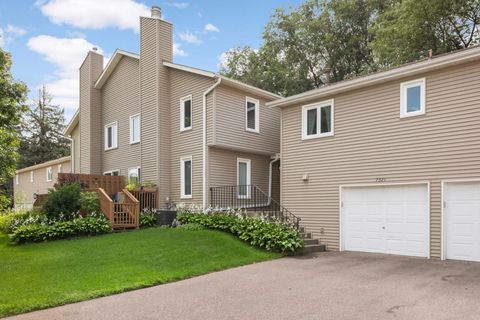
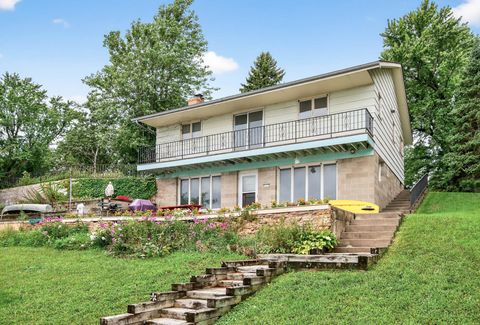
Active
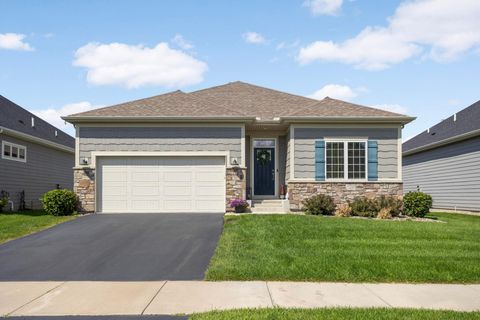
$735,000
4
bds
|
3
ba
|
3,214
sqft
|
built
2017
18229 Justice Way, Lakeville, MN 55044
$-2,559
Cash flow
-18.2%
Cash-on-Cash Return
1.5%
Cap rate
0.4%
Rent to Value Ratio
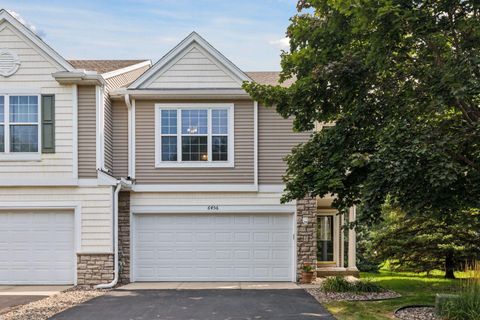
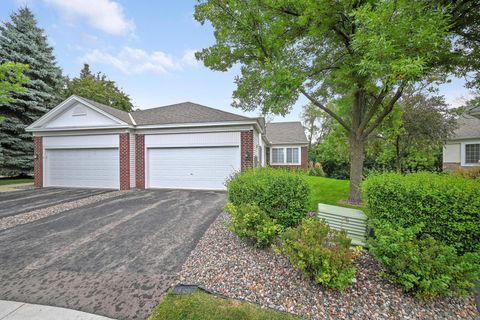
Active
$549,900
4
bds
|
3
ba
|
2,839
sqft
|
built
2020
7857 183rd St W, Lakeville, MN 55044
$-921
Cash flow
-8.7%
Cash-on-Cash Return
3.7%
Cap rate
0.6%
Rent to Value Ratio
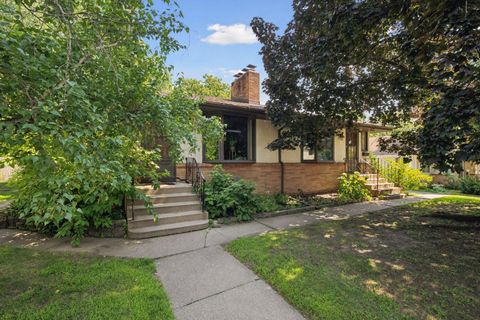
Active
$674,999
5
bds
|
4
ba
|
2,903
sqft
|
built
2013
3410 Boulder Trl, Webster, MN 55088
$-1,102
Cash flow
-8.5%
Cash-on-Cash Return
3.7%
Cap rate
0.5%
Rent to Value Ratio
Active
$260,000
2
bds
|
2
ba
|
1,230
sqft
|
built
1979
7321 Woodstock Curv, Bloomington, MN 55438
$-586
Cash flow
-11.8%
Cash-on-Cash Return
3.0%
Cap rate
0.8%
Rent to Value Ratio
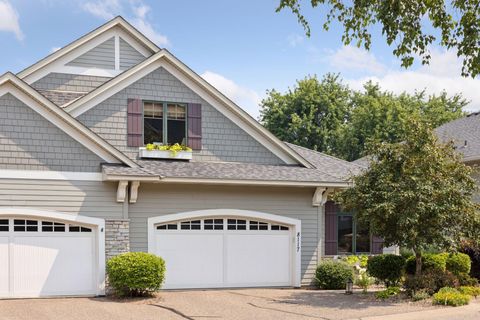
Active
$305,000
2
bds
|
3
ba
|
1,536
sqft
|
built
2002
6456 157th St W, Apple Valley, MN 55124
$-435
Cash flow
-7.4%
Cash-on-Cash Return
4.0%
Cap rate
0.8%
Rent to Value Ratio
Active
$749,900
5
bds
|
3
ba
|
3,219
sqft
|
built
1960
4937 Sheridan Ave S, Minneapolis, MN 55410
$-2,907
Cash flow
-20.2%
Cash-on-Cash Return
1.0%
Cap rate
0.3%
Rent to Value Ratio

Active
$275,000
3
bds
|
2
ba
|
1,125
sqft
|
built
1917
3835 Vincent Ave N, Minneapolis, MN 55412
$-89
Cash flow
-1.7%
Cash-on-Cash Return
5.3%
Cap rate
0.8%
Rent to Value Ratio
Active
$315,000
4
bds
|
3
ba
|
2,268
sqft
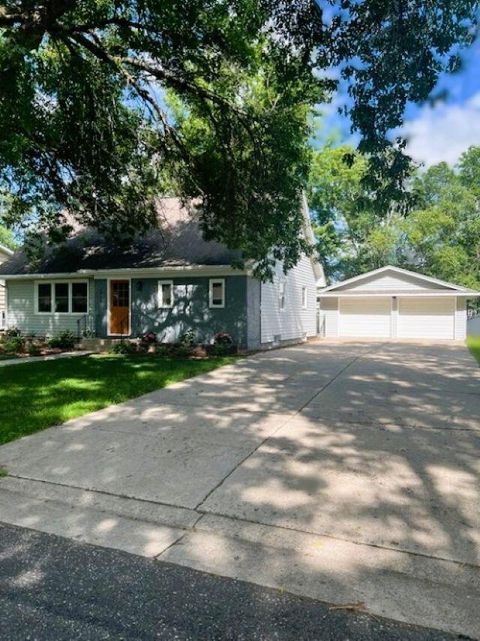
|
built
1966
2513 13th Ave SE, Saint Cloud, MN 56304
$-228
Cash flow
-3.8%
Cash-on-Cash Return
4.8%
Cap rate
0.7%
Rent to Value Ratio
Active
$749,900
3
bds
|
3
ba
|
2,024
sqft
|
built
2022
1013 Gardner St, Wayzata, MN 55391
$-1,670
Cash flow
-11.6%
Cash-on-Cash Return
3.0%
Cap rate
0.5%
Rent to Value Ratio

Active
$2,250,000
6
bds
|
10
ba
|
10,838
sqft
|
built
1989
4 W Bay Ln, Saint Paul, MN 55127
$-9,127
Cash flow
-21.2%
Cash-on-Cash Return
0.8%
Cap rate
0.2%
Rent to Value Ratio
Active
$699,900
4
bds
|
1
ba
|
1,713
sqft
|
built
1966
2230 Lake Pulaski Dr, Buffalo, MN 55313
$-2,525
Cash flow
-18.8%
Cash-on-Cash Return
1.3%
Cap rate
0.3%
Rent to Value Ratio
Active
$369,900
2
bds
|
3
ba
|
2,861
sqft
|
built
1999
9444 Kimberly Ln N, Osseo, MN 55311
$-668
Cash flow
-9.4%
Cash-on-Cash Return
3.5%
Cap rate
0.7%
Rent to Value Ratio

Active
$200,000
2
bds
|
1
ba
|
954
sqft
|
built
1984
4357 Buckingham Ct, Saint Paul, MN 55127
$-105
Cash flow
-2.7%
Cash-on-Cash Return
5.0%
Cap rate
1.0%
Rent to Value Ratio
Active
$750,000
2
bds
|
4
ba
|
3,071
sqft
|
built
2005
8117 Xerxes Cir, Bloomington, MN 55431
$-2,308
Cash flow
-16.1%
Cash-on-Cash Return
2.0%
Cap rate
0.5%
Rent to Value Ratio
Active
$370,000
3
bds
|
3
ba
|
1,944
sqft
|
built
2015
9351 Golden Pond Ln N, Monticello, MN 55362
$-84
Cash flow
-1.2%
Cash-on-Cash Return
5.4%
Cap rate
0.8%
Rent to Value Ratio
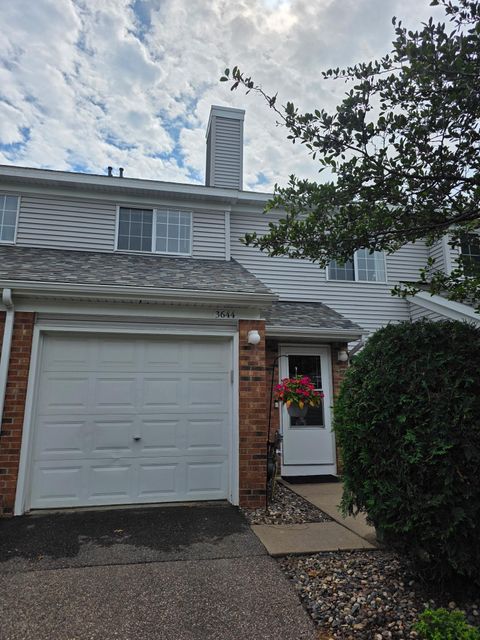
Active
$225,000
2
bds
|
1
ba
|
1,125
sqft
|
built
1993
3644 Linden Ave, White Bear Lake, MN 55110
$-246
Cash flow
-5.7%
Cash-on-Cash Return
4.4%
Cap rate
0.9%
Rent to Value Ratio
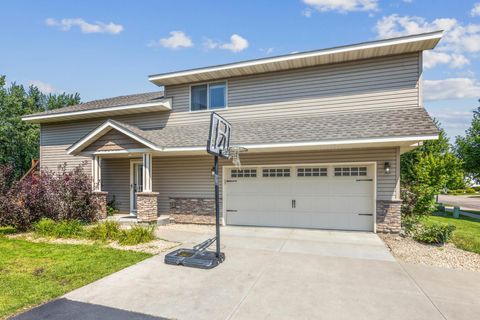
Active
$289,900
3
bds
|
2
ba
|
2,922
sqft
|
built
1968
1013 17th St SW, Willmar, MN 56201
$-364
Cash flow
-6.6%
Cash-on-Cash Return
4.2%
Cap rate
0.6%
Rent to Value Ratio
Active
$502,090
4
bds
|
3
ba
|
2,606
sqft
|
built
2025
6284 Highland Hills Ln S, Cottage Grove, MN 55016
$-495
Cash flow
-5.1%
Cash-on-Cash Return
4.5%
Cap rate
0.6%
Rent to Value Ratio
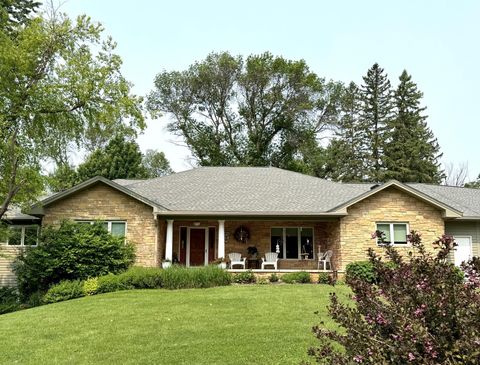
Active
$635,000
4
bds
|
3
ba
|
2,894
sqft
|
built
1985
1688 Chatham Ave, New Brighton, MN 55112
$-1,185
Cash flow
-9.7%
Cash-on-Cash Return
3.4%
Cap rate
0.6%
Rent to Value Ratio
Active
$599,900
4
bds
|
3
ba
|
2,748
sqft
|
built
2002
2447 Colleen Ln NE, Rochester, MN 55906
$-1,287
Cash flow
-11.2%
Cash-on-Cash Return
3.1%
Cap rate
0.5%
Rent to Value Ratio
Active
$539,900
4
bds
|
3
ba
|
2,548
sqft
|
built
1999
14580 30th St, Clear Lake, MN 55319
$-1,011
Cash flow
-9.8%
Cash-on-Cash Return
3.4%
Cap rate
0.5%
Rent to Value Ratio
Active
$699,900
4
bds
|
3
ba
|
2,857
sqft
|
built
1941
1017 Thomas Ave S, Minneapolis, MN 55405
$-1,631
Cash flow
-12.2%
Cash-on-Cash Return
2.9%
Cap rate
0.6%
Rent to Value Ratio
Active
$350,000
3
bds
|
1
ba
|
1,481
sqft
|
built
1939
6812 Irving Ave S, Richfield, MN 55423
$-379
Cash flow
-5.6%
Cash-on-Cash Return
4.4%
Cap rate
0.7%
Rent to Value Ratio
Active
$365,000
3
bds
|
2
ba
|
1,542
sqft
|
built
1953
4004 19th Ave S, Minneapolis, MN 55407
$-796
Cash flow
-11.4%
Cash-on-Cash Return
3.1%
Cap rate
0.5%
Rent to Value Ratio
Active
$220,000
4
bds
|
2
ba
|
1,800
sqft
|
built
1952
1340 9th Ave N, Saint Cloud, MN 56303
$-47
Cash flow
-1.1%
Cash-on-Cash Return
5.4%
Cap rate
0.8%
Rent to Value Ratio
Active
$299,900
2
bds
|
1
ba
|
933
sqft
|
built
1926
5641 Pillsbury Ave S, Minneapolis, MN 55419
$-324
Cash flow
-5.6%
Cash-on-Cash Return
4.4%
Cap rate
0.7%
Rent to Value Ratio
Active
$219,900
2
bds
|
2
ba
|
1,384
sqft
|
built
2005
315 Roosevelt St S, Cambridge, MN 55008
$-72
Cash flow
-1.7%
Cash-on-Cash Return
5.3%
Cap rate
0.9%
Rent to Value Ratio
Active
$312,500
2
bds
|
3
ba
|
1,770
sqft
|
built
2001
6979 Weston Ln N, Maple Grove, MN 55311
$-483
Cash flow
-8.1%
Cash-on-Cash Return
3.8%
Cap rate
0.8%
Rent to Value Ratio
Active
$349,900
3
bds
|
3
ba
|
2,270
sqft
|
built
2002
14290 Brookmere Blvd NW, Prior Lake, MN 55372
$-490
Cash flow
-7.3%
Cash-on-Cash Return
4.0%
Cap rate
0.7%
Rent to Value Ratio
Active
$849,900
5
bds
|
5
ba
|
6,121
sqft
|
built
2007
24352 474th Ln, Elysian, MN 56028
$-680
Cash flow
-4.2%
Cash-on-Cash Return
4.7%
Cap rate
0.7%
Rent to Value Ratio
Active
$235,000
3
bds
|
1
ba
|
1,039
sqft
|
built
1970
120 S Irving Ave, Rush City, MN 55069
$-61
Cash flow
-1.4%
Cash-on-Cash Return
5.4%
Cap rate
0.8%
Rent to Value Ratio
Active
$399,900
4
bds
|
4
ba
|
3,084
sqft
|
built
2001
6037 Bakken St, Monticello, MN 55362
$-293
Cash flow
-3.8%
Cash-on-Cash Return
4.8%
Cap rate
0.7%
Rent to Value Ratio
Active
$235,000
2
bds
|
2
ba
|
1,191
sqft
|
built
1978
1753 Bluebill Dr, Eagan, MN 55122
$-250
Cash flow
-5.6%
Cash-on-Cash Return
4.4%
Cap rate
0.9%
Rent to Value Ratio
Active
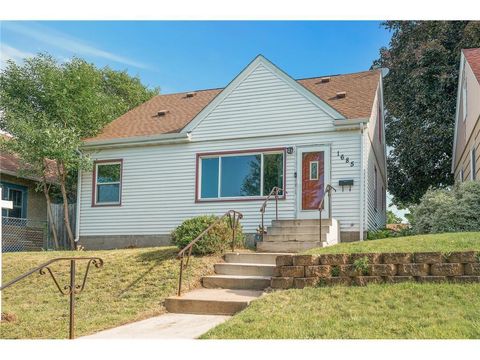
$302,600
4
bds
|
2
ba
|
1,915
sqft
|
built
1952
1685 Bush Ave, Saint Paul, MN 55106
$-191
Cash flow
-3.3%
Cash-on-Cash Return
4.9%
Cap rate
0.8%
Rent to Value Ratio
Active
$950,000
6
bds
|
5
ba
|
4,709
sqft
|
built
2006
13788 Kensington Ave NE, Prior Lake, MN 55372
$-1,443
Cash flow
-7.9%
Cash-on-Cash Return
3.9%
Cap rate
0.6%
Rent to Value Ratio
Active
$1,290,000
3
bds
|
3
ba
|
3,611
sqft
|
built
1994
12326 Falk Trl, Northfield, MN 55057
$-4,168
Cash flow
-16.9%
Cash-on-Cash Return
1.8%
Cap rate
0.3%
Rent to Value Ratio
Active
$1,599,900
4
bds
|
4
ba
|
4,640
sqft
|
built
2018
7737 Prairie Grass Pass, Prior Lake, MN 55372
$-3,237
Cash flow
-10.6%
Cash-on-Cash Return
3.3%
Cap rate
0.5%
Rent to Value Ratio