Jefferson County Investment Properties for Sale
Browse homes for sale and investment properties in Jefferson County. Refine your search by price, property type, or more.
Best cash flowing properties in Jefferson County
Active
$52,000
1
bds
|
1
ba
|
641
sqft
|
built
1939
605 Valentine St, Festus, MO 63028
$786
Cash flow
17.6%
Cash-on-Cash Return
18.1%
Cap rate
2.3%
Rent to Value Ratio
Active
$75,000
2
bds
|
1
ba
|
0
sqft
|
built
1956
4415 Oakridge Rd, Imperial, MO 63052
$418
Cash flow
29.1%
Cash-on-Cash Return
12.4%
Cap rate
1.6%
Rent to Value Ratio
27 out of 155 properties for sale in Jefferson County
Limited Results Shown
Create a free account, or log in to reveal all property listings and enjoy the complete experience.
Active
$248,500
3
bds
|
2
ba
|
2,022
sqft
|
built
1960
6105 Eime Rd, Cedar Hill, MO 63016
$-84
Cash flow
-1.8%
Cash-on-Cash Return
5.3%
Cap rate
0.7%
Rent to Value Ratio
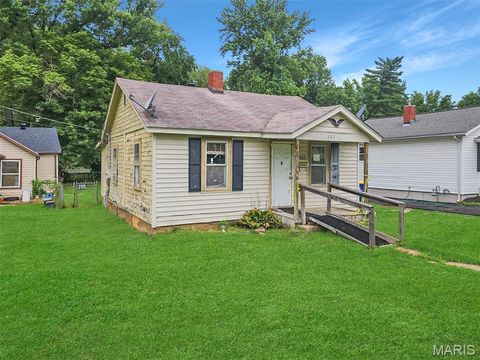
Active
$165,000
2
bds
|
1
ba
|
778
sqft
|
built
1945
607 Valentine St, Festus, MO 63028
$-72
Cash flow
-2.3%
Cash-on-Cash Return
5.2%
Cap rate
0.7%
Rent to Value Ratio
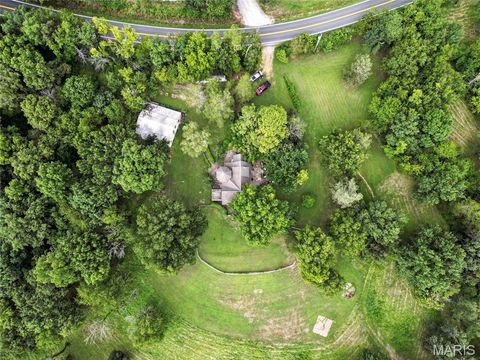
Active
$850,000
3
bds
|
2
ba
|
2,491
sqft
|
built
1957
2540 Pfinister School Rd, De Soto, MO 63020
$-2,599
Cash flow
-16.0%
Cash-on-Cash Return
2.0%
Cap rate
0.3%
Rent to Value Ratio
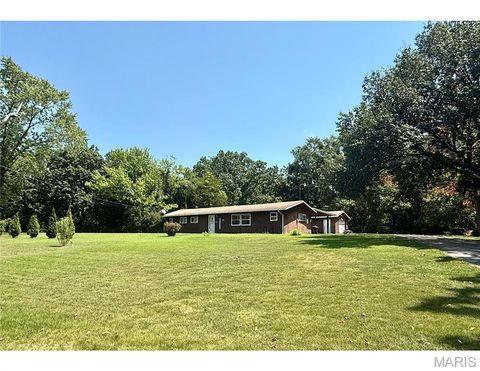
Active
$100,000
2
bds
|
1
ba
|
1,300
sqft
|
built
1964
4211 Old Rd, De Soto, MO 63020
$398
Cash flow
20.8%
Cash-on-Cash Return
10.5%
Cap rate
1.4%
Rent to Value Ratio
Active
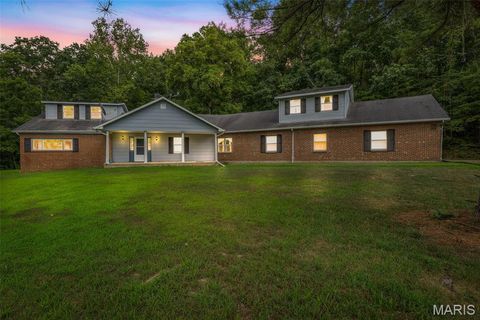
$350,000
3
bds
|
2
ba
|
2,700
sqft
|
built
1940
8646 State Road Ee, Dittmer, MO 63023
$-617
Cash flow
-9.2%
Cash-on-Cash Return
3.6%
Cap rate
0.5%
Rent to Value Ratio
Active
$180,000
3
bds
|
2
ba
|
1,269
sqft
|
built
1970
1506 Lonedell Rd, Arnold, MO 63010
$248
Cash flow
7.2%
Cash-on-Cash Return
7.3%
Cap rate
1.0%
Rent to Value Ratio
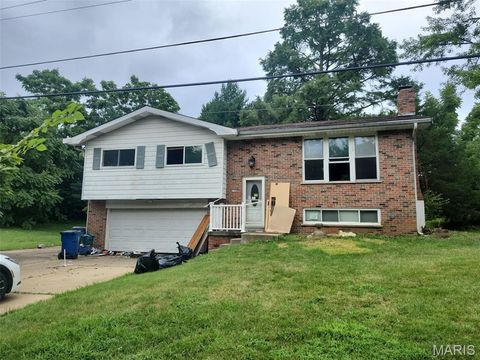
Active
$200,000
4
bds
|
2
ba
|
864
sqft
|
built
1981
4361 Woodridge Dr, Hillsboro, MO 63050
$-538
Cash flow
-14.0%
Cash-on-Cash Return
2.4%
Cap rate
0.7%
Rent to Value Ratio
Active
$139,500
2
bds
|
2
ba
|
864
sqft
|
built
1990
166 Samarra Estates Dr, Fenton, MO 63026
$-133
Cash flow
-5.0%
Cash-on-Cash Return
4.5%
Cap rate
1.0%
Rent to Value Ratio
Active
$399,900
3
bds
|
3
ba
|
2,940
sqft
|
built
2004
943 Shadow Pine Dr, Fenton, MO 63026
$-866
Cash flow
-11.3%
Cash-on-Cash Return
3.1%
Cap rate
0.5%
Rent to Value Ratio
Active
$369,000
4
bds
|
3
ba
|
2,091
sqft
|
built
2001
719 Camelot Estates Dr, Hillsboro, MO 63050
$-554
Cash flow
-7.8%
Cash-on-Cash Return
3.9%
Cap rate
0.5%
Rent to Value Ratio
Active
$380,000
3
bds
|
1
ba
|
1,920
sqft
|
built
1958
3008 High Ridge Dr, High Ridge, MO 63049
$-308
Cash flow
-4.2%
Cash-on-Cash Return
4.7%
Cap rate
0.6%
Rent to Value Ratio
Active
$79,900
1
bds
|
1
ba
|
896
sqft
|
built
1950
8502 State Road Ee, Dittmer, MO 63023
$399
Cash flow
26.1%
Cash-on-Cash Return
11.7%
Cap rate
1.5%
Rent to Value Ratio

Active
$394,900
3
bds
|
2
ba
|
1,550
sqft
|
built
1979
400 Maple Hollow Trl, Eureka, MO 63025
$-736
Cash flow
-9.7%
Cash-on-Cash Return
3.4%
Cap rate
0.5%
Rent to Value Ratio
Active
$425,000
3
bds
|
4
ba
|
2,158
sqft
|
built
1980
1 Seclusion Woods, Festus, MO 63028
$-374
Cash flow
-4.6%
Cash-on-Cash Return
4.6%
Cap rate
0.7%
Rent to Value Ratio

Active
$399,000
4
bds
|
3
ba
|
2,800
sqft
|
built
2023
407 Trenton Dr, De Soto, MO 63020
$-789
Cash flow
-10.3%
Cash-on-Cash Return
3.3%
Cap rate
0.5%
Rent to Value Ratio
Active
$220,000
5
bds
|
2
ba
|
1,640
sqft
|
built
1960
5225 Skyline Ct, Imperial, MO 63052
$224
Cash flow
5.3%
Cash-on-Cash Return
6.9%
Cap rate
0.9%
Rent to Value Ratio
Active
$113,000
1
bds
|
1
ba
|
780
sqft
|
built
1933
4358 Plattin Rd, Festus, MO 63028
$316
Cash flow
14.6%
Cash-on-Cash Return
9.0%
Cap rate
1.2%
Rent to Value Ratio
Active
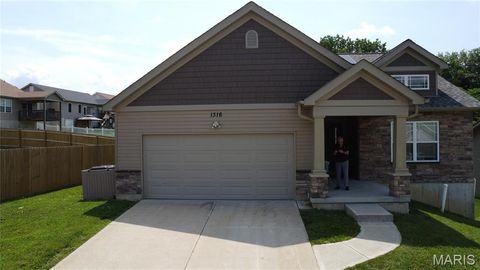
$335,000
3
bds
|
2
ba
|
1,582
sqft
|
built
2019
1316 Wesford Way, Herculaneum, MO 63048
$-366
Cash flow
-5.7%
Cash-on-Cash Return
4.4%
Cap rate
0.7%
Rent to Value Ratio
Active
$289,900
4
bds
|
3
ba
|
2,748
sqft
|
built
1986
2030 Engle Ridge Rd, Barnhart, MO 63012
$-320
Cash flow
-5.8%
Cash-on-Cash Return
4.4%
Cap rate
0.6%
Rent to Value Ratio
Active
$450,000
1
bds
|
0
ba
|
600
sqft
|
built
1925
8911 Kitson Ln, Cedar Hill, MO 63016
$-1,632
Cash flow
-18.9%
Cash-on-Cash Return
1.3%
Cap rate
0.2%
Rent to Value Ratio

Active
$94,900
3
bds
|
1
ba
|
764
sqft
|
built
1914
614 W Saint Louis St, De Soto, MO 63020
$309
Cash flow
17.0%
Cash-on-Cash Return
9.6%
Cap rate
1.3%
Rent to Value Ratio

Active
$380,900
2
bds
|
2
ba
|
1,968
sqft
|
built
1998
6703 Shenandoah Ln, Dittmer, MO 63023
$-510
Cash flow
-7.0%
Cash-on-Cash Return
4.1%
Cap rate
0.6%
Rent to Value Ratio

Active
$109,000
1
bds
|
1
ba
|
728
sqft
|
built
1920
1022 S 2nd St, De Soto, MO 63020
$36
Cash flow
1.7%
Cash-on-Cash Return
6.1%
Cap rate
0.7%
Rent to Value Ratio
Active
$374,900
4
bds
|
3
ba
|
3,512
sqft
|
built
2003
826 Oak Mill Ln, Imperial, MO 63052
$-492
Cash flow
-6.8%
Cash-on-Cash Return
4.1%
Cap rate
0.6%
Rent to Value Ratio

Active
$275,000
3
bds
|
2
ba
|
1,380
sqft
|
built
1964
12219 Peter Moore Ln, De Soto, MO 63020
$-182
Cash flow
-3.5%
Cash-on-Cash Return
4.9%
Cap rate
0.7%
Rent to Value Ratio