Montgomery, TX Investment Properties for Sale
Browse homes for sale and investment properties in Montgomery, TX. Refine your search by price, property type, or more.
Best cash flowing properties in Montgomery, TX

Active
$255,000
3
bds
|
0
ba
|
1,624
sqft
|
built
1976
118 April Point Dr N, Montgomery, TX 77356
$426
Cash flow
8.7%
Cash-on-Cash Return
7.7%
Cap rate
1.0%
Rent to Value Ratio

Active
$79,000
2
bds
|
0
ba
|
800
sqft
|
built
1966
16777 Stinson Ln, Montgomery, TX 77316
$385
Cash flow
25.4%
Cash-on-Cash Return
11.5%
Cap rate
1.6%
Rent to Value Ratio
610 out of 685 properties for sale in Montgomery, TX
Limited Results Shown
Create a free account, or log in to reveal all property listings and enjoy the complete experience.

Active
$259,999
3
bds
|
0
ba
|
1,624
sqft
|
built
1976
129 April Point Dr N, Montgomery, TX 77356
$-419
Cash flow
-8.4%
Cash-on-Cash Return
3.7%
Cap rate
0.8%
Rent to Value Ratio

Active
$3,500,000
bds
|
0
ba
|
0
sqft
|
built
2000
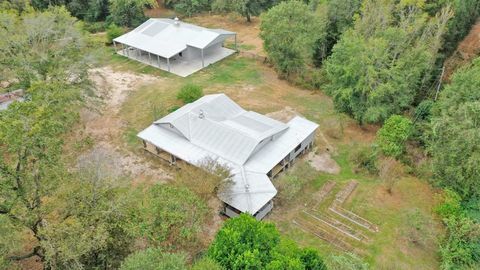
19637 W Fm 1097 Rd, Montgomery, TX 77356
$-15,107
Cash flow
-22.5%
Cash-on-Cash Return
0.5%
Cap rate
0.1%
Rent to Value Ratio

Active
$210,000
3
bds
|
0
ba
|
1,400
sqft
|
built
1982
19995 Lakeway Ln, Montgomery, TX 77356
$-396
Cash flow
-9.8%
Cash-on-Cash Return
3.4%
Cap rate
0.5%
Rent to Value Ratio

Active
$542,500
3
bds
|
0
ba
|
2,172
sqft
|
built
1978
12500 Melville Dr, Montgomery, TX 77356
$-1,467
Cash flow
-14.1%
Cash-on-Cash Return
2.4%
Cap rate
0.5%
Rent to Value Ratio

Active
$274,500
3
bds
|
0
ba
|
1,487
sqft
|
built
2003
120 Fairway View Ln, Montgomery, TX 77356
$-531
Cash flow
-10.1%
Cash-on-Cash Return
3.4%
Cap rate
0.7%
Rent to Value Ratio

Active
$1,120,000
5
bds
|
0
ba
|
4,262
sqft
|
built
2016
139 Ballantyne Dr, Montgomery, TX 77316
$-2,964
Cash flow
-13.8%
Cash-on-Cash Return
2.5%
Cap rate
0.5%
Rent to Value Ratio
Active
$1,599,000
4
bds
|
0
ba
|
5,074
sqft
|
built
2016
12838 Lake Shore Dr, Montgomery, TX 77356
$-4,371
Cash flow
-14.3%
Cash-on-Cash Return
2.4%
Cap rate
0.5%
Rent to Value Ratio

Active
$260,000
3
bds
|
0
ba
|
1,562
sqft
|
built
2018
159 Brocks Ln, Montgomery, TX 77356
$-362
Cash flow
-7.3%
Cash-on-Cash Return
4.0%
Cap rate
0.8%
Rent to Value Ratio
Active
$199,990
4
bds
|
0
ba
|
1,842
sqft
|
built
1988
16350 Eastchase, Montgomery, TX 77316
$-40
Cash flow
-1.0%
Cash-on-Cash Return
5.4%
Cap rate
0.9%
Rent to Value Ratio
Active
$79,000
2
bds
|
0
ba
|
800
sqft
|
built
1966
16777 Stinson Ln, Montgomery, TX 77316
$385
Cash flow
25.4%
Cash-on-Cash Return
11.5%
Cap rate
1.6%
Rent to Value Ratio

Active
$275,000
3
bds
|
0
ba
|
1,741
sqft
|
built
1975
10190 Dogwood Loop, Montgomery, TX 77316
$-178
Cash flow
-3.4%
Cash-on-Cash Return
4.9%
Cap rate
0.7%
Rent to Value Ratio

Active
$324,900
4
bds
|
0
ba
|
1,877
sqft
|
built
2021
1144 Courteous Creek Dr, Montgomery, TX 77316
$-763
Cash flow
-12.3%
Cash-on-Cash Return
2.9%
Cap rate
0.7%
Rent to Value Ratio

Active
$350,000
2
bds
|
0
ba
|
995
sqft
|
built
1996
12800 Melville Dr, Montgomery, TX 77356
$-1,524
Cash flow
-22.7%
Cash-on-Cash Return
0.5%
Cap rate
0.5%
Rent to Value Ratio

Active
$275,000
2
bds
|
0
ba
|
866
sqft
|
built
1996
12800 Melville Dr, Montgomery, TX 77356
$-850
Cash flow
-16.1%
Cash-on-Cash Return
2.0%
Cap rate
0.7%
Rent to Value Ratio

Active
$285,900
3
bds
|
0
ba
|
2,035
sqft
|
built
2003
225 Mesa Vw, Montgomery, TX 77316
$-419
Cash flow
-7.6%
Cash-on-Cash Return
3.9%
Cap rate
0.7%
Rent to Value Ratio
Active
$675,000
3
bds
|
0
ba
|
2,671
sqft
|
built
2021
149 Everest Dr, Montgomery, TX 77316
$-1,540
Cash flow
-11.9%
Cash-on-Cash Return
2.9%
Cap rate
0.7%
Rent to Value Ratio

Active
$1,395,000
4
bds
|
0
ba
|
3,572
sqft
|
built
1995
3742 Walden Estates Dr, Montgomery, TX 77356
$-5,348
Cash flow
-20.0%
Cash-on-Cash Return
1.1%
Cap rate
0.3%
Rent to Value Ratio
Active
$255,000
3
bds
|
0
ba
|
1,624
sqft
|
built
1976
118 April Point Dr N, Montgomery, TX 77356
$426
Cash flow
8.7%
Cash-on-Cash Return
7.7%
Cap rate
1.0%
Rent to Value Ratio
Active
$315,000
4
bds
|
0
ba
|
2,252
sqft
|
built
2022
449 Terra Vista Cir, Montgomery, TX 77356
$-434
Cash flow
-7.2%
Cash-on-Cash Return
4.0%
Cap rate
0.7%
Rent to Value Ratio

Active
$230,000
3
bds
|
0
ba
|
1,485
sqft
|
built
2022
15888 Chestnut Dr, Montgomery, TX 77356
$-66
Cash flow
-1.5%
Cash-on-Cash Return
5.3%
Cap rate
0.9%
Rent to Value Ratio

Active
$164,000
1
bds
|
0
ba
|
848
sqft
|
built
1978
15575 Marina Dr, Montgomery, TX 77356
$-417
Cash flow
-13.3%
Cash-on-Cash Return
2.6%
Cap rate
0.9%
Rent to Value Ratio

Active
$281,000
4
bds
|
0
ba
|
1,999
sqft
|
built
2008
13655 Leafy Arbor Dr, Montgomery, TX 77356
$-533
Cash flow
-9.9%
Cash-on-Cash Return
3.4%
Cap rate
0.7%
Rent to Value Ratio
Active
$1,075,000
2
bds
|
0
ba
|
1,216
sqft
|
built
2016
26210 Bluejack National Blvd, Montgomery, TX 77316
$-4,916
Cash flow
-23.9%
Cash-on-Cash Return
0.2%
Cap rate
0.3%
Rent to Value Ratio
Active
$675,000
6
bds
|
0
ba
|
4,754
sqft
|
built
1999
686 Edgewood Dr, Montgomery, TX 77356
$-1,642
Cash flow
-12.7%
Cash-on-Cash Return
2.8%
Cap rate
0.5%
Rent to Value Ratio
Active
$315,000
3
bds
|
0
ba
|
1,839
sqft
|
built
2004
11 Amelia Ct, Montgomery, TX 77356
$-543
Cash flow
-9.0%
Cash-on-Cash Return
3.6%
Cap rate
0.7%
Rent to Value Ratio

Active
$454,000
3
bds
|
0
ba
|
3,059
sqft
|
built
1996
13646 Leafy Arbor Dr, Montgomery, TX 77356
$-901
Cash flow
-10.4%
Cash-on-Cash Return
3.3%
Cap rate
0.7%
Rent to Value Ratio

Pending
$119,000
1
bds
|
0
ba
|
663
sqft
|
built
1981
12900 Walden Rd, Montgomery, TX 77356
$-103
Cash flow
-4.5%
Cash-on-Cash Return
4.6%
Cap rate
0.9%
Rent to Value Ratio

Active
$319,000
1
bds
|
0
ba
|
852
sqft
|
built
1978
15575 Marina Dr, Montgomery, TX 77356
$-907
Cash flow
-14.8%
Cash-on-Cash Return
2.3%
Cap rate
0.6%
Rent to Value Ratio
Active
$578,999
3
bds
|
0
ba
|
3,292
sqft
|
built
2022
55 Ruskin Dr W, Montgomery, TX 77356
$-742
Cash flow
-6.7%
Cash-on-Cash Return
4.1%
Cap rate
0.5%
Rent to Value Ratio

Active
$529,000
4
bds
|
0
ba
|
3,156
sqft
|
built
2014
106 Jackson Park St, Montgomery, TX 77316
$-1,104
Cash flow
-10.9%
Cash-on-Cash Return
3.2%
Cap rate
0.7%
Rent to Value Ratio

Active
$599,990
4
bds
|
0
ba
|
2,425
sqft
|
built
2022
286 Sky Top Dr, Montgomery, TX 77316
$-1,360
Cash flow
-11.8%
Cash-on-Cash Return
3.0%
Cap rate
0.6%
Rent to Value Ratio

Active
$499,000
4
bds
|
0
ba
|
2,424
sqft
|
built
2022
168 Wick Willow Rd, Montgomery, TX 77356
$-985
Cash flow
-10.3%
Cash-on-Cash Return
3.3%
Cap rate
0.6%
Rent to Value Ratio

Active
$1,449,000
4
bds
|
0
ba
|
4,105
sqft
|
built
2022
324 S Opulent Dr, Montgomery, TX 77316
$-3,457
Cash flow
-12.4%
Cash-on-Cash Return
2.8%
Cap rate
0.6%
Rent to Value Ratio

Active
$875,000
3
bds
|
0
ba
|
3,233
sqft
|
built
2005
11584 Grandview Dr, Montgomery, TX 77356
$-2,428
Cash flow
-14.5%
Cash-on-Cash Return
2.3%
Cap rate
0.5%
Rent to Value Ratio
Active
$727,400
bds
|
0
ba
|
2,279
sqft
|
built
2010
23405 Martha Williams Rd, Montgomery, TX 77356
$-1,578
Cash flow
-11.3%
Cash-on-Cash Return
3.1%
Cap rate
0.5%
Rent to Value Ratio

Active
$1,600,000
3
bds
|
0
ba
|
2,360
sqft
|
built
2016
25637 W Fm 1097 Rd, Montgomery, TX 77356
$-5,796
Cash flow
-18.9%
Cash-on-Cash Return
1.3%
Cap rate
0.2%
Rent to Value Ratio

Active
$479,000
4
bds
|
0
ba
|
2,832
sqft
|
built
2011
123 Clearmont Pl, Montgomery, TX 77316
$-942
Cash flow
-10.3%
Cash-on-Cash Return
3.3%
Cap rate
0.6%
Rent to Value Ratio
Active
$259,000
3
bds
|
0
ba
|
2,244
sqft
|
built
2007
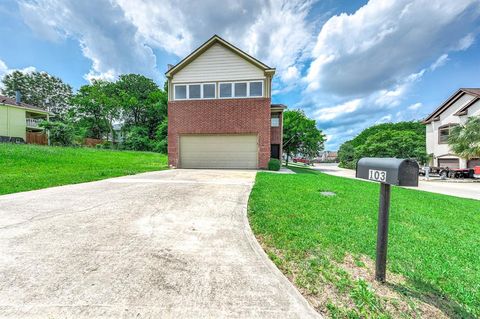
103 Capetown Cir, Montgomery, TX 77356
$-433
Cash flow
-8.7%
Cash-on-Cash Return
3.7%
Cap rate
0.8%
Rent to Value Ratio

Active
$2,950,000
6
bds
|
0
ba
|
8,018
sqft
|
built
2008
19996 Crescent Ct, Montgomery, TX 77356
$-10,796
Cash flow
-19.1%
Cash-on-Cash Return
1.3%
Cap rate
0.3%
Rent to Value Ratio

Active
$695,000
4
bds
|
0
ba
|
2,890
sqft
|
built
2022
240 Fish Creek Ln, Montgomery, TX 77316
$-1,889
Cash flow
-14.2%
Cash-on-Cash Return
2.4%
Cap rate
0.6%
Rent to Value Ratio