Montgomery, TX Investment Properties for Sale
Browse homes for sale and investment properties in Montgomery, TX. Refine your search by price, property type, or more.
Best cash flowing properties in Montgomery, TX

Active
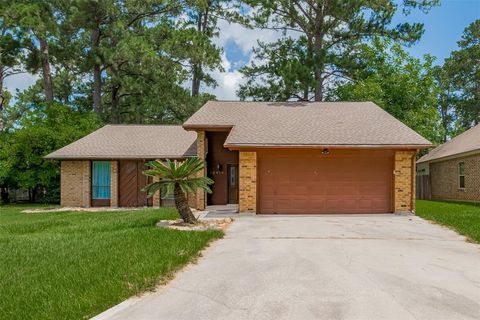
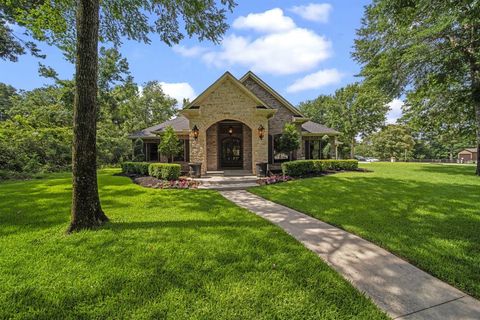
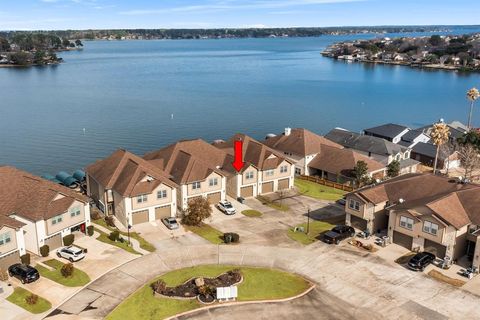
$255,000
3
bds
|
3
ba
|
1,624
sqft
|
built
1976
118 April Point Dr N, Montgomery, TX 77356
$426
Cash flow
8.7%
Cash-on-Cash Return
7.7%
Cap rate
1.0%
Rent to Value Ratio
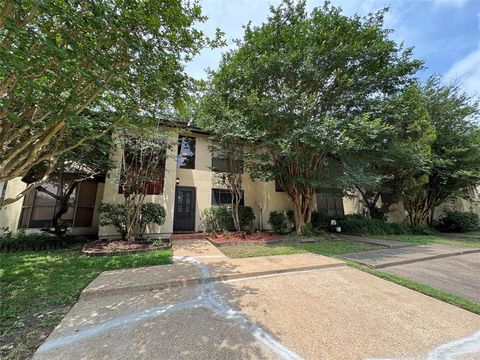
Active
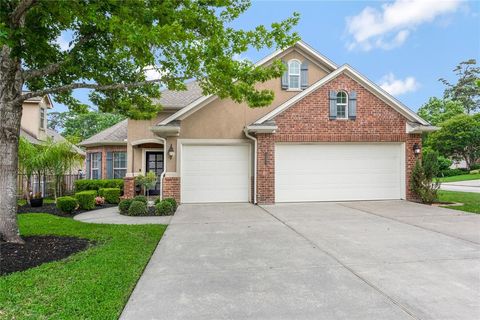
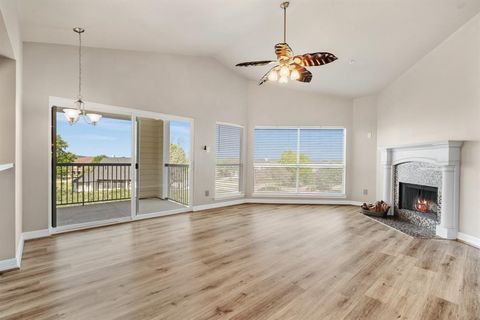
$220,000
3
bds
|
2
ba
|
1,539
sqft
|
built
1984
10419 Twin Circles Dr, Montgomery, TX 77356
$-119
Cash flow
-2.8%
Cash-on-Cash Return
5.0%
Cap rate
0.9%
Rent to Value Ratio
379 out of 688 properties for sale in Montgomery, TX
Limited Results Shown
Create a free account, or log in to reveal all property listings and enjoy the complete experience.
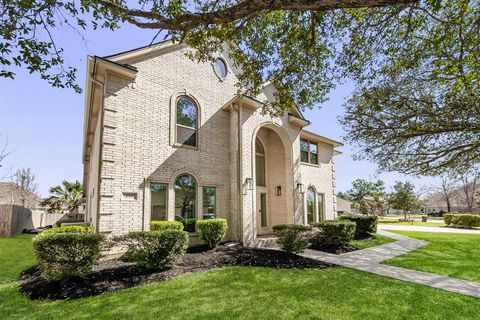
Active
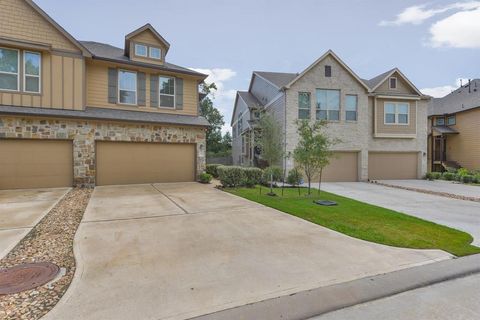
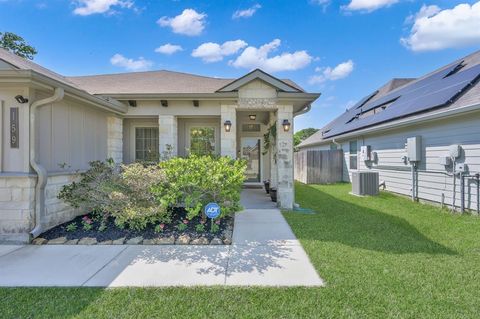
$750,000
4
bds
|
3
ba
|
2,922
sqft
|
built
2007
11068 First Lgt, Montgomery, TX 77356
$-2,178
Cash flow
-15.2%
Cash-on-Cash Return
2.2%
Cap rate
0.5%
Rent to Value Ratio
Active
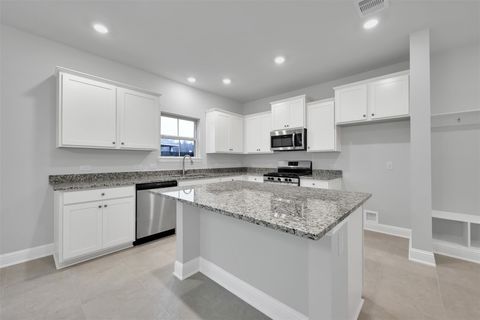
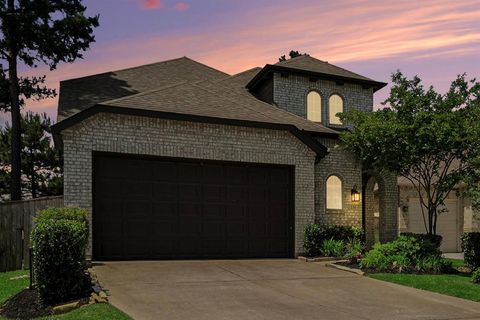
$289,500
4
bds
|
3
ba
|
2,252
sqft
|
built
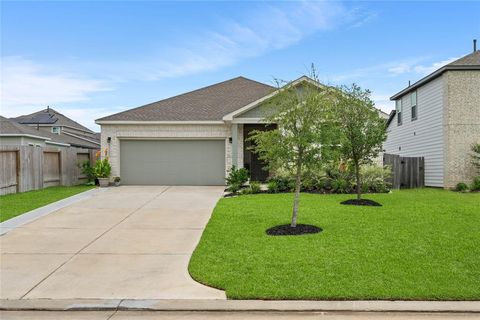
2020
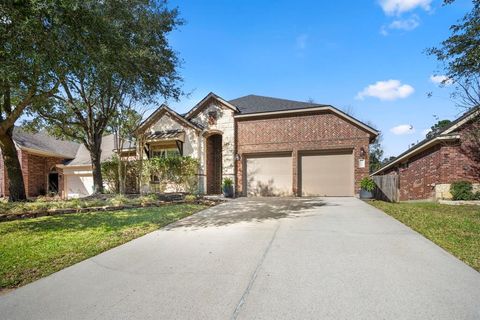
449 Terra Vista Cir, Montgomery, TX 77356
$-313
Cash flow
-5.6%
Cash-on-Cash Return
4.4%
Cap rate
0.8%
Rent to Value Ratio
Active
$316,900
3
bds
|
3
ba
|
1,962
sqft
|
built
2015
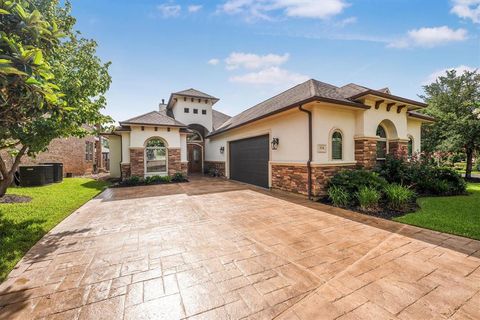
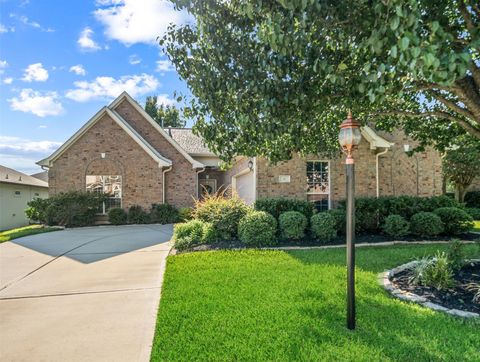
162 Cheswood Forest Pl, Montgomery, TX 77316
$-627
Cash flow
-10.3%
Cash-on-Cash Return
3.3%
Cap rate
0.7%
Rent to Value Ratio
Active
$975,000
4
bds
|
3
ba
|
2,515
sqft
|
built
2016
174 Creekwood E, Montgomery, TX 77356
$-3,414
Cash flow
-18.3%
Cash-on-Cash Return
1.5%
Cap rate
0.3%
Rent to Value Ratio
Active
$289,000
3
bds
|
3
ba
|
2,279
sqft
|
built
2004
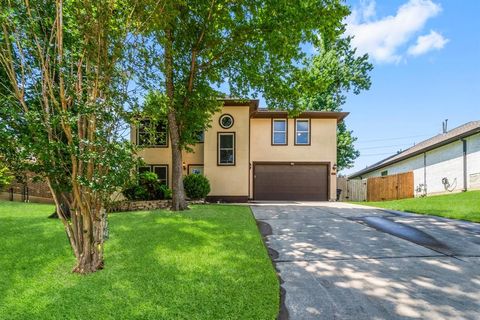
4313 Windswept Dr, Montgomery, TX 77356
$-467
Cash flow
-8.4%
Cash-on-Cash Return
3.7%
Cap rate
0.8%
Rent to Value Ratio
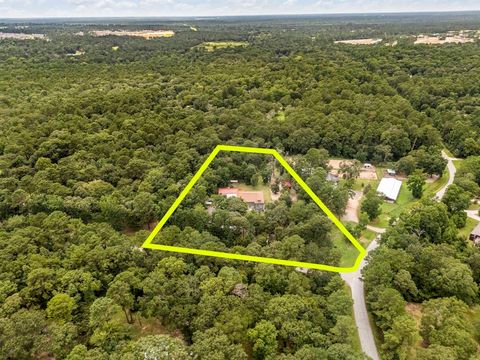
Active
$2,000,000
bds
|
0
ba
|
0
sqft
|
built
2000
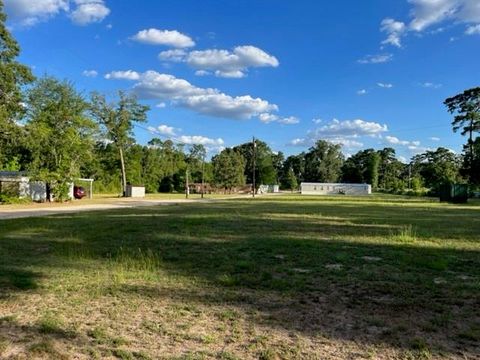
19637 W Fm 1097 Rd, Montgomery, TX 77356
$-8,009
Cash flow
-20.9%
Cash-on-Cash Return
0.9%
Cap rate
0.1%
Rent to Value Ratio

Active
$190,000
3
bds
|
2
ba
|
1,400
sqft
|
built
1982
19995 Lakeway Ln, Montgomery, TX 77356
$-301
Cash flow
-8.3%
Cash-on-Cash Return
3.8%
Cap rate
0.6%
Rent to Value Ratio
Active
$850,000
5
bds
|
4
ba
|
3,924
sqft
|
built
2012
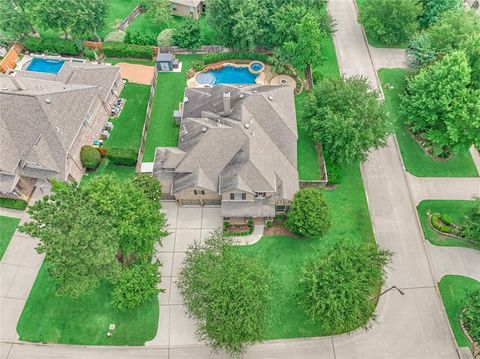
117 Hawkwatch Dr, Montgomery, TX 77316
$-2,402
Cash flow
-14.7%
Cash-on-Cash Return
2.3%
Cap rate
0.5%
Rent to Value Ratio
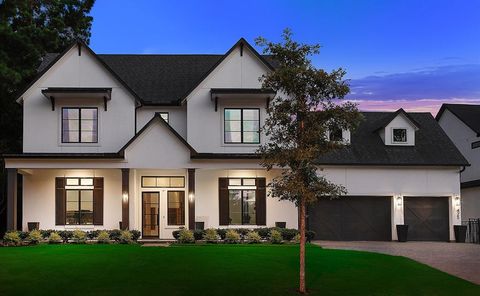
Active
$469,000
4
bds
|
3
ba
|
2,832
sqft
|
built
2011
123 Clearmont Pl, Montgomery, TX 77316
$-894
Cash flow
-9.9%
Cash-on-Cash Return
3.4%
Cap rate
0.7%
Rent to Value Ratio
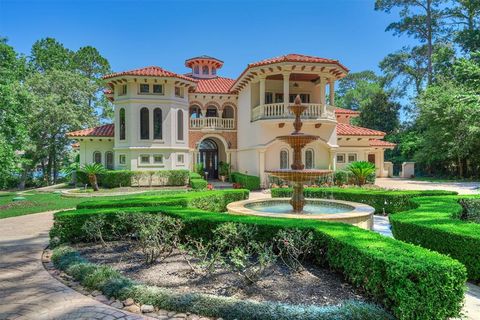
Active
$4,500,000
4
bds
|
7
ba
|
8,154
sqft
|
built
2000
786 River Rd, Montgomery, TX 77356
$-16,429
Cash flow
-19.0%
Cash-on-Cash Return
1.3%
Cap rate
0.2%
Rent to Value Ratio
Active
$195,000
2
bds
|
3
ba
|
1,430
sqft
|
built
1983
3823 Knollcrest Dr, Montgomery, TX 77356
$-244
Cash flow
-6.5%
Cash-on-Cash Return
4.2%
Cap rate
0.8%
Rent to Value Ratio
Active
$665,000
6
bds
|
5
ba
|
4,754
sqft
|
built
1999
686 Edgewood Dr, Montgomery, TX 77356
$-1,595
Cash flow
-12.5%
Cash-on-Cash Return
2.8%
Cap rate
0.5%
Rent to Value Ratio
Active
$325,000
3
bds
|
2
ba
|
1,839
sqft
|
built
2004
11 Amelia Ct, Montgomery, TX 77356
$-595
Cash flow
-9.6%
Cash-on-Cash Return
3.5%
Cap rate
0.7%
Rent to Value Ratio
Active
$1,525,000
5
bds
|
5
ba
|
3,740
sqft
|
built
2019
425 N Copa Palm Loop, Montgomery, TX 77316
$-3,526
Cash flow
-12.1%
Cash-on-Cash Return
2.9%
Cap rate
0.6%
Rent to Value Ratio
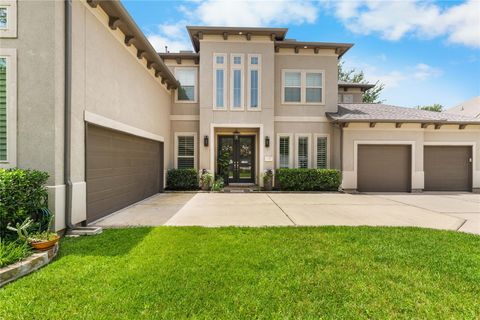
Active
$1,025,000
5
bds
|
5
ba
|
4,262
sqft
|
built
2016
139 Ballantyne Dr, Montgomery, TX 77316
$-2,515
Cash flow
-12.8%
Cash-on-Cash Return
2.7%
Cap rate
0.6%
Rent to Value Ratio
Active
$775,000
6
bds
|
4
ba
|
5,610
sqft
|
built
2006
1823 Will Scarlett St, Montgomery, TX 77316
$-1,143
Cash flow
-7.7%
Cash-on-Cash Return
3.9%
Cap rate
0.6%
Rent to Value Ratio
Active
$729,900
3
bds
|
4
ba
|
2,681
sqft
|
built
2006
261 Ridge Lake Dr, Montgomery, TX 77316
$-1,790
Cash flow
-12.8%
Cash-on-Cash Return
2.7%
Cap rate
0.5%
Rent to Value Ratio
Active
$325,000
2
bds
|
2
ba
|
995
sqft
|
built
1996
12800 Melville Dr, Montgomery, TX 77356
$-1,406
Cash flow
-22.6%
Cash-on-Cash Return
0.5%
Cap rate
0.5%
Rent to Value Ratio
Active
$435,000
5
bds
|
3
ba
|
2,953
sqft
|
built
2019
226 Aster View Ct, Montgomery, TX 77316
$-884
Cash flow
-10.6%
Cash-on-Cash Return
3.2%
Cap rate
0.7%
Rent to Value Ratio
Active
$250,000
3
bds
|
2
ba
|
1,562
sqft
|
built
2018
159 Brocks Ln, Montgomery, TX 77356
$-315
Cash flow
-6.6%
Cash-on-Cash Return
4.2%
Cap rate
0.8%
Rent to Value Ratio
Active
$535,000
3
bds
|
3
ba
|
1,936
sqft
|
built
2006
17570 Highway 105 W, Montgomery, TX 77356
$-1,600
Cash flow
-15.6%
Cash-on-Cash Return
2.1%
Cap rate
0.5%
Rent to Value Ratio
Active
$310,000
4
bds
|
2
ba
|
1,984
sqft
|
built
2004
3722 Northshore Dr, Montgomery, TX 77356
$-849
Cash flow
-14.3%
Cash-on-Cash Return
2.4%
Cap rate
0.6%
Rent to Value Ratio
Active
$410,000
4
bds
|
4
ba
|
2,479
sqft
|
built
2021
235 Crest Edge St, Montgomery, TX 77316
$-936
Cash flow
-11.9%
Cash-on-Cash Return
2.9%
Cap rate
0.7%
Rent to Value Ratio
Active
$379,000
3
bds
|
2
ba
|
2,400
sqft
|
built
1993
66 Winthrop Hbr S, Montgomery, TX 77356
$-731
Cash flow
-10.1%
Cash-on-Cash Return
3.4%
Cap rate
0.7%
Rent to Value Ratio

Active
$310,000
3
bds
|
3
ba
|
1,924
sqft
|
built
2016
114 Mimosa Silk Ct, Montgomery, TX 77316
$-586
Cash flow
-9.9%
Cash-on-Cash Return
3.4%
Cap rate
0.7%
Rent to Value Ratio
Active
$487,500
3
bds
|
3
ba
|
3,219
sqft
|
built
1997
110 Wick Willow Dr, Montgomery, TX 77356
$-1,002
Cash flow
-10.7%
Cash-on-Cash Return
3.2%
Cap rate
0.6%
Rent to Value Ratio
Active
$210,000
2
bds
|
2
ba
|
1,193
sqft
|
built
1976
198 April Point Dr N, Montgomery, TX 77356
$-139
Cash flow
-3.5%
Cash-on-Cash Return
4.9%
Cap rate
0.9%
Rent to Value Ratio
Active
$390,000
4
bds
|
3
ba
|
2,515
sqft
|
built
2012
106 Colina Vista Way, Montgomery, TX 77316
$-720
Cash flow
-9.6%
Cash-on-Cash Return
3.5%
Cap rate
0.7%
Rent to Value Ratio
Active
$578,999
3
bds
|
3
ba
|
3,292
sqft
|
built
2022
55 Ruskin Dr W, Montgomery, TX 77356
$-742
Cash flow
-6.7%
Cash-on-Cash Return
4.1%
Cap rate
0.5%
Rent to Value Ratio
Active
$295,000
4
bds
|
2
ba
|
1,932
sqft
|
built
2023
5732 Palm Flower Dr, Montgomery, TX 77316
$-729
Cash flow
-12.9%
Cash-on-Cash Return
2.7%
Cap rate
0.7%
Rent to Value Ratio
Active
$109,000
1
bds
|
1
ba
|
618
sqft
|
built
1979
12900 Walden Rd, Montgomery, TX 77356
$-140
Cash flow
-6.7%
Cash-on-Cash Return
4.1%
Cap rate
1.1%
Rent to Value Ratio
Active
$109,000
1
bds
|
1
ba
|
489
sqft
|
built
1979
13151 Walden Rd, Montgomery, TX 77356
$-297
Cash flow
-14.2%
Cash-on-Cash Return
2.4%
Cap rate
0.9%
Rent to Value Ratio

Active
$325,000
3
bds
|
3
ba
|
1,771
sqft
|
built
2022
584 Long Leaf Pine Dr, Montgomery, TX 77316
$-651
Cash flow
-10.5%
Cash-on-Cash Return
3.3%
Cap rate
0.7%
Rent to Value Ratio
Active
$434,900
4
bds
|
3
ba
|
3,056
sqft
|
built
2022
215 Little Dog Dr, Montgomery, TX 77356
$-450
Cash flow
-5.4%
Cash-on-Cash Return
4.4%
Cap rate
0.8%
Rent to Value Ratio
Active
$678,000
4
bds
|
4
ba
|
3,300
sqft
|
built
2024
108 Stephens Ridge Ln, Montgomery, TX 77316
$-819
Cash flow
-6.3%
Cash-on-Cash Return
4.2%
Cap rate
0.6%
Rent to Value Ratio
Active
$895,000
5
bds
|
4
ba
|
3,526
sqft
|
built
2018
89 Grandview Blvd, Montgomery, TX 77356
$-1,230
Cash flow
-7.2%
Cash-on-Cash Return
4.0%
Cap rate
0.5%
Rent to Value Ratio
Active
$279,500
4
bds
|
3
ba
|
1,835
sqft
|
built
2012
406 Lazy Ln, Montgomery, TX 77356
$-299
Cash flow
-5.6%
Cash-on-Cash Return
4.4%
Cap rate
0.7%
Rent to Value Ratio
Active
$800,000
4
bds
|
4
ba
|
4,079
sqft
|
built
2005
90 Greenview St, Montgomery, TX 77356
$-1,749
Cash flow
-11.4%
Cash-on-Cash Return
3.1%
Cap rate
0.6%
Rent to Value Ratio