Montgomery, TX Investment Properties for Sale
Browse homes for sale and investment properties in Montgomery, TX. Refine your search by price, property type, or more.
Best cash flowing properties in Montgomery, TX
Active
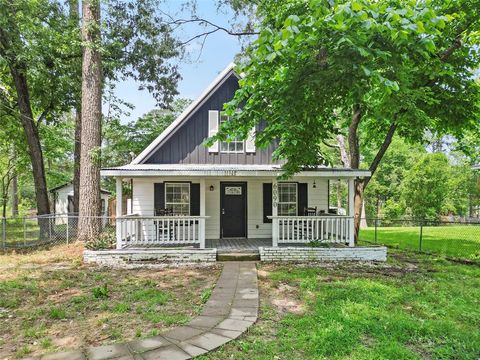
$179,000
3
bds
|
0
ba
|
1,400
sqft
|
built
1971
6090 Skylane Dr, Montgomery, TX 77316
$-63
Cash flow
-1.8%
Cash-on-Cash Return
5.8%
Cap rate
0.9%
Rent to Value Ratio
Active
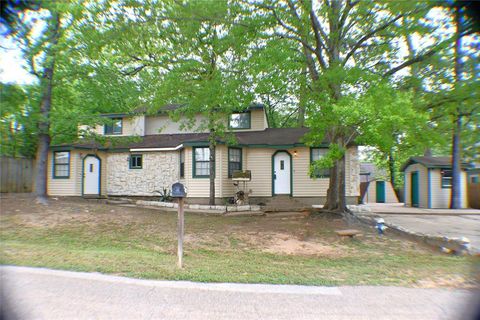
$199,990
4
bds
|
0
ba
|
1,842
sqft
|
built
1988
16350 Eastchase, Montgomery, TX 77316
$-138
Cash flow
-3.6%
Cash-on-Cash Return
5.4%
Cap rate
0.9%
Rent to Value Ratio
540 out of 581 properties for sale in Montgomery, TX
Limited Results Shown
Create a free account, or log in to reveal all property listings and enjoy the complete experience.
Active
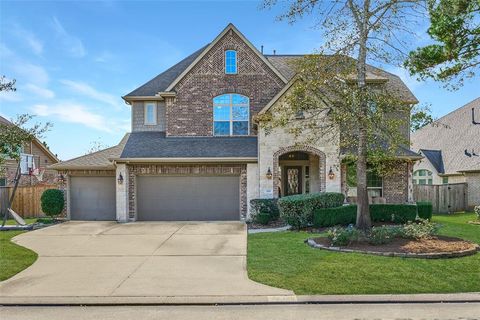
$565,000
4
bds
|
0
ba
|
3,015
sqft
|
built
2015
120 Shane St, Montgomery, TX 77316
$-1,227
Cash flow
-11.3%
Cash-on-Cash Return
3.7%
Cap rate
0.7%
Rent to Value Ratio

Active
$1,600,000
3
bds
|
0
ba
|
2,360
sqft
|
built
2016
25637 W Fm 1097 Rd, Montgomery, TX 77356
$-6,577
Cash flow
-21.4%
Cash-on-Cash Return
1.3%
Cap rate
0.2%
Rent to Value Ratio

Active
$281,000
4
bds
|
0
ba
|
1,999
sqft
|
built
2008
13655 Leafy Arbor Dr, Montgomery, TX 77356
$-670
Cash flow
-12.4%
Cash-on-Cash Return
3.4%
Cap rate
0.7%
Rent to Value Ratio
Active
$999,000
5
bds
|
0
ba
|
4,987
sqft
|
built
2013
110 Pickerel Pt, Montgomery, TX 77316
$-2,443
Cash flow
-12.8%
Cash-on-Cash Return
3.3%
Cap rate
0.6%
Rent to Value Ratio

Active
$1,120,000
5
bds
|
0
ba
|
4,262
sqft
|
built
2016
139 Ballantyne Dr, Montgomery, TX 77316
$-3,511
Cash flow
-16.4%
Cash-on-Cash Return
2.5%
Cap rate
0.5%
Rent to Value Ratio

Active
$499,000
4
bds
|
0
ba
|
2,424
sqft
|
built
2022
168 Wick Willow Rd, Montgomery, TX 77356
$-1,229
Cash flow
-12.9%
Cash-on-Cash Return
3.3%
Cap rate
0.6%
Rent to Value Ratio
Active
$230,000
3
bds
|
0
ba
|
1,539
sqft
|
built
1984
10419 Twin Circles Dr, Montgomery, TX 77356
$-279
Cash flow
-6.3%
Cash-on-Cash Return
4.8%
Cap rate
0.8%
Rent to Value Ratio
Active
$915,000
5
bds
|
0
ba
|
3,526
sqft
|
built
2018
89 Grandview Blvd, Montgomery, TX 77356
$-2,542
Cash flow
-14.5%
Cash-on-Cash Return
2.9%
Cap rate
0.5%
Rent to Value Ratio
Active
$179,000
3
bds
|
0
ba
|
1,400
sqft
|
built
1971
6090 Skylane Dr, Montgomery, TX 77316
$-63
Cash flow
-1.8%
Cash-on-Cash Return
5.8%
Cap rate
0.9%
Rent to Value Ratio
Active
$299,999
4
bds
|
0
ba
|
1,835
sqft
|
built
2012
406 Lazy Ln, Montgomery, TX 77356
$-542
Cash flow
-9.4%
Cash-on-Cash Return
4.1%
Cap rate
0.7%
Rent to Value Ratio

Active
$274,500
3
bds
|
0
ba
|
1,487
sqft
|
built
2003
120 Fairway View Ln, Montgomery, TX 77356
$-665
Cash flow
-12.6%
Cash-on-Cash Return
3.4%
Cap rate
0.7%
Rent to Value Ratio

Active
$785,000
4
bds
|
0
ba
|
3,314
sqft
|
built
2006
11848 Seashell Cir, Montgomery, TX 77356
$-1,889
Cash flow
-12.6%
Cash-on-Cash Return
3.4%
Cap rate
0.6%
Rent to Value Ratio
Active
$315,000
4
bds
|
0
ba
|
2,252
sqft
|
built
2022
449 Terra Vista Cir, Montgomery, TX 77356
$-588
Cash flow
-9.7%
Cash-on-Cash Return
4.0%
Cap rate
0.7%
Rent to Value Ratio
Active
$675,000
6
bds
|
0
ba
|
4,754
sqft
|
built
1999
686 Edgewood Dr, Montgomery, TX 77356
$-1,972
Cash flow
-15.2%
Cash-on-Cash Return
2.8%
Cap rate
0.5%
Rent to Value Ratio

Active
$989,000
4
bds
|
0
ba
|
4,063
sqft
|
built
2004
11409 E Zoe Loop Dr, Montgomery, TX 77316
$-2,953
Cash flow
-15.6%
Cash-on-Cash Return
2.7%
Cap rate
0.5%
Rent to Value Ratio

Active
$454,000
3
bds
|
0
ba
|
3,059
sqft
|
built
1996
13646 Leafy Arbor Dr, Montgomery, TX 77356
$-1,123
Cash flow
-12.9%
Cash-on-Cash Return
3.3%
Cap rate
0.7%
Rent to Value Ratio

Active
$1,075,000
5
bds
|
0
ba
|
4,641
sqft
|
built
1983
9243 Deepwater Dr, Montgomery, TX 77356
$-4,076
Cash flow
-19.8%
Cash-on-Cash Return
1.7%
Cap rate
0.4%
Rent to Value Ratio

Active
$1,395,000
4
bds
|
0
ba
|
3,572
sqft
|
built
1995
3742 Walden Estates Dr, Montgomery, TX 77356
$-6,029
Cash flow
-22.5%
Cash-on-Cash Return
1.1%
Cap rate
0.3%
Rent to Value Ratio

Active
$210,000
3
bds
|
0
ba
|
1,400
sqft
|
built
1982
19995 Lakeway Ln, Montgomery, TX 77356
$-498
Cash flow
-12.4%
Cash-on-Cash Return
3.4%
Cap rate
0.5%
Rent to Value Ratio
Active
$1,695,000
3
bds
|
0
ba
|
1,844
sqft
|
built
1999
6570 N Fm 1486 Rd, Montgomery, TX 77356
$-7,193
Cash flow
-22.1%
Cash-on-Cash Return
1.2%
Cap rate
0.2%
Rent to Value Ratio

Active
$275,000
3
bds
|
0
ba
|
1,741
sqft
|
built
1975
10190 Dogwood Loop, Montgomery, TX 77316
$-313
Cash flow
-5.9%
Cash-on-Cash Return
4.9%
Cap rate
0.7%
Rent to Value Ratio

Active
$875,000
3
bds
|
0
ba
|
3,233
sqft
|
built
2005
11584 Grandview Dr, Montgomery, TX 77356
$-2,855
Cash flow
-17.0%
Cash-on-Cash Return
2.3%
Cap rate
0.5%
Rent to Value Ratio

Active
$695,000
4
bds
|
0
ba
|
2,890
sqft
|
built
2022
240 Fish Creek Ln, Montgomery, TX 77316
$-2,228
Cash flow
-16.7%
Cash-on-Cash Return
2.4%
Cap rate
0.6%
Rent to Value Ratio
Active
$4,500,000
4
bds
|
0
ba
|
8,154
sqft
|
built
2000
786 River Rd, Montgomery, TX 77356
$-18,627
Cash flow
-21.6%
Cash-on-Cash Return
1.3%
Cap rate
0.2%
Rent to Value Ratio
Active
$199,990
4
bds
|
0
ba
|
1,842
sqft
|
built
1988
16350 Eastchase, Montgomery, TX 77316
$-138
Cash flow
-3.6%
Cash-on-Cash Return
5.4%
Cap rate
0.9%
Rent to Value Ratio

Active
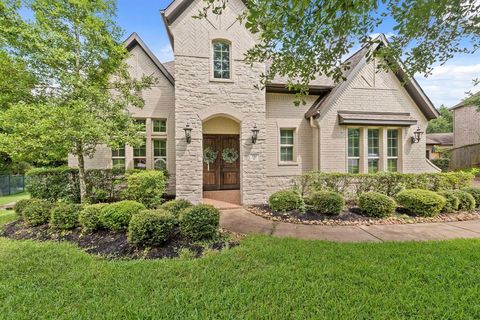
$479,000
4
bds
|
0
ba
|
2,832
sqft
|
built
2011
123 Clearmont Pl, Montgomery, TX 77316
$-1,176
Cash flow
-12.8%
Cash-on-Cash Return
3.3%
Cap rate
0.6%
Rent to Value Ratio

Active
$2,950,000
6
bds
|
0
ba
|
8,018
sqft
|
built
2008
19996 Crescent Ct, Montgomery, TX 77356
$-12,237
Cash flow
-21.6%
Cash-on-Cash Return
1.3%
Cap rate
0.3%
Rent to Value Ratio
Active
$727,400
bds
|
0
ba
|
2,279
sqft
|
built
2010
23405 Martha Williams Rd, Montgomery, TX 77356
$-1,934
Cash flow
-13.9%
Cash-on-Cash Return
3.1%
Cap rate
0.5%
Rent to Value Ratio

Active
$425,000
3
bds
|
0
ba
|
2,353
sqft
|
built
1999
188 Park Way, Montgomery, TX 77356
$-1,186
Cash flow
-14.6%
Cash-on-Cash Return
2.9%
Cap rate
0.6%
Rent to Value Ratio
Active
$800,000
4
bds
|
0
ba
|
4,079
sqft
|
built
2005
90 Greenview St, Montgomery, TX 77356
$-2,140
Cash flow
-14.0%
Cash-on-Cash Return
3.1%
Cap rate
0.6%
Rent to Value Ratio
Active
$399,900
3
bds
|
0
ba
|
1,456
sqft
|
built
1984
4710 Jackson Rd, Montgomery, TX 77316
$-846
Cash flow
-11.0%
Cash-on-Cash Return
3.7%
Cap rate
0.5%
Rent to Value Ratio
Active
$999,000
5
bds
|
0
ba
|
4,069
sqft
|
built
2007
26122 Crown Ranch Blvd, Montgomery, TX 77316
$-2,206
Cash flow
-11.5%
Cash-on-Cash Return
3.6%
Cap rate
0.6%
Rent to Value Ratio

Active
$167,000
3
bds
|
0
ba
|
1,012
sqft
|
built
2019
16961 W Hammon, Montgomery, TX 77316
$-162
Cash flow
-5.1%
Cash-on-Cash Return
5.1%
Cap rate
0.8%
Rent to Value Ratio

Active
$285,900
3
bds
|
0
ba
|
2,035
sqft
|
built
2003
225 Mesa Vw, Montgomery, TX 77316
$-559
Cash flow
-10.2%
Cash-on-Cash Return
3.9%
Cap rate
0.7%
Rent to Value Ratio
Active
$1,100,000
4
bds
|
0
ba
|
3,938
sqft
|
built
2004
11420 Grand Pine Dr, Montgomery, TX 77356
$-2,387
Cash flow
-11.3%
Cash-on-Cash Return
3.7%
Cap rate
0.6%
Rent to Value Ratio

Active
$490,375
3
bds
|
0
ba
|
3,219
sqft
|
built
1997
110 Wick Willow Dr, Montgomery, TX 77356
$-1,255
Cash flow
-13.4%
Cash-on-Cash Return
3.2%
Cap rate
0.6%
Rent to Value Ratio
Active
$1,599,000
4
bds
|
0
ba
|
5,074
sqft
|
built
2016
12838 Lake Shore Dr, Montgomery, TX 77356
$-5,152
Cash flow
-16.8%
Cash-on-Cash Return
2.4%
Cap rate
0.5%
Rent to Value Ratio
Active
$455,000
4
bds
|
0
ba
|
2,953
sqft
|
built
2019
226 Aster View Ct, Montgomery, TX 77316
$-1,200
Cash flow
-13.8%
Cash-on-Cash Return
3.1%
Cap rate
0.7%
Rent to Value Ratio

Active
$260,000
3
bds
|
0
ba
|
1,562
sqft
|
built
2018
159 Brocks Ln, Montgomery, TX 77356
$-489
Cash flow
-9.8%
Cash-on-Cash Return
4.0%
Cap rate
0.8%
Rent to Value Ratio

Active
$599,990
4
bds
|
0
ba
|
2,425
sqft
|
built
2022
286 Sky Top Dr, Montgomery, TX 77316
$-1,653
Cash flow
-14.4%
Cash-on-Cash Return
3.0%
Cap rate
0.6%
Rent to Value Ratio