Montgomery, TX Investment Properties for Sale
Browse homes for sale and investment properties in Montgomery, TX. Refine your search by price, property type, or more.
Best cash flowing properties in Montgomery, TX

Active
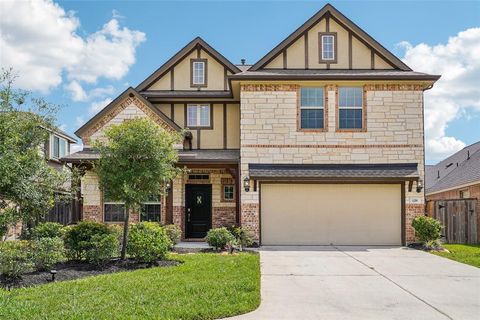
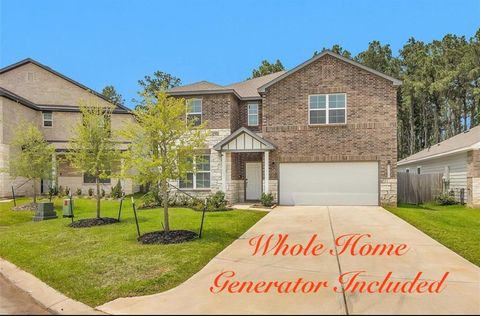
$250,000
4
bds
|
0
ba
|
1,876
sqft
|
built
2019
418 Terra Vista Cir, Montgomery, TX 77356
$-278
Cash flow
-5.8%
Cash-on-Cash Return
4.9%
Cap rate
0.8%
Rent to Value Ratio

Active
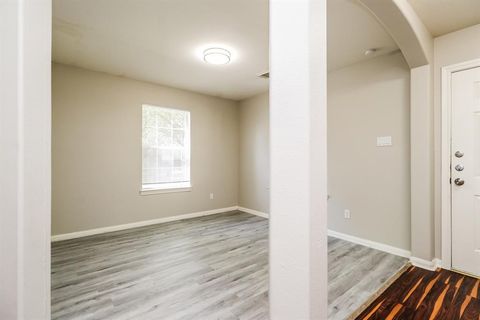
$115,000
1
bds
|
0
ba
|
489
sqft
|
built
1979
13151 Walden Rd, Montgomery, TX 77356
$-380
Cash flow
-17.2%
Cash-on-Cash Return
2.3%
Cap rate
0.9%
Rent to Value Ratio
589 out of 734 properties for sale in Montgomery, TX
Limited Results Shown
Create a free account, or log in to reveal all property listings and enjoy the complete experience.
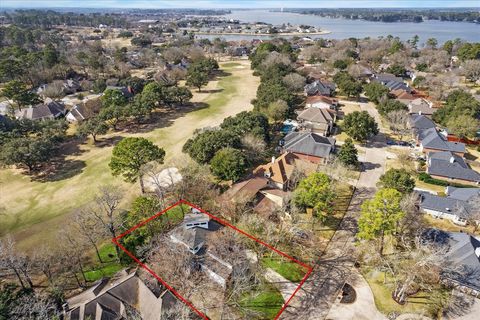
Active
$870,000
4
bds
|
0
ba
|
2,635
sqft
|
built
1980
3315 Vineyard Ln, Montgomery, TX 77356
$-1,968
Cash flow
-11.8%
Cash-on-Cash Return
3.6%
Cap rate
0.5%
Rent to Value Ratio
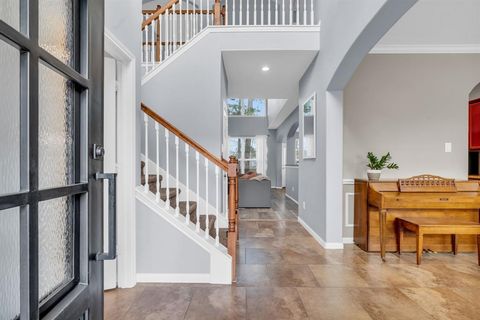
Active
$639,900
4
bds
|
0
ba
|
3,416
sqft
|
built
2015
114 Pacific Grove Dr, Montgomery, TX 77316
$-1,802
Cash flow
-14.7%
Cash-on-Cash Return
2.9%
Cap rate
0.6%
Rent to Value Ratio

Active
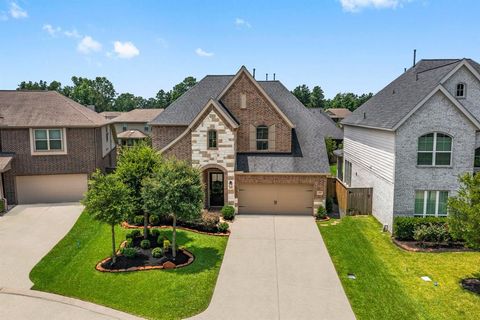
$435,000
4
bds
|
0
ba
|
2,402
sqft
|
built
2019
254 Aster View Ct, Montgomery, TX 77316
$-1,109
Cash flow
-13.3%
Cash-on-Cash Return
3.2%
Cap rate
0.7%
Rent to Value Ratio
Active
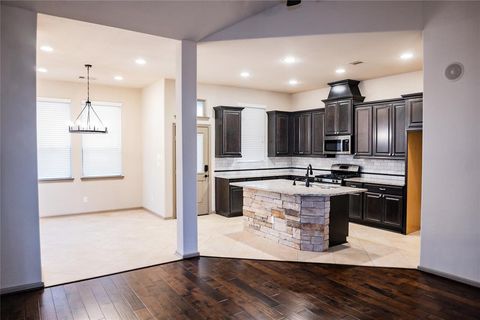
$700,000
4
bds
|
0
ba
|
2,713
sqft
|
built
2020
20142 Bushwick Falls Dr, Montgomery, TX 77316
$-2,770
Cash flow
-20.6%
Cash-on-Cash Return
1.5%
Cap rate
0.4%
Rent to Value Ratio
Active
$1,795,000
4
bds
|
0
ba
|
4,928
sqft
|
built
2018
7010 Bowie Ct, Montgomery, TX 77316
$-5,374
Cash flow
-15.6%
Cash-on-Cash Return
2.7%
Cap rate
0.5%
Rent to Value Ratio
Active
$250,000
4
bds
|
0
ba
|
1,876
sqft
|
built
2019
418 Terra Vista Cir, Montgomery, TX 77356
$-278
Cash flow
-5.8%
Cash-on-Cash Return
4.9%
Cap rate
0.8%
Rent to Value Ratio
Active
$539,700
4
bds
|
0
ba
|
2,849
sqft
|
built
2018
129 S Bearkat Ct, Montgomery, TX 77316
$-1,778
Cash flow
-17.2%
Cash-on-Cash Return
2.3%
Cap rate
0.5%
Rent to Value Ratio
Active
$282,000
3
bds
|
0
ba
|
2,084
sqft
|
built
2004
3502 Tudor Cir, Montgomery, TX 77356
$-541
Cash flow
-10.0%
Cash-on-Cash Return
4.0%
Cap rate
0.8%
Rent to Value Ratio
Active
$595,000
5
bds
|
0
ba
|
3,022
sqft
|
built
2019
138 S Carson Cub Ct, Montgomery, TX 77316
$-1,665
Cash flow
-14.6%
Cash-on-Cash Return
2.9%
Cap rate
0.6%
Rent to Value Ratio

Active
$315,000
4
bds
|
0
ba
|
2,239
sqft
|
built
2020
1286 Sandstone Hills Dr, Montgomery, TX 77316
$-801
Cash flow
-13.3%
Cash-on-Cash Return
3.2%
Cap rate
0.8%
Rent to Value Ratio

Active
$495,000
4
bds
|
0
ba
|
3,817
sqft
|
built
2020
1319 Pleasant Springs Ct, Montgomery, TX 77316
$-1,593
Cash flow
-16.8%
Cash-on-Cash Return
2.4%
Cap rate
0.6%
Rent to Value Ratio
Active
$339,995
3
bds
|
0
ba
|
2,098
sqft
|
built
2015
211 Cheswood Forest Ct, Montgomery, TX 77316
$-788
Cash flow
-12.1%
Cash-on-Cash Return
3.5%
Cap rate
0.7%
Rent to Value Ratio

Active
$450,000
4
bds
|
0
ba
|
2,332
sqft
|
built
2019
126 Capriccio Ln, Montgomery, TX 77316
$-726
Cash flow
-8.4%
Cash-on-Cash Return
4.3%
Cap rate
0.8%
Rent to Value Ratio

Active
$559,900
3
bds
|
0
ba
|
2,967
sqft
|
built
1996
117 Lake View Cir, Montgomery, TX 77356
$-1,252
Cash flow
-11.7%
Cash-on-Cash Return
3.6%
Cap rate
0.6%
Rent to Value Ratio

Active
$768,000
5
bds
|
0
ba
|
2,914
sqft
|
built
2016
10911 Maddys Ct, Montgomery, TX 77316
$-2,135
Cash flow
-14.5%
Cash-on-Cash Return
2.9%
Cap rate
0.5%
Rent to Value Ratio
Active
$115,000
1
bds
|
0
ba
|
489
sqft
|
built
1979
13151 Walden Rd, Montgomery, TX 77356
$-380
Cash flow
-17.2%
Cash-on-Cash Return
2.3%
Cap rate
0.9%
Rent to Value Ratio
Active
$299,900
4
bds
|
0
ba
|
2,472
sqft
|
built
2023
25720 Sweetpea Ct, Montgomery, TX 77316
$-750
Cash flow
-13.0%
Cash-on-Cash Return
3.3%
Cap rate
0.8%
Rent to Value Ratio
Active
$381,500
3
bds
|
0
ba
|
2,554
sqft
|
built
1980
146 Dawns Edge Dr, Montgomery, TX 77356
$-782
Cash flow
-10.7%
Cash-on-Cash Return
3.8%
Cap rate
0.7%
Rent to Value Ratio
Active
$395,000
4
bds
|
0
ba
|
2,498
sqft
|
built
2012
3706 Lovers Ln, Montgomery, TX 77356
$-902
Cash flow
-11.9%
Cash-on-Cash Return
3.5%
Cap rate
0.7%
Rent to Value Ratio

Active
$710,000
4
bds
|
0
ba
|
4,087
sqft
|
built
2016
11 Waterstone Ct, Montgomery, TX 77356
$-1,865
Cash flow
-13.7%
Cash-on-Cash Return
3.1%
Cap rate
0.6%
Rent to Value Ratio

Active
$649,900
3
bds
|
0
ba
|
3,097
sqft
|
built
2008
253 Capetown, Montgomery, TX 77356
$-1,539
Cash flow
-12.4%
Cash-on-Cash Return
3.4%
Cap rate
0.7%
Rent to Value Ratio
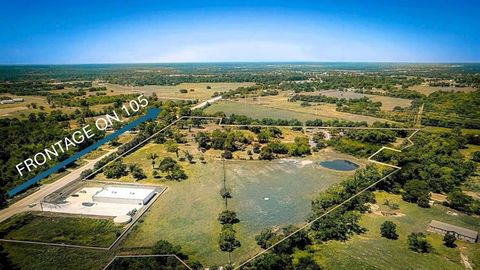
Active
$3,000,000
bds
|
0
ba
|
1,400
sqft
|
built
1982
26298 Highway 105 W, Montgomery, TX 77356
$-14,282
Cash flow
-24.8%
Cash-on-Cash Return
0.6%
Cap rate
0.1%
Rent to Value Ratio
Active
$358,000
3
bds
|
0
ba
|
1,844
sqft
|
built
2020
3307 Woodchuck Rd, Montgomery, TX 77356
$-854
Cash flow
-12.4%
Cash-on-Cash Return
3.4%
Cap rate
0.6%
Rent to Value Ratio
Active
$665,000
4
bds
|
0
ba
|
3,295
sqft
|
built
2004
18882 Mystic Pt, Montgomery, TX 77356
$-1,509
Cash flow
-11.8%
Cash-on-Cash Return
3.5%
Cap rate
0.6%
Rent to Value Ratio
Active
$1,475,900
2
bds
|
0
ba
|
4,180
sqft
|
built
2019
12162 Wyatt Rd, Montgomery, TX 77356
$-5,624
Cash flow
-19.9%
Cash-on-Cash Return
1.7%
Cap rate
0.3%
Rent to Value Ratio
Active
$359,000
3
bds
|
0
ba
|
2,193
sqft
|
built
2002
3407 Fitzgerald Dr, Montgomery, TX 77356
$-738
Cash flow
-10.7%
Cash-on-Cash Return
3.8%
Cap rate
0.6%
Rent to Value Ratio

Active
$1,735,000
5
bds
|
0
ba
|
5,296
sqft
|
built
2007
18852 Harbor Side Blvd, Montgomery, TX 77356
$-5,878
Cash flow
-17.7%
Cash-on-Cash Return
2.2%
Cap rate
0.5%
Rent to Value Ratio
Active
$399,900
3
bds
|
0
ba
|
1,552
sqft
|
built
1993
215 Clear Water St E, Montgomery, TX 77356
$-950
Cash flow
-12.4%
Cash-on-Cash Return
3.4%
Cap rate
0.6%
Rent to Value Ratio
Active
$305,000
2
bds
|
0
ba
|
1,599
sqft
|
built
2004
3715 O Henry Dr, Montgomery, TX 77356
$-727
Cash flow
-12.4%
Cash-on-Cash Return
3.4%
Cap rate
0.7%
Rent to Value Ratio

Active
$315,000
4
bds
|
0
ba
|
1,966
sqft
|
built
2004
3729 Breckenridge Dr, Montgomery, TX 77356
$-979
Cash flow
-16.2%
Cash-on-Cash Return
2.5%
Cap rate
0.6%
Rent to Value Ratio
Active
$339,900
3
bds
|
0
ba
|
2,403
sqft
|
built
1985
152 Snug Harbor Dr, Montgomery, TX 77356
$-635
Cash flow
-9.7%
Cash-on-Cash Return
4.0%
Cap rate
0.7%
Rent to Value Ratio

Active
$392,000
3
bds
|
0
ba
|
2,594
sqft
|
built
2004
600 Crystal River Rd, Montgomery, TX 77316
$-717
Cash flow
-9.5%
Cash-on-Cash Return
4.1%
Cap rate
0.7%
Rent to Value Ratio

Active
$399,500
4
bds
|
0
ba
|
2,694
sqft
|
built
2018
118 Emory Birch Dr, Montgomery, TX 77316
$-996
Cash flow
-13.0%
Cash-on-Cash Return
3.3%
Cap rate
0.7%
Rent to Value Ratio

Active
$1,050,000
4
bds
|
0
ba
|
4,100
sqft
|
built
2020
203 S Empress Green Pl, Montgomery, TX 77316
$-2,699
Cash flow
-13.4%
Cash-on-Cash Return
3.2%
Cap rate
0.7%
Rent to Value Ratio

Active
$387,500
3
bds
|
0
ba
|
2,354
sqft
|
built
1995
3030 Hemingway Dr, Montgomery, TX 77356
$-1,069
Cash flow
-14.4%
Cash-on-Cash Return
3.0%
Cap rate
0.6%
Rent to Value Ratio

Active
$2,950,000
5
bds
|
0
ba
|
5,151
sqft
|
built
1995
17553 Fm 149 Rd, Montgomery, TX 77356
$-11,726
Cash flow
-20.7%
Cash-on-Cash Return
1.5%
Cap rate
0.2%
Rent to Value Ratio

Active
$335,000
3
bds
|
0
ba
|
2,062
sqft
|
built
2020
1216 Sandstone Hills Dr, Montgomery, TX 77316
$-894
Cash flow
-13.9%
Cash-on-Cash Return
3.1%
Cap rate
0.7%
Rent to Value Ratio
Active
$750,000
4
bds
|
0
ba
|
3,241
sqft
|
built
2021
308 Lane Landing Pl, Montgomery, TX 77316
$-1,886
Cash flow
-13.1%
Cash-on-Cash Return
3.2%
Cap rate
0.6%
Rent to Value Ratio
Active
$272,000
3
bds
|
0
ba
|
1,769
sqft
|
built
2020
411 Terra Vista Cir, Montgomery, TX 77356
$-515
Cash flow
-9.9%
Cash-on-Cash Return
4.0%
Cap rate
0.7%
Rent to Value Ratio

Active
$875,000
5
bds
|
0
ba
|
3,761
sqft
|
built
2020
271 Bronze View Dr, Montgomery, TX 77316
$-2,855
Cash flow
-17.0%
Cash-on-Cash Return
2.3%
Cap rate
0.5%
Rent to Value Ratio