Montgomery, TX Investment Properties for Sale
Browse homes for sale and investment properties in Montgomery, TX. Refine your search by price, property type, or more.
Best cash flowing properties in Montgomery, TX
Active
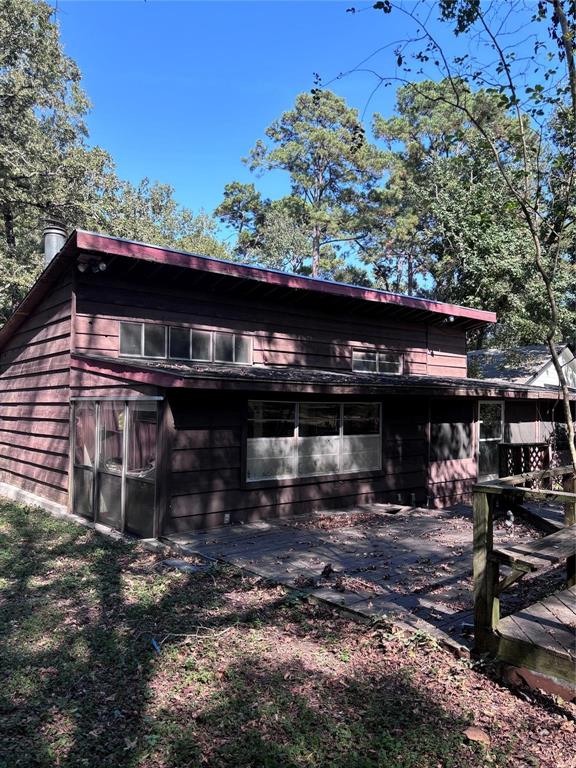
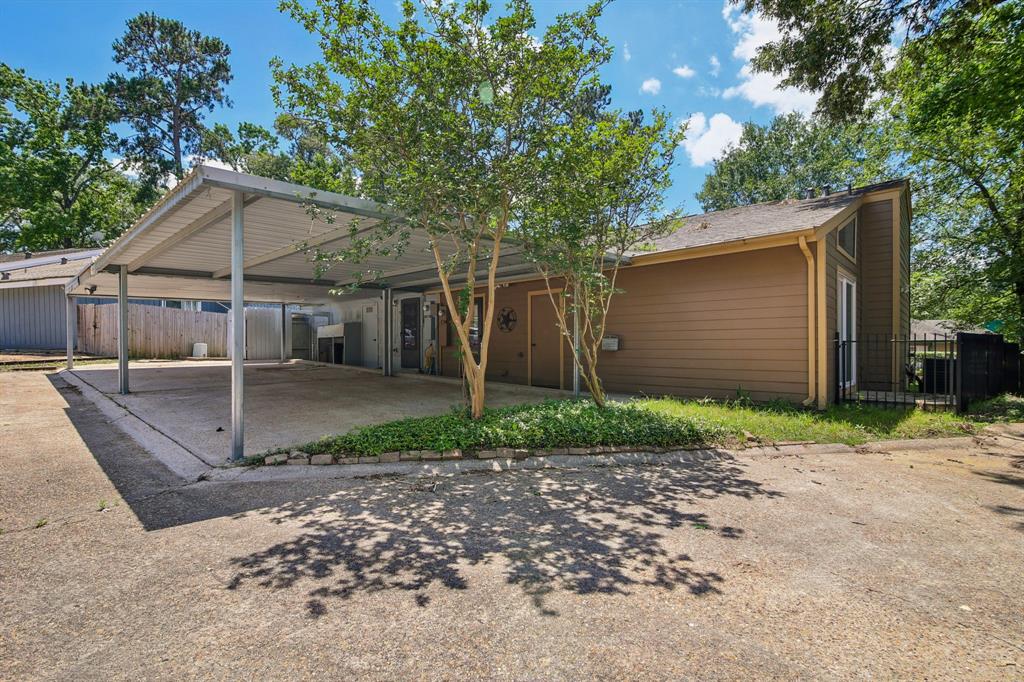
$170,000
1
bds
|
0
ba
|
1,071
sqft
|
built
1968
16477 Piper Ln, Montgomery, TX 77316
$-299
Cash flow
-9.2%
Cash-on-Cash Return
3.6%
Cap rate
0.6%
Rent to Value Ratio
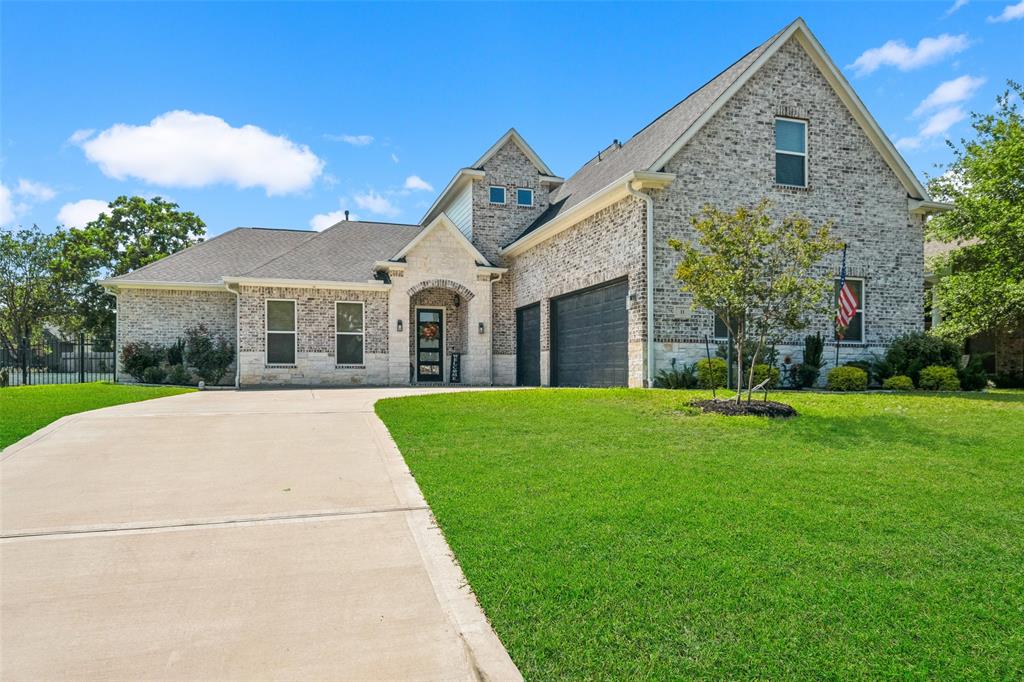
Active
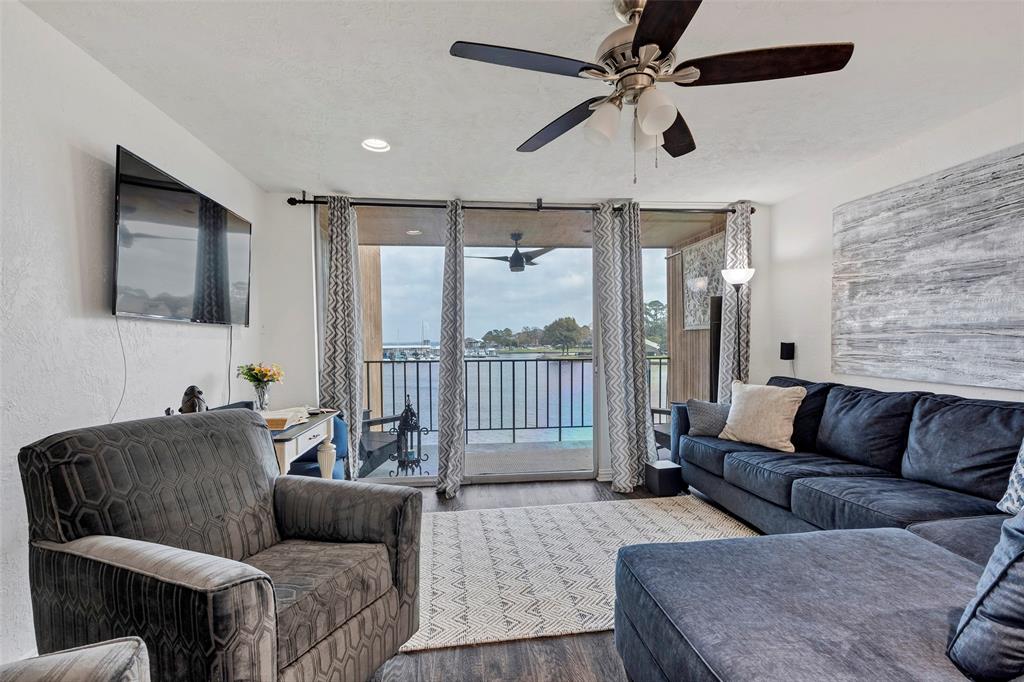
$167,500
1
bds
|
0
ba
|
584
sqft
|
built
1974
12600 Melville Dr, Montgomery, TX 77356
$-322
Cash flow
-10.0%
Cash-on-Cash Return
3.4%
Cap rate
0.8%
Rent to Value Ratio
616 out of 691 properties for sale in Montgomery, TX
Limited Results Shown
Create a free account, or log in to reveal all property listings and enjoy the complete experience.
Active
$167,500
1
bds
|
0
ba
|
584
sqft
|
built
1974
12600 Melville Dr, Montgomery, TX 77356
$-322
Cash flow
-10.0%
Cash-on-Cash Return
3.4%
Cap rate
0.8%
Rent to Value Ratio
Active
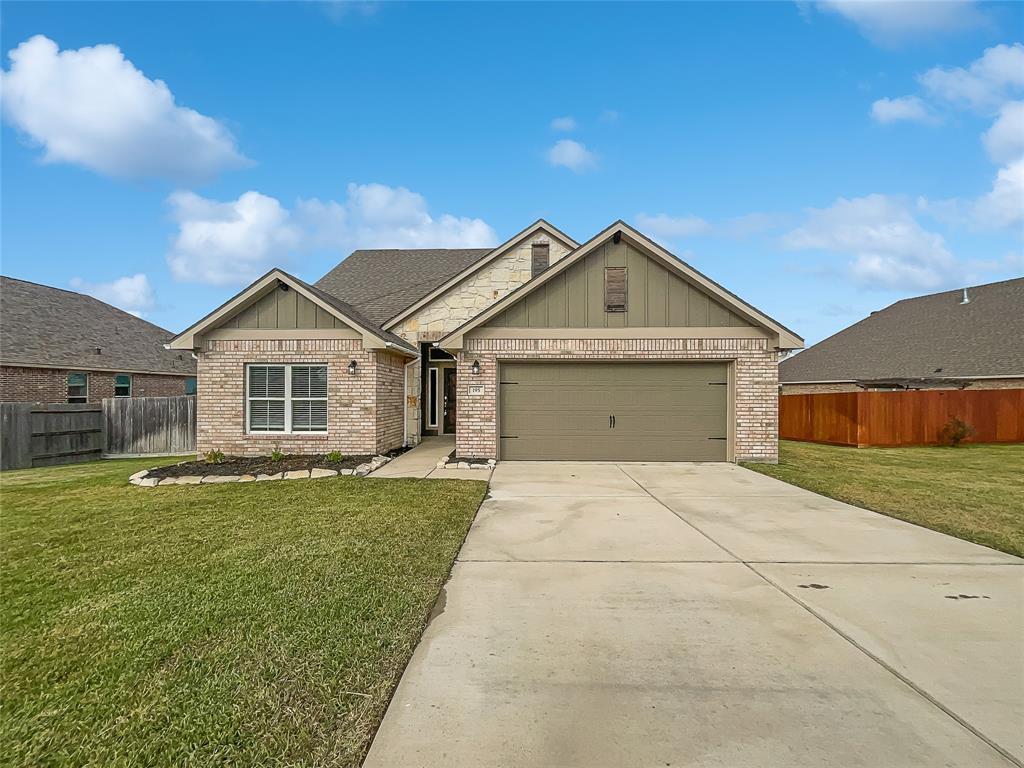
$339,000
3
bds
|
0
ba
|
2,535
sqft
|
built
2020
195 Abner Ln, Montgomery, TX 77356
$-647
Cash flow
-10.0%
Cash-on-Cash Return
3.4%
Cap rate
0.7%
Rent to Value Ratio
Pending
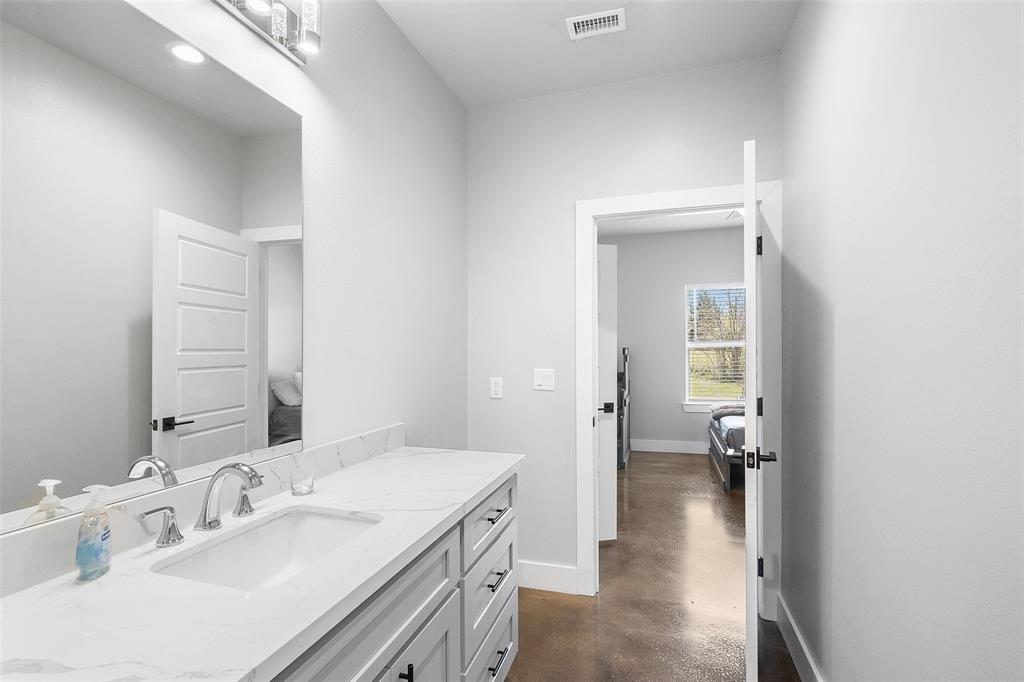
$650,000
3
bds
|
0
ba
|
1,896
sqft
|
built
2022
23495 Henson Rd, Montgomery, TX 77356
$-2,434
Cash flow
-19.5%
Cash-on-Cash Return
1.2%
Cap rate
0.2%
Rent to Value Ratio

Active
$399,900
2
bds
|
0
ba
|
1,620
sqft
|
built
1978
3923 Lakewood Dr, Montgomery, TX 77356
$-1,097
Cash flow
-14.3%
Cash-on-Cash Return
2.4%
Cap rate
0.6%
Rent to Value Ratio
Active
$325,000
2
bds
|
0
ba
|
1,461
sqft
|
built
2008
17040 W Fm 1097 Rd, Montgomery, TX 77356
$-885
Cash flow
-14.2%
Cash-on-Cash Return
2.4%
Cap rate
0.7%
Rent to Value Ratio
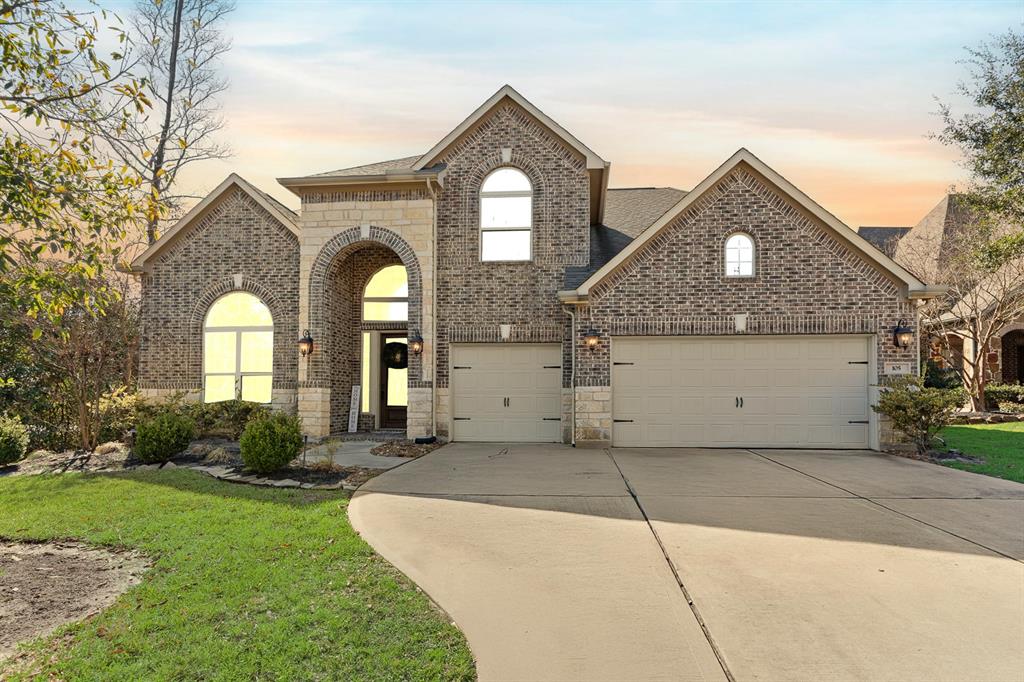
Active
$949,990
5
bds
|
0
ba
|
4,215
sqft
|
built
2016
105 Blanton Bend Dr, Montgomery, TX 77316
$-2,977
Cash flow
-16.3%
Cash-on-Cash Return
1.9%
Cap rate
0.5%
Rent to Value Ratio

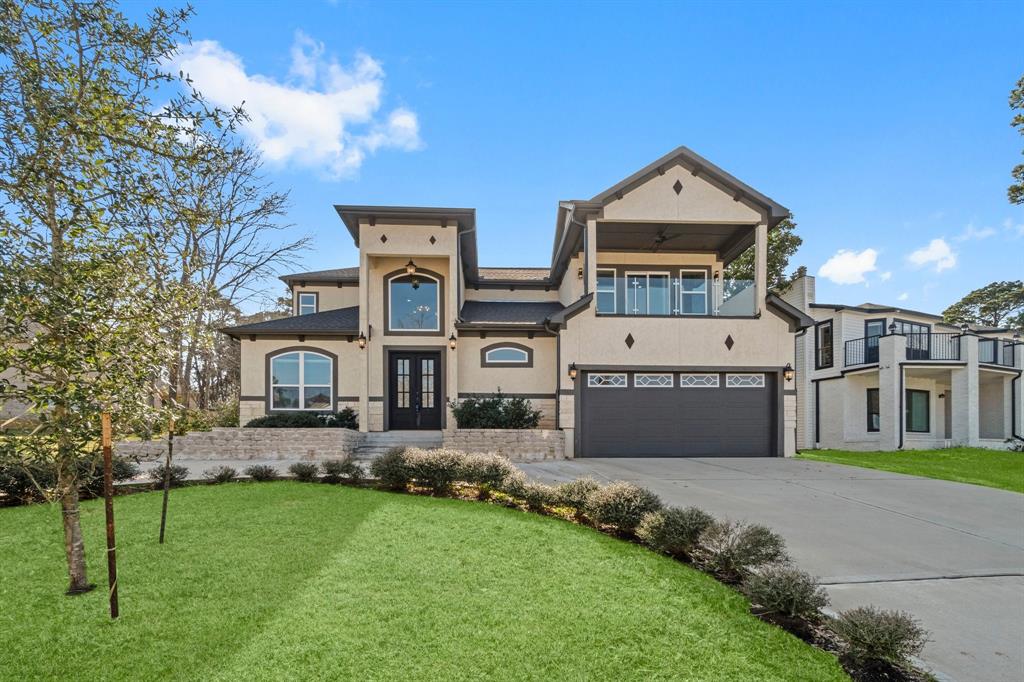
Active
$449,000
4
bds
|
0
ba
|
2,836
sqft
|
built
2014
13607 Summer Hill Dr, Montgomery, TX 77356
$-899
Cash flow
-10.4%
Cash-on-Cash Return
3.3%
Cap rate
0.6%
Rent to Value Ratio
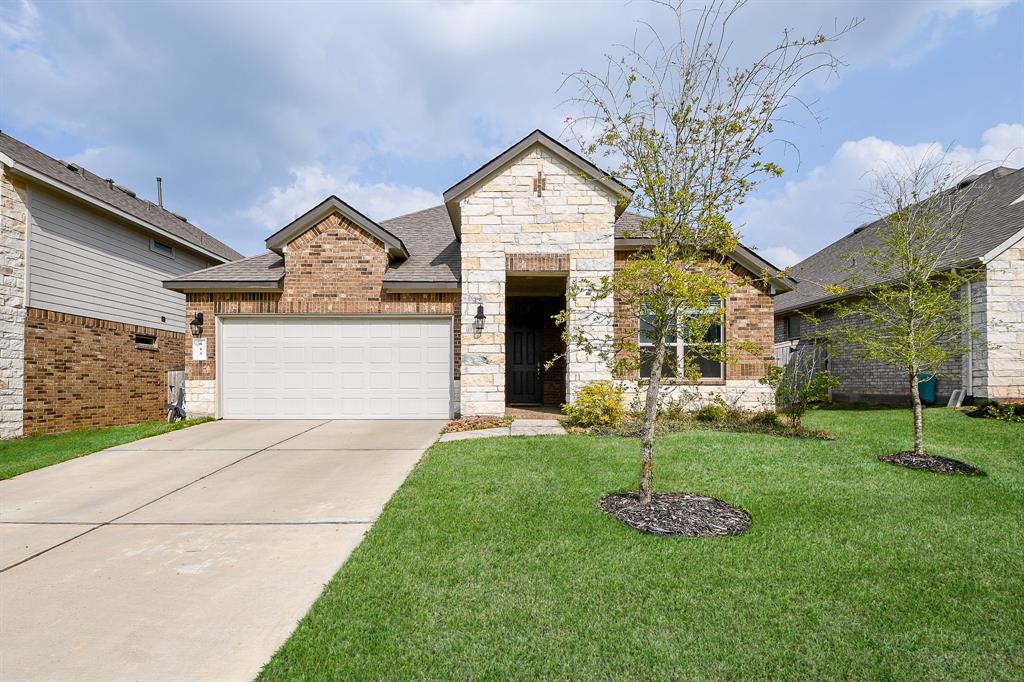
Active
$305,000
3
bds
|
0
ba
|
1,602
sqft
|
built
2022
915 Youth Water Rd, Montgomery, TX 77316
$-586
Cash flow
-10.0%
Cash-on-Cash Return
3.4%
Cap rate
0.8%
Rent to Value Ratio
Active
$549,000
3
bds
|
0
ba
|
2,993
sqft
|
built
2021
13441 Northshore Dr, Montgomery, TX 77356
$-1,225
Cash flow
-11.6%
Cash-on-Cash Return
3.0%
Cap rate
0.6%
Rent to Value Ratio
Active
$875,000
4
bds
|
0
ba
|
4,008
sqft
|
built
2015
145 Grandview Blvd, Montgomery, TX 77356
$-2,067
Cash flow
-12.3%
Cash-on-Cash Return
2.8%
Cap rate
0.5%
Rent to Value Ratio
Active
$299,900
3
bds
|
0
ba
|
2,120
sqft
|
built
2015
150 Cheswood Forest Dr, Montgomery, TX 77316
$-479
Cash flow
-8.3%
Cash-on-Cash Return
3.8%
Cap rate
0.8%
Rent to Value Ratio
Active
$1,669,880
5
bds
|
0
ba
|
3,912
sqft
|
built
1999
18752 Palm Beach Blvd, Montgomery, TX 77356
$-4,734
Cash flow
-14.8%
Cash-on-Cash Return
2.3%
Cap rate
0.4%
Rent to Value Ratio
Active
$850,000
3
bds
|
0
ba
|
2,749
sqft
|
built
2002
11503 Kingford Ct, Montgomery, TX 77316
$-2,042
Cash flow
-12.5%
Cash-on-Cash Return
2.8%
Cap rate
0.5%
Rent to Value Ratio
Pending
$349,000
3
bds
|
0
ba
|
2,359
sqft
|
built
2002
3307 Hemingway Dr, Montgomery, TX 77356
$-513
Cash flow
-7.7%
Cash-on-Cash Return
3.9%
Cap rate
0.7%
Rent to Value Ratio
Active
$329,900
3
bds
|
0
ba
|
2,513
sqft
|
built
1993
172 April Cv, Montgomery, TX 77356
$-460
Cash flow
-7.3%
Cash-on-Cash Return
4.0%
Cap rate
0.8%
Rent to Value Ratio
Active
$850,000
3
bds
|
0
ba
|
2,751
sqft
|
built
2007
185 Capetown, Montgomery, TX 77356
$-2,406
Cash flow
-14.8%
Cash-on-Cash Return
2.3%
Cap rate
0.6%
Rent to Value Ratio
Active
$395,000
4
bds
|
0
ba
|
2,207
sqft
|
built
2016
182 Climbing Oaks Pl, Montgomery, TX 77316
$-729
Cash flow
-9.6%
Cash-on-Cash Return
3.5%
Cap rate
0.6%
Rent to Value Ratio
Active
$274,700
2
bds
|
0
ba
|
1,218
sqft
|
built
1978
32 April Vlg, Montgomery, TX 77356
$-555
Cash flow
-10.5%
Cash-on-Cash Return
3.3%
Cap rate
0.6%
Rent to Value Ratio

Active
$1,250,000
4
bds
|
0
ba
|
5,217
sqft
|
built
2004
24480 W Fm 1097 Rd, Montgomery, TX 77356
$-3,540
Cash flow
-14.8%
Cash-on-Cash Return
2.3%
Cap rate
0.3%
Rent to Value Ratio
Active
$688,000
4
bds
|
0
ba
|
3,935
sqft
|
built
2021
11 Waterford Way, Montgomery, TX 77356
$-1,100
Cash flow
-8.3%
Cash-on-Cash Return
3.8%
Cap rate
0.7%
Rent to Value Ratio
Active
$540,000
3
bds
|
0
ba
|
2,380
sqft
|
built
2000
19959 Peel Rd, Montgomery, TX 77356
$-855
Cash flow
-8.3%
Cash-on-Cash Return
3.8%
Cap rate
0.6%
Rent to Value Ratio
Pending
$333,900
3
bds
|
0
ba
|
2,298
sqft
|
built
2000
3002 Pine Chase Dr, Montgomery, TX 77356
$-454
Cash flow
-7.1%
Cash-on-Cash Return
4.0%
Cap rate
0.7%
Rent to Value Ratio

Active
$581,000
3
bds
|
0
ba
|
2,732
sqft
|
built
2004
131 Wick Willow Dr, Montgomery, TX 77356
$-1,438
Cash flow
-12.9%
Cash-on-Cash Return
2.7%
Cap rate
0.5%
Rent to Value Ratio

Active
$315,000
2
bds
|
0
ba
|
896
sqft
|
built
1996
12800 Melville Dr, Montgomery, TX 77356
$-1,076
Cash flow
-17.8%
Cash-on-Cash Return
1.6%
Cap rate
0.6%
Rent to Value Ratio

Active
$745,000
3
bds
|
0
ba
|
1,947
sqft
|
built
2017
199 Waterpoint Ct, Montgomery, TX 77356
$-2,672
Cash flow
-18.7%
Cash-on-Cash Return
1.4%
Cap rate
0.5%
Rent to Value Ratio

Active
$565,000
2
bds
|
0
ba
|
1,988
sqft
|
built
1979
30 Regency Pt, Montgomery, TX 77356
$-2,195
Cash flow
-20.3%
Cash-on-Cash Return
1.0%
Cap rate
0.4%
Rent to Value Ratio

Active
$450,000
4
bds
|
0
ba
|
2,764
sqft
|
built
1979
246 Springs Edge Dr, Montgomery, TX 77356
$-654
Cash flow
-7.6%
Cash-on-Cash Return
3.9%
Cap rate
0.7%
Rent to Value Ratio
Active
$435,000
4
bds
|
0
ba
|
2,445
sqft
|
built
2010
119 Winslow Hill Pl, Montgomery, TX 77316
$-1,065
Cash flow
-12.8%
Cash-on-Cash Return
2.7%
Cap rate
0.6%
Rent to Value Ratio
Active
$420,000
3
bds
|
0
ba
|
2,244
sqft
|
built
1995
82 Edgewood Dr, Montgomery, TX 77356
$-696
Cash flow
-8.6%
Cash-on-Cash Return
3.7%
Cap rate
0.7%
Rent to Value Ratio

Active
$1,599,990
6
bds
|
0
ba
|
6,231
sqft
|
built
2019
11537 Renaissance Dr, Montgomery, TX 77356
$-4,069
Cash flow
-13.3%
Cash-on-Cash Return
2.6%
Cap rate
0.5%
Rent to Value Ratio
Active
$490,000
4
bds
|
0
ba
|
2,774
sqft
|
built
2021
350 Mistletoe Ridge Ct, Montgomery, TX 77316
$-962
Cash flow
-10.2%
Cash-on-Cash Return
3.3%
Cap rate
0.7%
Rent to Value Ratio

Active
$935,000
3
bds
|
0
ba
|
4,014
sqft
|
built
2004
44 Waterberry Way, Montgomery, TX 77356
$-2,777
Cash flow
-15.5%
Cash-on-Cash Return
2.1%
Cap rate
0.4%
Rent to Value Ratio
Active
$315,000
5
bds
|
0
ba
|
2,610
sqft
|
built
2002
3706 Breckenridge Dr, Montgomery, TX 77356
$-425
Cash flow
-7.0%
Cash-on-Cash Return
4.1%
Cap rate
0.8%
Rent to Value Ratio
Active
$689,000
5
bds
|
0
ba
|
3,793
sqft
|
built
2015
201 River Wilde Dr, Montgomery, TX 77316
$-1,725
Cash flow
-13.1%
Cash-on-Cash Return
2.7%
Cap rate
0.6%
Rent to Value Ratio

Active
$432,000
3
bds
|
0
ba
|
2,250
sqft
|
built
2005
181 Wyndemere Dr, Montgomery, TX 77356
$-629
Cash flow
-7.6%
Cash-on-Cash Return
3.9%
Cap rate
0.6%
Rent to Value Ratio
Active
$385,000
4
bds
|
0
ba
|
2,551
sqft
|
built
2017
434 Carriage Trl, Montgomery, TX 77316
$-425
Cash flow
-5.8%
Cash-on-Cash Return
4.4%
Cap rate
0.8%
Rent to Value Ratio
Active
$1,600,000
4
bds
|
0
ba
|
2,792
sqft
|
built
2015
137 Port Au Prince Ct, Montgomery, TX 77316
$-5,179
Cash flow
-16.9%
Cash-on-Cash Return
1.8%
Cap rate
0.3%
Rent to Value Ratio

Active
$359,000
3
bds
|
0
ba
|
2,525
sqft
|
built
2016
13318 Hilton Head Dr, Montgomery, TX 77356
$-343
Cash flow
-5.0%
Cash-on-Cash Return
4.5%
Cap rate
0.9%
Rent to Value Ratio
Active
$550,000
4
bds
|
0
ba
|
3,865
sqft
|
built
1993
38 Cloverdale Ct, Montgomery, TX 77356
$-1,045
Cash flow
-9.9%
Cash-on-Cash Return
3.4%
Cap rate
0.7%
Rent to Value Ratio
Active
$170,000
1
bds
|
0
ba
|
1,071
sqft
|
built
1968
16477 Piper Ln, Montgomery, TX 77316
$-299
Cash flow
-9.2%
Cash-on-Cash Return
3.6%
Cap rate
0.6%
Rent to Value Ratio