Montgomery, TX Investment Properties for Sale
Browse homes for sale and investment properties in Montgomery, TX. Refine your search by price, property type, or more.
Best cash flowing properties in Montgomery, TX

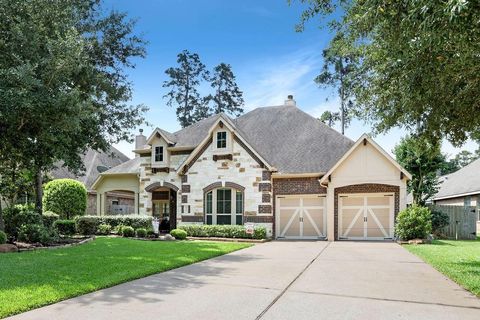
Active
$254,900
3
bds
|
0
ba
|
1,368
sqft
|
built
2022
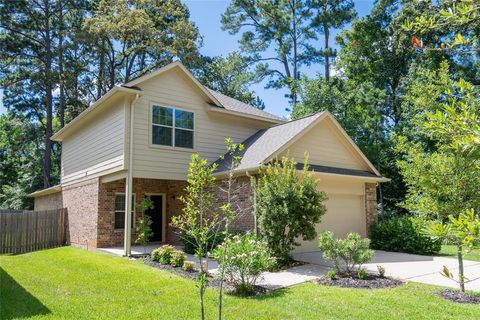
25388 Leather Leaf Ct, Montgomery, TX 77316
$-269
Cash flow
-5.5%
Cash-on-Cash Return
5.0%
Cap rate
0.8%
Rent to Value Ratio

Active
$178,888
2
bds
|
0
ba
|
1,284
sqft
|
built
1975
1607 E Pine Lake Cir, Montgomery, TX 77316
$-292
Cash flow
-8.5%
Cash-on-Cash Return
4.3%
Cap rate
0.8%
Rent to Value Ratio
489 out of 583 properties for sale in Montgomery, TX
Limited Results Shown
Create a free account, or log in to reveal all property listings and enjoy the complete experience.

Active
$325,000
4
bds
|
0
ba
|
1,880
sqft
|
built
2022
1672 Happy Valley St, Montgomery, TX 77316
$-799
Cash flow
-12.8%
Cash-on-Cash Return
3.3%
Cap rate
0.8%
Rent to Value Ratio
Active
$1,025,000
3
bds
|
0
ba
|
3,235
sqft
|
built
1996
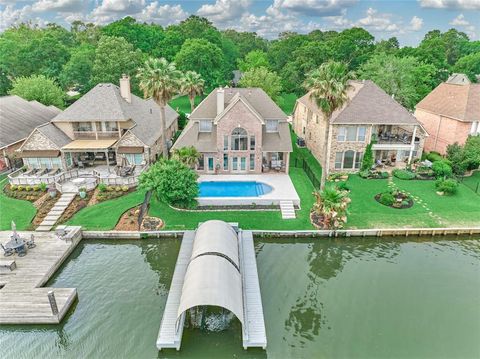
2025 S Shore Blvd, Montgomery, TX 77356
$-3,221
Cash flow
-16.4%
Cash-on-Cash Return
2.5%
Cap rate
0.5%
Rent to Value Ratio

Active
$599,000
3
bds
|
0
ba
|
1,519
sqft
|
built
2009
22981 Henson Rd, Montgomery, TX 77356
$-2,058
Cash flow
-17.9%
Cash-on-Cash Return
2.1%
Cap rate
0.4%
Rent to Value Ratio
Active
$178,888
2
bds
|
0
ba
|
1,284
sqft
|
built
1975
1607 E Pine Lake Cir, Montgomery, TX 77316
$-292
Cash flow
-8.5%
Cash-on-Cash Return
4.3%
Cap rate
0.8%
Rent to Value Ratio

Active
$1,130,000
5
bds
|
0
ba
|
4,836
sqft
|
built
2006
11427 Grand Pine Dr, Montgomery, TX 77356
$-2,790
Cash flow
-12.9%
Cash-on-Cash Return
3.3%
Cap rate
0.6%
Rent to Value Ratio

Active
$1,095,000
5
bds
|
0
ba
|
4,183
sqft
|
built
2006
11432 Grand Pine Dr, Montgomery, TX 77356
$-2,455
Cash flow
-11.7%
Cash-on-Cash Return
3.6%
Cap rate
0.6%
Rent to Value Ratio

Active
$1,174,900
5
bds
|
0
ba
|
5,226
sqft
|
built
2006
11673 Grandview Dr, Montgomery, TX 77356
$-4,379
Cash flow
-19.4%
Cash-on-Cash Return
1.8%
Cap rate
0.4%
Rent to Value Ratio

Active
$875,000
4
bds
|
0
ba
|
3,194
sqft
|
built
1998
22 Creekwood Dr, Montgomery, TX 77356
$-2,790
Cash flow
-16.6%
Cash-on-Cash Return
2.4%
Cap rate
0.5%
Rent to Value Ratio

Active
$849,000
3
bds
|
0
ba
|
2,516
sqft
|
built
2009
140 Port Au Prince Ct, Montgomery, TX 77316
$-2,834
Cash flow
-17.4%
Cash-on-Cash Return
2.3%
Cap rate
0.4%
Rent to Value Ratio

Active
$499,995
4
bds
|
0
ba
|
2,720
sqft
|
built
2019
236 Bentwood Dr, Montgomery, TX 77356
$-1,105
Cash flow
-11.5%
Cash-on-Cash Return
3.6%
Cap rate
0.7%
Rent to Value Ratio

Active
$699,900
4
bds
|
0
ba
|
3,408
sqft
|
built
2004
34 Eastwood Dr, Montgomery, TX 77356
$-1,861
Cash flow
-13.9%
Cash-on-Cash Return
3.1%
Cap rate
0.6%
Rent to Value Ratio

Active
$899,000
4
bds
|
0
ba
|
3,000
sqft
|
built
1985
12986 Wood Harbour Dr, Montgomery, TX 77356
$-2,619
Cash flow
-15.2%
Cash-on-Cash Return
2.8%
Cap rate
0.6%
Rent to Value Ratio

Active
$1,150,000
3
bds
|
0
ba
|
2,571
sqft
|
built
2002
25350 Taylor St, Montgomery, TX 77356
$-5,345
Cash flow
-24.2%
Cash-on-Cash Return
0.7%
Cap rate
0.2%
Rent to Value Ratio

Active
$950,000
4
bds
|
0
ba
|
3,566
sqft
|
built
2010
8483 Majestic Lake Ct, Montgomery, TX 77316
$-2,998
Cash flow
-16.5%
Cash-on-Cash Return
2.5%
Cap rate
0.5%
Rent to Value Ratio

Active
$685,000
3
bds
|
0
ba
|
2,485
sqft
|
built
2015
10910 Maddys Ct, Montgomery, TX 77316
$-2,156
Cash flow
-16.4%
Cash-on-Cash Return
2.5%
Cap rate
0.4%
Rent to Value Ratio

Active
$2,190,000
7
bds
|
0
ba
|
7,716
sqft
|
built
2008
11503 Renaissance Dr, Montgomery, TX 77356
$-8,742
Cash flow
-20.8%
Cash-on-Cash Return
1.5%
Cap rate
0.3%
Rent to Value Ratio

Active
$949,500
4
bds
|
0
ba
|
4,320
sqft
|
built
1996
118 Waterfront Dr, Montgomery, TX 77356
$-2,416
Cash flow
-13.3%
Cash-on-Cash Return
3.2%
Cap rate
0.6%
Rent to Value Ratio

Active
$744,500
4
bds
|
0
ba
|
3,006
sqft
|
built
2005
18989 Harbor Side Blvd, Montgomery, TX 77356
$-2,352
Cash flow
-16.5%
Cash-on-Cash Return
2.5%
Cap rate
0.5%
Rent to Value Ratio
Active
$275,000
3
bds
|
0
ba
|
1,454
sqft
|
built
2006
113 Cove Pl, Montgomery, TX 77356
$-752
Cash flow
-14.3%
Cash-on-Cash Return
3.0%
Cap rate
0.7%
Rent to Value Ratio
Active
$450,000
2
bds
|
0
ba
|
1,200
sqft
|
built
1991
7711 Boars Head Pl, Montgomery, TX 77316
$-1,496
Cash flow
-17.3%
Cash-on-Cash Return
2.3%
Cap rate
0.3%
Rent to Value Ratio

Active
$1,199,000
4
bds
|
0
ba
|
5,827
sqft
|
built
2010
134 Mia Lago Dr, Montgomery, TX 77356
$-3,276
Cash flow
-14.3%
Cash-on-Cash Return
3.0%
Cap rate
0.6%
Rent to Value Ratio
Active
$1,495,000
3
bds
|
0
ba
|
3,252
sqft
|
built
2015
146 La Vie Dr, Montgomery, TX 77316
$-3,698
Cash flow
-12.9%
Cash-on-Cash Return
3.3%
Cap rate
0.5%
Rent to Value Ratio
Active
$324,900
3
bds
|
0
ba
|
2,015
sqft
|
built
2015
3619 Spy Glass Hill Dr, Montgomery, TX 77356
$-877
Cash flow
-14.1%
Cash-on-Cash Return
3.0%
Cap rate
0.6%
Rent to Value Ratio
Active
$625,000
4
bds
|
0
ba
|
3,299
sqft
|
built
2015
11 Hillsborough Dr E, Montgomery, TX 77356
$-1,871
Cash flow
-15.6%
Cash-on-Cash Return
2.7%
Cap rate
0.5%
Rent to Value Ratio

Active
$929,000
3
bds
|
0
ba
|
3,224
sqft
|
built
1984
13302 Northshore Dr, Montgomery, TX 77356
$-2,761
Cash flow
-15.5%
Cash-on-Cash Return
2.7%
Cap rate
0.4%
Rent to Value Ratio

Active
$4,200,000
6
bds
|
0
ba
|
4,948
sqft
|
built
2006
2289 Old Dobbin Rd, Montgomery, TX 77316
$-16,682
Cash flow
-20.7%
Cash-on-Cash Return
1.5%
Cap rate
0.2%
Rent to Value Ratio
Active
$2,500,000
3
bds
|
0
ba
|
1,584
sqft
|
built
1992
23004 Landrum Village Dr, Montgomery, TX 77316
$-11,723
Cash flow
-24.5%
Cash-on-Cash Return
0.6%
Cap rate
0.1%
Rent to Value Ratio

Active
$756,000
4
bds
|
0
ba
|
2,625
sqft
|
built
2003
508 Nautica Ln, Montgomery, TX 77316
$-2,226
Cash flow
-15.4%
Cash-on-Cash Return
2.7%
Cap rate
0.5%
Rent to Value Ratio
Active
$550,000
4
bds
|
0
ba
|
2,197
sqft
|
built
2009
649 Old Plantersville Rd, Montgomery, TX 77316
$-1,477
Cash flow
-14.0%
Cash-on-Cash Return
3.0%
Cap rate
0.6%
Rent to Value Ratio

Active
$1,250,000
4
bds
|
0
ba
|
3,648
sqft
|
built
2013
16827 Falcon Sound Dr, Montgomery, TX 77356
$-2,665
Cash flow
-11.1%
Cash-on-Cash Return
3.7%
Cap rate
0.6%
Rent to Value Ratio

Active
$330,000
4
bds
|
0
ba
|
1,802
sqft
|
built
2012
3034 Pine Chase Dr, Montgomery, TX 77356
$-800
Cash flow
-12.6%
Cash-on-Cash Return
3.4%
Cap rate
0.7%
Rent to Value Ratio

Active
$449,000
4
bds
|
0
ba
|
3,454
sqft
|
built
2007
9926 Crescent Cove Dr, Montgomery, TX 77356
$-1,015
Cash flow
-11.8%
Cash-on-Cash Return
3.6%
Cap rate
0.7%
Rent to Value Ratio
Active
$479,500
3
bds
|
0
ba
|
2,629
sqft
|
built
2012
266 Overland Trce, Montgomery, TX 77316
$-1,221
Cash flow
-13.3%
Cash-on-Cash Return
3.2%
Cap rate
0.6%
Rent to Value Ratio

Active
$495,000
3
bds
|
0
ba
|
2,200
sqft
|
built
1997
32 Laguna Rd, Montgomery, TX 77356
$-1,217
Cash flow
-12.8%
Cash-on-Cash Return
3.3%
Cap rate
0.6%
Rent to Value Ratio
Active
$359,900
4
bds
|
0
ba
|
2,419
sqft
|
built
2001
3206 Meadowlark Ln, Montgomery, TX 77356
$-697
Cash flow
-10.1%
Cash-on-Cash Return
3.9%
Cap rate
0.7%
Rent to Value Ratio

Active
$265,000
3
bds
|
0
ba
|
1,707
sqft
|
built
2008
18720 Stewart Hill Dr, Montgomery, TX 77356
$-475
Cash flow
-9.4%
Cash-on-Cash Return
4.1%
Cap rate
0.7%
Rent to Value Ratio

Active
$299,995
4
bds
|
0
ba
|
2,004
sqft
|
built
2015
3807 Springcrest, Montgomery, TX 77356
$-765
Cash flow
-13.3%
Cash-on-Cash Return
3.2%
Cap rate
0.7%
Rent to Value Ratio
Active
$254,900
3
bds
|
0
ba
|
1,368
sqft
|
built
2022
25388 Leather Leaf Ct, Montgomery, TX 77316
$-269
Cash flow
-5.5%
Cash-on-Cash Return
5.0%
Cap rate
0.8%
Rent to Value Ratio
Active
$399,000
3
bds
|
0
ba
|
1,973
sqft
|
built
2006
107 Monterrey Rd, Montgomery, TX 77356
$-1,164
Cash flow
-15.2%
Cash-on-Cash Return
2.8%
Cap rate
0.6%
Rent to Value Ratio
Active
$260,000
3
bds
|
0
ba
|
1,638
sqft
|
built
2000
110 Rustling Wind Dr, Montgomery, TX 77356
$-560
Cash flow
-11.2%
Cash-on-Cash Return
3.7%
Cap rate
0.8%
Rent to Value Ratio