Montgomery, TX Investment Properties for Sale
Browse homes for sale and investment properties in Montgomery, TX. Refine your search by price, property type, or more.
Best cash flowing properties in Montgomery, TX

Active
$169,500
2
bds
|
0
ba
|
768
sqft
|
built
1972
9847 N Lake Vw, Montgomery, TX 77316
$-73
Cash flow
-2.2%
Cash-on-Cash Return
5.7%
Cap rate
0.8%
Rent to Value Ratio
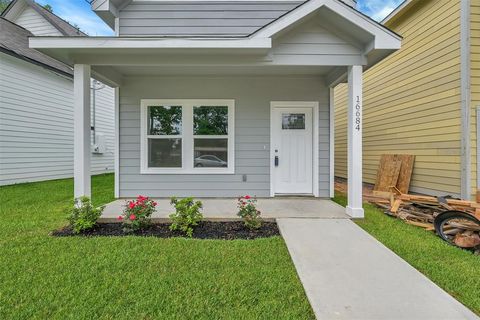
Active
$180,000
3
bds
|
0
ba
|
1,360
sqft
|
built
2023
16684 E Ivanhoe, Montgomery, TX 77316
$-117
Cash flow
-3.4%
Cash-on-Cash Return
5.5%
Cap rate
0.9%
Rent to Value Ratio
652 out of 731 properties for sale in Montgomery, TX
Limited Results Shown
Create a free account, or log in to reveal all property listings and enjoy the complete experience.
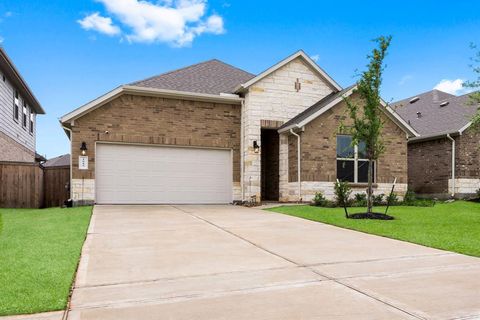
Active
$320,000
3
bds
|
0
ba
|
2,062
sqft
|
built
2022
1089 Clearwood Dr, Montgomery, TX 77316
$-139
Cash flow
-2.3%
Cash-on-Cash Return
5.7%
Cap rate
0.8%
Rent to Value Ratio
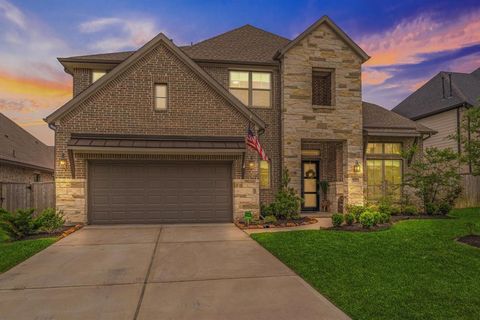
Active
$749,000
5
bds
|
0
ba
|
3,698
sqft
|
built
2022
222 Patina Sorrel Dr, Montgomery, TX 77316
$-2,279
Cash flow
-15.9%
Cash-on-Cash Return
2.6%
Cap rate
0.6%
Rent to Value Ratio

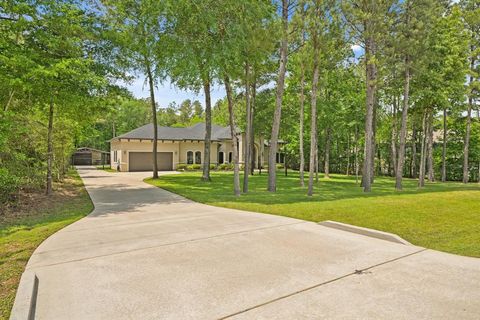
Active
$1,125,000
5
bds
|
0
ba
|
5,302
sqft
|
built
2002
64 W Shore Ln, Montgomery, TX 77356
$-2,063
Cash flow
-9.6%
Cash-on-Cash Return
4.1%
Cap rate
0.7%
Rent to Value Ratio

Active
$445,000
5
bds
|
0
ba
|
2,989
sqft
|
built
2022
1226 Tilia Creek Ln, Montgomery, TX 77316
$-1,246
Cash flow
-14.6%
Cash-on-Cash Return
2.9%
Cap rate
0.7%
Rent to Value Ratio

Active
$589,000
4
bds
|
0
ba
|
3,032
sqft
|
built
2015
231 N Waterstone Dr, Montgomery, TX 77356
$-1,588
Cash flow
-14.1%
Cash-on-Cash Return
3.0%
Cap rate
0.6%
Rent to Value Ratio
Active
$997,900
4
bds
|
0
ba
|
4,055
sqft
|
built
2014
11058 Crawford Cir, Montgomery, TX 77316
$-2,658
Cash flow
-13.9%
Cash-on-Cash Return
3.1%
Cap rate
0.5%
Rent to Value Ratio

Active
$565,000
4
bds
|
0
ba
|
3,602
sqft
|
built
2013
200 Cherry Oak Ln, Montgomery, TX 77316
$-1,464
Cash flow
-13.5%
Cash-on-Cash Return
3.2%
Cap rate
0.7%
Rent to Value Ratio

Active
$320,000
2
bds
|
0
ba
|
1,910
sqft
|
built
2021
15695 Pecan Dr, Montgomery, TX 77356
$-964
Cash flow
-15.7%
Cash-on-Cash Return
2.7%
Cap rate
0.5%
Rent to Value Ratio
Active
$180,000
3
bds
|
0
ba
|
1,360
sqft
|
built
2023
16684 E Ivanhoe, Montgomery, TX 77316
$-117
Cash flow
-3.4%
Cash-on-Cash Return
5.5%
Cap rate
0.9%
Rent to Value Ratio

Active
$529,900
5
bds
|
0
ba
|
3,628
sqft
|
built
2007
11826 Thoreau Dr, Montgomery, TX 77356
$-1,177
Cash flow
-11.6%
Cash-on-Cash Return
3.6%
Cap rate
0.7%
Rent to Value Ratio

Active
$799,000
5
bds
|
0
ba
|
4,514
sqft
|
built
2014
105 Checkerbloom Ct, Montgomery, TX 77316
$-2,656
Cash flow
-17.3%
Cash-on-Cash Return
2.3%
Cap rate
0.6%
Rent to Value Ratio
Active
$169,500
2
bds
|
0
ba
|
768
sqft
|
built
1972
9847 N Lake Vw, Montgomery, TX 77316
$-73
Cash flow
-2.2%
Cash-on-Cash Return
5.7%
Cap rate
0.8%
Rent to Value Ratio

Active
$189,900
2
bds
|
0
ba
|
1,147
sqft
|
built
2000
12565 Melville Dr, Montgomery, TX 77356
$-504
Cash flow
-13.8%
Cash-on-Cash Return
3.1%
Cap rate
0.8%
Rent to Value Ratio
Active
$999,000
5
bds
|
0
ba
|
4,606
sqft
|
built
2012
107 Sunridge Ct, Montgomery, TX 77316
$-2,092
Cash flow
-10.9%
Cash-on-Cash Return
3.8%
Cap rate
0.7%
Rent to Value Ratio
Active
$794,000
4
bds
|
0
ba
|
2,949
sqft
|
built
1994
17383 Harbor Dr, Montgomery, TX 77356
$-2,352
Cash flow
-15.5%
Cash-on-Cash Return
2.7%
Cap rate
0.5%
Rent to Value Ratio
Active
$295,000
3
bds
|
0
ba
|
1,542
sqft
|
built
1976
964 Lake View Dr, Montgomery, TX 77356
$-497
Cash flow
-8.8%
Cash-on-Cash Return
4.2%
Cap rate
0.7%
Rent to Value Ratio

Active
$789,000
4
bds
|
0
ba
|
4,041
sqft
|
built
2006
271 W Pines Dr, Montgomery, TX 77356
$-2,375
Cash flow
-15.7%
Cash-on-Cash Return
2.7%
Cap rate
0.5%
Rent to Value Ratio
Active
$445,000
4
bds
|
0
ba
|
2,843
sqft
|
built
2011
130 Springshed Pl, Montgomery, TX 77316
$-1,217
Cash flow
-14.3%
Cash-on-Cash Return
3.0%
Cap rate
0.6%
Rent to Value Ratio

Active
$284,900
2
bds
|
0
ba
|
1,797
sqft
|
built
1997
171 April Cv, Montgomery, TX 77356
$-666
Cash flow
-12.2%
Cash-on-Cash Return
3.5%
Cap rate
0.7%
Rent to Value Ratio
Active
$315,000
4
bds
|
0
ba
|
1,857
sqft
|
built
2022
906 Youth Water Rd, Montgomery, TX 77316
$-760
Cash flow
-12.6%
Cash-on-Cash Return
2.8%
Cap rate
0.7%
Rent to Value Ratio
Active
$215,000
2
bds
|
0
ba
|
1,051
sqft
|
built
1993
209 Lake View Cir, Montgomery, TX 77356
$-305
Cash flow
-7.4%
Cash-on-Cash Return
4.0%
Cap rate
0.7%
Rent to Value Ratio
Active
$550,000
5
bds
|
0
ba
|
4,468
sqft
|
built
1983
14024 Walding Woods Dr, Montgomery, TX 77356
$-788
Cash flow
-7.5%
Cash-on-Cash Return
4.0%
Cap rate
0.6%
Rent to Value Ratio
Active
$439,000
4
bds
|
0
ba
|
2,492
sqft
|
built
2023
359 Mallorn Ln, Montgomery, TX 77316
$-670
Cash flow
-8.0%
Cash-on-Cash Return
3.8%
Cap rate
0.7%
Rent to Value Ratio
Active
$299,000
3
bds
|
0
ba
|
1,750
sqft
|
built
2017
167 Axlewood Ct, Montgomery, TX 77316
$-507
Cash flow
-8.8%
Cash-on-Cash Return
3.6%
Cap rate
0.8%
Rent to Value Ratio
Active
$1,475,000
5
bds
|
0
ba
|
5,019
sqft
|
built
2012
115 Windfair Loop, Montgomery, TX 77316
$-3,046
Cash flow
-10.8%
Cash-on-Cash Return
3.2%
Cap rate
0.6%
Rent to Value Ratio
Active
$375,000
4
bds
|
0
ba
|
2,342
sqft
|
built
2007
610 Moonwalk St, Montgomery, TX 77356
$-687
Cash flow
-9.6%
Cash-on-Cash Return
3.5%
Cap rate
0.7%
Rent to Value Ratio
Active
$1,106,400
4
bds
|
0
ba
|
4,339
sqft
|
built
2018
11815 Parkside Blvd, Montgomery, TX 77356
$-3,141
Cash flow
-14.8%
Cash-on-Cash Return
2.3%
Cap rate
0.4%
Rent to Value Ratio

Active
$388,750
4
bds
|
0
ba
|
2,493
sqft
|
built
2012
119 Pike Mill Pl, Montgomery, TX 77316
$-859
Cash flow
-11.5%
Cash-on-Cash Return
3.0%
Cap rate
0.6%
Rent to Value Ratio
Active
$462,000
3
bds
|
0
ba
|
2,285
sqft
|
built
2015
103 Jacks Corner Dr, Montgomery, TX 77316
$-1,063
Cash flow
-12.0%
Cash-on-Cash Return
2.9%
Cap rate
0.6%
Rent to Value Ratio
Active
$269,000
2
bds
|
0
ba
|
1,019
sqft
|
built
1978
12500 Melville Dr, Montgomery, TX 77356
$-613
Cash flow
-11.9%
Cash-on-Cash Return
3.5%
Cap rate
0.7%
Rent to Value Ratio

Active
$199,900
2
bds
|
0
ba
|
964
sqft
|
built
1979
12100 Melville Dr, Montgomery, TX 77356
$-662
Cash flow
-17.3%
Cash-on-Cash Return
2.3%
Cap rate
0.8%
Rent to Value Ratio
Active
$879,000
4
bds
|
0
ba
|
4,600
sqft
|
built
2022
17 Bellingham Ct, Montgomery, TX 77356
$-1,230
Cash flow
-7.3%
Cash-on-Cash Return
4.6%
Cap rate
0.7%
Rent to Value Ratio

Active
$769,000
4
bds
|
0
ba
|
3,204
sqft
|
built
2022
1574 Silver Creek Ln, Montgomery, TX 77316
$-2,069
Cash flow
-14.0%
Cash-on-Cash Return
3.0%
Cap rate
0.5%
Rent to Value Ratio
Active
$365,000
2
bds
|
0
ba
|
1,645
sqft
|
built
1995
28831 Diamondhead S, Montgomery, TX 77356
$-939
Cash flow
-13.4%
Cash-on-Cash Return
3.2%
Cap rate
0.5%
Rent to Value Ratio

Active
$315,000
3
bds
|
0
ba
|
1,912
sqft
|
built
2022
308 N Spotted Fern Dr, Montgomery, TX 77316
$-807
Cash flow
-13.4%
Cash-on-Cash Return
3.2%
Cap rate
0.7%
Rent to Value Ratio
Active
$1,050,000
3
bds
|
0
ba
|
3,097
sqft
|
built
2022
27784 Armadillo Rd, Montgomery, TX 77356
$-3,750
Cash flow
-18.6%
Cash-on-Cash Return
2.0%
Cap rate
0.4%
Rent to Value Ratio
Active
$584,000
3
bds
|
0
ba
|
2,921
sqft
|
built
1999
4019 Highland Pass, Montgomery, TX 77316
$-1,336
Cash flow
-11.9%
Cash-on-Cash Return
3.5%
Cap rate
0.6%
Rent to Value Ratio
Active
$2,475,000
4
bds
|
0
ba
|
5,336
sqft
|
built
2006
9 Lake Estates Ct, Montgomery, TX 77356
$-11,487
Cash flow
-24.2%
Cash-on-Cash Return
0.7%
Cap rate
0.2%
Rent to Value Ratio

Active
$310,000
3
bds
|
0
ba
|
1,347
sqft
|
built
1993
803 Shawnee Dr, Montgomery, TX 77316
$-581
Cash flow
-9.8%
Cash-on-Cash Return
4.0%
Cap rate
0.6%
Rent to Value Ratio
Active
$1,750,000
5
bds
|
0
ba
|
7,312
sqft
|
built
2005
436 Royal Navigator Rd, Montgomery, TX 77316
$-6,125
Cash flow
-18.3%
Cash-on-Cash Return
2.1%
Cap rate
0.4%
Rent to Value Ratio