De Soto County Investment Properties for Sale
Browse homes for sale and investment properties in De Soto County. Refine your search by price, property type, or more.
Best cash flowing properties in De Soto County

Active
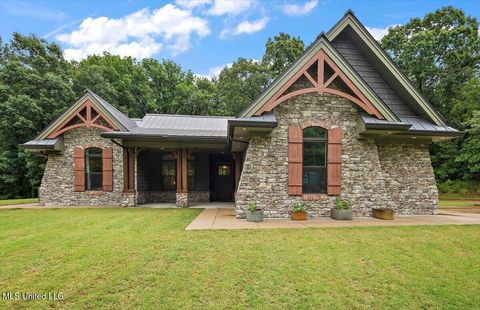
$244,900
3
bds
|
2
ba
|
0
sqft
|
built
1965
4615 Dogwood Meadows Cv, Horn Lake, MS 38637
$333
Cash flow
7.1%
Cash-on-Cash Return
7.3%
Cap rate
0.9%
Rent to Value Ratio

Active
$270,000
4
bds
|
3
ba
|
0
sqft
|
built
1977
6800 Whippoorwill Rd, Olive Branch, MS 38654
$307
Cash flow
5.9%
Cash-on-Cash Return
7.0%
Cap rate
0.9%
Rent to Value Ratio
339 out of 467 properties for sale in De Soto County
Limited Results Shown
Create a free account, or log in to reveal all property listings and enjoy the complete experience.

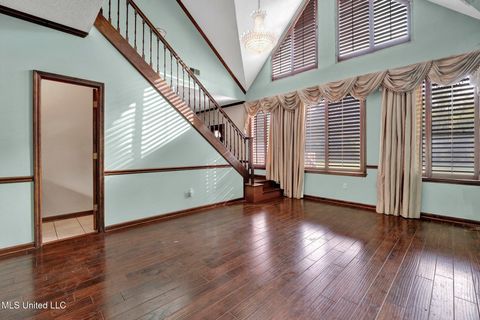
Active
$329,000
5
bds
|
2
ba
|
0
sqft
|
built
1996
7188 Larkfield Cv, Olive Branch, MS 38654
$182
Cash flow
2.9%
Cash-on-Cash Return
6.3%
Cap rate
0.8%
Rent to Value Ratio
Active
$270,000
4
bds
|
3
ba
|
0
sqft
|
built
1977
6800 Whippoorwill Rd, Olive Branch, MS 38654
$307
Cash flow
5.9%
Cash-on-Cash Return
7.0%
Cap rate
0.9%
Rent to Value Ratio

Active
$489,000
5
bds
|
3
ba
|
0
sqft
|
built
2007
8061 Falcon Dr, Olive Branch, MS 38654
$-644
Cash flow
-6.9%
Cash-on-Cash Return
4.1%
Cap rate
0.6%
Rent to Value Ratio

Active
$1,050,000
4
bds
|
5
ba
|
0
sqft
|
built
1997
12821 Whispering Pines Dr, Olive Branch, MS 38654
$-3,010
Cash flow
-15.0%
Cash-on-Cash Return
2.2%
Cap rate
0.3%
Rent to Value Ratio

Active
$300,000
5
bds
|
3
ba
|
0
sqft
|
built
2001
9091 Hunters Ridge Dr, Olive Branch, MS 38654
$232
Cash flow
4.0%
Cash-on-Cash Return
6.6%
Cap rate
0.8%
Rent to Value Ratio

Active
$549,900
6
bds
|
3
ba
|
0
sqft
|
built
2006
14377 Santa Fe Dr, Olive Branch, MS 38654
$-429
Cash flow
-4.1%
Cash-on-Cash Return
4.7%
Cap rate
0.6%
Rent to Value Ratio

Active
$350,000
3
bds
|
4
ba
|
0
sqft
|
built
1994
2185 Plum Point Rd, Southaven, MS 38672
$47
Cash flow
0.7%
Cash-on-Cash Return
5.8%
Cap rate
0.8%
Rent to Value Ratio

Active
$269,900
3
bds
|
2
ba
|
0
sqft
|
built
1970
2363 Grass Pond Rd, Hernando, MS 38632
$-454
Cash flow
-8.8%
Cash-on-Cash Return
3.7%
Cap rate
0.5%
Rent to Value Ratio

Active
$378,500
3
bds
|
3
ba
|
0
sqft
|
built
1986
8140 Hunters Hill Cv, Olive Branch, MS 38654
$-137
Cash flow
-1.9%
Cash-on-Cash Return
5.2%
Cap rate
0.7%
Rent to Value Ratio
Active
$244,900
3
bds
|
2
ba
|
0
sqft
|
built
1965
4615 Dogwood Meadows Cv, Horn Lake, MS 38637
$333
Cash flow
7.1%
Cash-on-Cash Return
7.3%
Cap rate
0.9%
Rent to Value Ratio

Active
$459,000
4
bds
|
3
ba
|
0
sqft
|
built
2022
4183 Bolivar Trl S, Olive Branch, MS 38654
$-122
Cash flow
-1.4%
Cash-on-Cash Return
5.4%
Cap rate
0.7%
Rent to Value Ratio

Active
$346,500
4
bds
|
3
ba
|
0
sqft
|
built
2007
211 Fairway Trace Dr, Hernando, MS 38632
$-169
Cash flow
-2.5%
Cash-on-Cash Return
5.1%
Cap rate
0.6%
Rent to Value Ratio

Active
$649,900
4
bds
|
4
ba
|
0
sqft
|
built
2005
1057 Crockett Loop N, Hernando, MS 38632
$-211
Cash flow
-1.7%
Cash-on-Cash Return
5.3%
Cap rate
0.7%
Rent to Value Ratio

Active
$424,900
4
bds
|
3
ba
|
0
sqft
|
built
1947
7300 Shahkoka Dr, Olive Branch, MS 38654
$-774
Cash flow
-9.5%
Cash-on-Cash Return
3.5%
Cap rate
0.5%
Rent to Value Ratio

Active
$419,900
4
bds
|
3
ba
|
0
sqft
|
built
1997
650 Fairway Dr, Hernando, MS 38632
$-223
Cash flow
-2.8%
Cash-on-Cash Return
5.0%
Cap rate
0.7%
Rent to Value Ratio

Active
$293,000
4
bds
|
2
ba
|
0
sqft
|
built
1993
5302 Plum Tree Dr, Southaven, MS 38671
$-127
Cash flow
-2.3%
Cash-on-Cash Return
5.2%
Cap rate
0.6%
Rent to Value Ratio

Active
$475,000
4
bds
|
3
ba
|
0
sqft
|
built
2018
4049 Courtyard Dr, Southaven, MS 38671
$-274
Cash flow
-3.0%
Cash-on-Cash Return
5.0%
Cap rate
0.7%
Rent to Value Ratio

Active
$750,000
5
bds
|
4
ba
|
0
sqft
|
built
2007
9030 Sandy Dr, Olive Branch, MS 38654
$-1,621
Cash flow
-11.3%
Cash-on-Cash Return
3.1%
Cap rate
0.4%
Rent to Value Ratio

Active
$539,000
5
bds
|
3
ba
|
0
sqft
|
built
2010
14291 Buttercup Dr, Olive Branch, MS 38654
$-605
Cash flow
-5.9%
Cash-on-Cash Return
4.3%
Cap rate
0.6%
Rent to Value Ratio

Active
$423,000
4
bds
|
4
ba
|
0
sqft
|
built
2001
4343 Sharon Dr, Horn Lake, MS 38637
$-256
Cash flow
-3.2%
Cash-on-Cash Return
5.0%
Cap rate
0.7%
Rent to Value Ratio
Active
$749,900
4
bds
|
4
ba
|
0
sqft
|
built
2017
4676 Star Landing Rd W, Nesbit, MS 38651
$-1,981
Cash flow
-13.8%
Cash-on-Cash Return
2.5%
Cap rate
0.3%
Rent to Value Ratio
Active
$425,000
5
bds
|
5
ba
|
0
sqft
|
built
2002
8939 Youngblood Rd, Olive Branch, MS 38654
$-256
Cash flow
-3.1%
Cash-on-Cash Return
5.0%
Cap rate
0.7%
Rent to Value Ratio

Active
$545,000
5
bds
|
3
ba
|
0
sqft
|
built
2021
4624 Bakers Trl E, Nesbit, MS 38651
$-646
Cash flow
-6.2%
Cash-on-Cash Return
4.3%
Cap rate
0.6%
Rent to Value Ratio
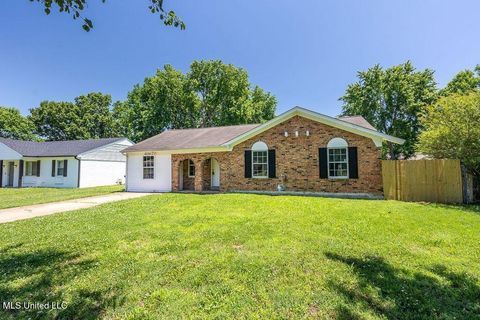
Active
$199,900
4
bds
|
2
ba
|
0
sqft
|
built
1971
6236 Tulane Rd, Horn Lake, MS 38637
$-100
Cash flow
-2.6%
Cash-on-Cash Return
5.1%
Cap rate
0.7%
Rent to Value Ratio
Active
$695,900
4
bds
|
4
ba
|
0
sqft
|
built
2000
4424 Rebekah Dr, Olive Branch, MS 38654
$-596
Cash flow
-4.5%
Cash-on-Cash Return
4.7%
Cap rate
0.6%
Rent to Value Ratio

Active
$547,200
5
bds
|
3
ba
|
0
sqft
|
built
2020
11368 Cedar Point Cv, Hernando, MS 38632
$-314
Cash flow
-3.0%
Cash-on-Cash Return
5.0%
Cap rate
0.7%
Rent to Value Ratio

Active
$499,000
3
bds
|
2
ba
|
0
sqft
|
built
1999
6821 Autumn Oaks Dr, Olive Branch, MS 38654
$-589
Cash flow
-6.2%
Cash-on-Cash Return
4.3%
Cap rate
0.6%
Rent to Value Ratio

Active
$330,000
3
bds
|
2
ba
|
0
sqft
|
built
2018
6750 Whooper Swan Dr, Olive Branch, MS 38654
$-72
Cash flow
-1.1%
Cash-on-Cash Return
5.4%
Cap rate
0.8%
Rent to Value Ratio

Active
$399,975
3
bds
|
2
ba
|
0
sqft
|
built
1988
5205 Marthavale Cv, Southaven, MS 38671
$-345
Cash flow
-4.5%
Cash-on-Cash Return
4.6%
Cap rate
0.6%
Rent to Value Ratio

Active
$385,000
3
bds
|
3
ba
|
0
sqft
|
built
1993
7925 Kirkwood Cv, Olive Branch, MS 38654
$-305
Cash flow
-4.1%
Cash-on-Cash Return
4.7%
Cap rate
0.6%
Rent to Value Ratio

Active
$270,000
3
bds
|
2
ba
|
0
sqft
|
built
1966
2881 Highway 305 S, Hernando, MS 38632
$188
Cash flow
3.6%
Cash-on-Cash Return
6.5%
Cap rate
0.8%
Rent to Value Ratio

Active
$499,900
5
bds
|
3
ba
|
0
sqft
|
built
2013
8240 Steven Henry Rd, Hernando, MS 38632
$-85
Cash flow
-0.9%
Cash-on-Cash Return
5.5%
Cap rate
0.7%
Rent to Value Ratio
Active
$209,900
3
bds
|
2
ba
|
0
sqft
|
built
1981
8615 Bridgewood Dr, Southaven, MS 38671
$-18
Cash flow
-0.4%
Cash-on-Cash Return
5.6%
Cap rate
0.8%
Rent to Value Ratio

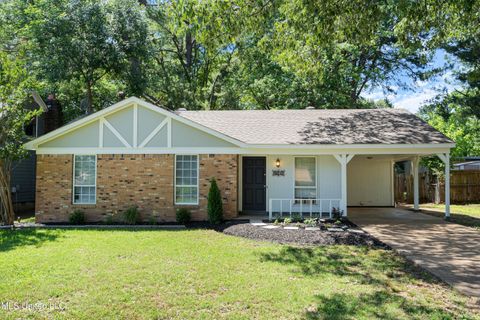
Active
$185,900
3
bds
|
2
ba
|
0
sqft
|
built
1988
6450 Yorkshire Rd, Horn Lake, MS 38637
$29
Cash flow
0.8%
Cash-on-Cash Return
5.9%
Cap rate
0.8%
Rent to Value Ratio

Active
$169,000
2
bds
|
2
ba
|
0
sqft
|
built
1984
6505 Riverdale Rd, Horn Lake, MS 38637
$244
Cash flow
7.5%
Cash-on-Cash Return
7.4%
Cap rate
0.9%
Rent to Value Ratio
Active
$315,000
4
bds
|
3
ba
|
0
sqft
|
built
1995
5525 Belmont Rd, Hernando, MS 38632
$-67
Cash flow
-1.1%
Cash-on-Cash Return
5.4%
Cap rate
0.7%
Rent to Value Ratio

Active
$249,900
3
bds
|
2
ba
|
0
sqft
|
built
1982
747 Cumberland Cv, Southaven, MS 38671
$33
Cash flow
0.7%
Cash-on-Cash Return
5.8%
Cap rate
0.8%
Rent to Value Ratio

Active
$215,000
3
bds
|
2
ba
|
0
sqft
|
built
1986
6285 Collinwood Rd, Horn Lake, MS 38637
$86
Cash flow
2.1%
Cash-on-Cash Return
6.2%
Cap rate
0.7%
Rent to Value Ratio

Active
$189,900
3
bds
|
1
ba
|
0
sqft
|
built
1961
1597 Vicksburg Dr, Southaven, MS 38671
$56
Cash flow
1.5%
Cash-on-Cash Return
6.0%
Cap rate
0.8%
Rent to Value Ratio

Active
$319,000
4
bds
|
2
ba
|
0
sqft
|
built
2017
7497 Redberry Dr, Horn Lake, MS 38637
$-357
Cash flow
-5.8%
Cash-on-Cash Return
4.3%
Cap rate
0.6%
Rent to Value Ratio