De Soto County Investment Properties for Sale
Browse homes for sale and investment properties in De Soto County. Refine your search by price, property type, or more.
Best cash flowing properties in De Soto County

Active
$100,000
1
bds
|
1
ba
|
0
sqft
|
built
1970
3222 High Rd, Hernando, MS 38632
$453
Cash flow
23.6%
Cash-on-Cash Return
11.1%
Cap rate
1.4%
Rent to Value Ratio

Active
$314,900
4
bds
|
2
ba
|
0
sqft
|
built
2022
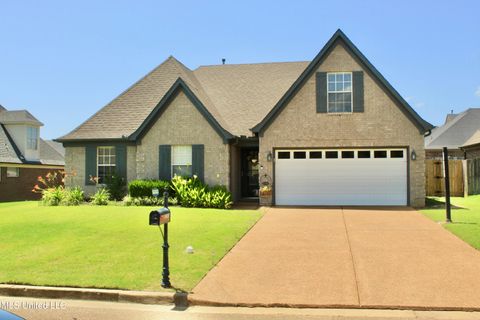
2616 Dela Dr, Southaven, MS 38672
$258
Cash flow
4.3%
Cash-on-Cash Return
6.7%
Cap rate
0.9%
Rent to Value Ratio
341 out of 470 properties for sale in De Soto County
Limited Results Shown
Create a free account, or log in to reveal all property listings and enjoy the complete experience.

Active
$319,000
3
bds
|
2
ba
|
0
sqft
|
built
1996
5380 Park Place Dr, Horn Lake, MS 38637
$-117
Cash flow
-1.9%
Cash-on-Cash Return
5.2%
Cap rate
0.7%
Rent to Value Ratio
Active
$342,900
4
bds
|
2
ba
|
0
sqft
|
built
2002
7741 Meadow Ridge Ln, Olive Branch, MS 38654
$-190
Cash flow
-2.9%
Cash-on-Cash Return
5.0%
Cap rate
0.7%
Rent to Value Ratio

Active
$450,000
4
bds
|
4
ba
|
0
sqft
|
built
2007
3558 Williams Brooke Ln, Hernando, MS 38632
$-320
Cash flow
-3.7%
Cash-on-Cash Return
4.8%
Cap rate
0.7%
Rent to Value Ratio

Active
$399,900
3
bds
|
2
ba
|
0
sqft
|
built
2022
630 Millers Way, Nesbit, MS 38651
$-568
Cash flow
-7.4%
Cash-on-Cash Return
4.0%
Cap rate
0.6%
Rent to Value Ratio

Active
$799,900
4
bds
|
4
ba
|
0
sqft
|
built
1999
1201 Wheeler Rd, Hernando, MS 38632
$-1,830
Cash flow
-11.9%
Cash-on-Cash Return
2.9%
Cap rate
0.4%
Rent to Value Ratio

Active
$355,000
4
bds
|
2
ba
|
0
sqft
|
built
1999
1020 Worthington Dr, Southaven, MS 38671
$-410
Cash flow
-6.0%
Cash-on-Cash Return
4.3%
Cap rate
0.6%
Rent to Value Ratio

Active
$399,999
4
bds
|
4
ba
|
0
sqft
|
built
2004
890 Lindsey Cv, Hernando, MS 38632
$-208
Cash flow
-2.7%
Cash-on-Cash Return
5.1%
Cap rate
0.7%
Rent to Value Ratio

Active
$468,500
4
bds
|
3
ba
|
0
sqft
|
built
2021
9653 Trenton Trl, Olive Branch, MS 38654
$-439
Cash flow
-4.9%
Cash-on-Cash Return
4.6%
Cap rate
0.6%
Rent to Value Ratio

Active
$329,900
3
bds
|
2
ba
|
0
sqft
|
built
2003
4891 Stone Cross Dr, Olive Branch, MS 38654
$-211
Cash flow
-3.3%
Cash-on-Cash Return
4.9%
Cap rate
0.7%
Rent to Value Ratio

Active
$575,000
5
bds
|
3
ba
|
0
sqft
|
built
2022
3702 Fossil Hill Dr S, Hernando, MS 38632
$95
Cash flow
0.9%
Cash-on-Cash Return
5.9%
Cap rate
0.8%
Rent to Value Ratio
Active
$426,000
5
bds
|
3
ba
|
0
sqft
|
built
2018
5228 Forest Bend Cv, Southaven, MS 38672
$-178
Cash flow
-2.2%
Cash-on-Cash Return
5.2%
Cap rate
0.7%
Rent to Value Ratio

Active
$180,000
3
bds
|
2
ba
|
0
sqft
|
built
1988
3435 Carroll Dr, Horn Lake, MS 38637
$188
Cash flow
5.4%
Cash-on-Cash Return
6.9%
Cap rate
0.9%
Rent to Value Ratio

Active
$400,000
5
bds
|
3
ba
|
0
sqft
|
built
2022
187 Magnolia Heights Dr, Hernando, MS 38632
$-185
Cash flow
-2.4%
Cash-on-Cash Return
5.1%
Cap rate
0.7%
Rent to Value Ratio

Active
$375,000
4
bds
|
3
ba
|
0
sqft
|
built
2008
3295 Forest Bend Dr, Southaven, MS 38672
$-20
Cash flow
-0.3%
Cash-on-Cash Return
5.6%
Cap rate
0.7%
Rent to Value Ratio
Active
$239,900
2
bds
|
2
ba
|
0
sqft
|
built
1998
6718 Beaumont Cir, Southaven, MS 38671
$-87
Cash flow
-1.9%
Cash-on-Cash Return
5.2%
Cap rate
0.8%
Rent to Value Ratio

Active
$289,900
3
bds
|
2
ba
|
0
sqft
|
built
2007
4458 Stone Park Blvd, Olive Branch, MS 38654
$92
Cash flow
1.7%
Cash-on-Cash Return
6.1%
Cap rate
0.8%
Rent to Value Ratio

Active
$319,900
4
bds
|
3
ba
|
0
sqft
|
built
2022
7599 Ridgefield Dr, Horn Lake, MS 38637
$-73
Cash flow
-1.2%
Cash-on-Cash Return
5.4%
Cap rate
0.8%
Rent to Value Ratio

Active
$625,000
6
bds
|
4
ba
|
0
sqft
|
built
2007
5358 Horn Lake Rd, Horn Lake, MS 38637
$-1,232
Cash flow
-10.3%
Cash-on-Cash Return
3.3%
Cap rate
0.5%
Rent to Value Ratio

Active
$650,000
5
bds
|
6
ba
|
0
sqft
|
built
1989
1602 Stonehedge Dr, Southaven, MS 38671
$-469
Cash flow
-3.8%
Cash-on-Cash Return
4.8%
Cap rate
0.7%
Rent to Value Ratio

Active
$575,000
6
bds
|
4
ba
|
0
sqft
|
built
2007
4035 Garden Rd, Southaven, MS 38672
$-535
Cash flow
-4.9%
Cash-on-Cash Return
4.6%
Cap rate
0.6%
Rent to Value Ratio
Active
$100,000
1
bds
|
1
ba
|
0
sqft
|
built
1970
3222 High Rd, Hernando, MS 38632
$453
Cash flow
23.6%
Cash-on-Cash Return
11.1%
Cap rate
1.4%
Rent to Value Ratio
Active
$1,100,000
5
bds
|
5
ba
|
0
sqft
|
built
1993
12965 Whispering Pines Dr, Olive Branch, MS 38654
$-2,691
Cash flow
-12.8%
Cash-on-Cash Return
2.7%
Cap rate
0.4%
Rent to Value Ratio

Active
$399,900
4
bds
|
3
ba
|
0
sqft
|
built
2006
7199 Terrace Stone Dr, Olive Branch, MS 38654
$-223
Cash flow
-2.9%
Cash-on-Cash Return
5.0%
Cap rate
0.7%
Rent to Value Ratio

Active
$365,000
3
bds
|
3
ba
|
0
sqft
|
built
1998
9082 Fox Cv, Olive Branch, MS 38654
$-161
Cash flow
-2.3%
Cash-on-Cash Return
5.1%
Cap rate
0.7%
Rent to Value Ratio

Active
$629,900
4
bds
|
4
ba
|
0
sqft
|
built
2008
3784 Houston Loop N, Southaven, MS 38671
$-1,062
Cash flow
-8.8%
Cash-on-Cash Return
3.7%
Cap rate
0.5%
Rent to Value Ratio
Active
$319,999
4
bds
|
2
ba
|
0
sqft
|
built
2009
5503 Sugarberry Ln, Southaven, MS 38672
$-40
Cash flow
-0.7%
Cash-on-Cash Return
5.5%
Cap rate
0.8%
Rent to Value Ratio

Active
$329,000
4
bds
|
2
ba
|
0
sqft
|
built
2011
2827 Flora Lee Dr S, Nesbit, MS 38651
$-192
Cash flow
-3.0%
Cash-on-Cash Return
5.0%
Cap rate
0.7%
Rent to Value Ratio
Active
$544,900
4
bds
|
3
ba
|
0
sqft
|
built
2016
4342 Robinson Loop E, Olive Branch, MS 38654
$-202
Cash flow
-1.9%
Cash-on-Cash Return
5.2%
Cap rate
0.7%
Rent to Value Ratio
Active
$314,900
4
bds
|
2
ba
|
0
sqft
|
built
2022
2616 Dela Dr, Southaven, MS 38672
$258
Cash flow
4.3%
Cash-on-Cash Return
6.7%
Cap rate
0.9%
Rent to Value Ratio
Active
$305,000
3
bds
|
3
ba
|
0
sqft
|
built
2005
3205 Roseleigh Dr, Southaven, MS 38672
$-69
Cash flow
-1.2%
Cash-on-Cash Return
5.4%
Cap rate
0.7%
Rent to Value Ratio

Active
$854,400
6
bds
|
4
ba
|
0
sqft
|
built
2019
9108 Honey Suckle Way, Hernando, MS 38632
$-1,279
Cash flow
-7.8%
Cash-on-Cash Return
3.9%
Cap rate
0.5%
Rent to Value Ratio

Active
$396,000
3
bds
|
2
ba
|
0
sqft
|
built
1983
4858 Victoria Dr, Nesbit, MS 38651
$-559
Cash flow
-7.4%
Cash-on-Cash Return
4.0%
Cap rate
0.5%
Rent to Value Ratio

Active
$399,000
4
bds
|
4
ba
|
0
sqft
|
built
2005
7888 Shelburne Ln E, Southaven, MS 38672
$-281
Cash flow
-3.7%
Cash-on-Cash Return
4.8%
Cap rate
0.7%
Rent to Value Ratio

Active
$399,900
4
bds
|
3
ba
|
0
sqft
|
built
1996
4481 Summers Place Dr, Olive Branch, MS 38654
$-689
Cash flow
-9.0%
Cash-on-Cash Return
3.6%
Cap rate
0.5%
Rent to Value Ratio

Active
$410,000
3
bds
|
2
ba
|
0
sqft
|
built
2006
1719 Magnolia Manor Dr, Hernando, MS 38632
$-407
Cash flow
-5.2%
Cash-on-Cash Return
4.5%
Cap rate
0.6%
Rent to Value Ratio
Active
$334,000
3
bds
|
2
ba
|
0
sqft
|
built
1996
8823 Bell Forrest Dr, Olive Branch, MS 38654
$-191
Cash flow
-3.0%
Cash-on-Cash Return
5.0%
Cap rate
0.7%
Rent to Value Ratio
Active
$413,500
4
bds
|
3
ba
|
0
sqft
|
built
2014
4120 Mitchell Pl, Olive Branch, MS 38654
$-281
Cash flow
-3.5%
Cash-on-Cash Return
4.9%
Cap rate
0.7%
Rent to Value Ratio

Active
$406,500
4
bds
|
3
ba
|
0
sqft
|
built
2022
1716 Lia Ln, Southaven, MS 38672
$-214
Cash flow
-2.7%
Cash-on-Cash Return
5.0%
Cap rate
0.7%
Rent to Value Ratio

Active
$285,000
4
bds
|
3
ba
|
0
sqft
|
built
2001
9192 Rachel Shea Ave, Olive Branch, MS 38654
$60
Cash flow
1.1%
Cash-on-Cash Return
5.9%
Cap rate
0.8%
Rent to Value Ratio

Active
$579,999
4
bds
|
4
ba
|
0
sqft
|
built
2014
4833 Delbridge Ct E, Olive Branch, MS 38654
$-342
Cash flow
-3.1%
Cash-on-Cash Return
5.0%
Cap rate
0.7%
Rent to Value Ratio