De Soto County Investment Properties for Sale
Browse homes for sale and investment properties in De Soto County. Refine your search by price, property type, or more.
Best cash flowing properties in De Soto County

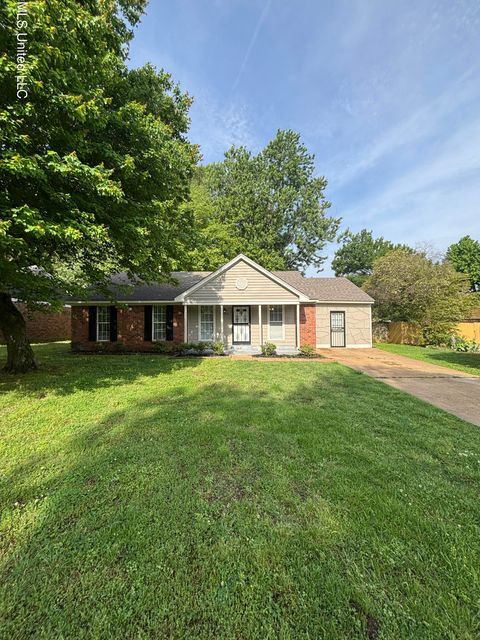
Pending
$164,900
3
bds
|
1
ba
|
0
sqft
|
built
1964
8505 Southaven Cir W, Southaven, MS 38671
$0
Cash flow
0.0%
Cash-on-Cash Return
6.3%
Cap rate
0.8%
Rent to Value Ratio

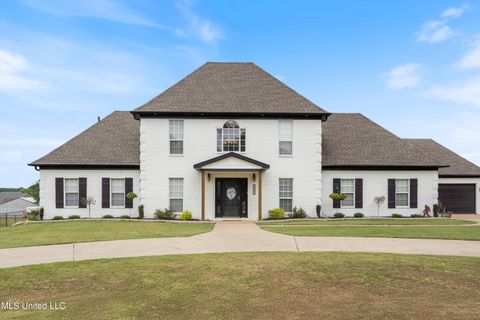
Active
$355,000
4
bds
|
3
ba
|
0
sqft
|
built
2007
2723 Hill Valley Ln, Southaven, MS 38672
$-85
Cash flow
-1.2%
Cash-on-Cash Return
6.0%
Cap rate
0.8%
Rent to Value Ratio
400 out of 439 properties for sale in De Soto County
Limited Results Shown
Create a free account, or log in to reveal all property listings and enjoy the complete experience.

Active
$355,900
4
bds
|
2
ba
|
0
sqft
|
built
2010
4239 Three Wishes Cv, Olive Branch, MS 38654
$-467
Cash flow
-6.8%
Cash-on-Cash Return
4.7%
Cap rate
0.6%
Rent to Value Ratio

Active
$369,900
4
bds
|
3
ba
|
0
sqft
|
built
2000
7056 Apache Dr, Olive Branch, MS 38654
$-358
Cash flow
-5.0%
Cash-on-Cash Return
5.1%
Cap rate
0.7%
Rent to Value Ratio

Active
$345,000
3
bds
|
3
ba
|
0
sqft
|
built
2003
6447 Cheyenne Dr, Olive Branch, MS 38654
$-526
Cash flow
-8.0%
Cash-on-Cash Return
4.4%
Cap rate
0.7%
Rent to Value Ratio

Active
$575,000
4
bds
|
4
ba
|
0
sqft
|
built
2020
7251 Eastern Rd, Olive Branch, MS 38654
$-1,350
Cash flow
-12.2%
Cash-on-Cash Return
3.4%
Cap rate
0.5%
Rent to Value Ratio

Active
$365,000
4
bds
|
2
ba
|
0
sqft
|
built
2015
4813 Rosepetal Cv, Southaven, MS 38672
$-326
Cash flow
-4.7%
Cash-on-Cash Return
5.2%
Cap rate
0.7%
Rent to Value Ratio
Active
$209,900
4
bds
|
2
ba
|
0
sqft
|
built
1986
6405 Collinwood Rd, Horn Lake, MS 38637
$-265
Cash flow
-6.6%
Cash-on-Cash Return
4.8%
Cap rate
0.7%
Rent to Value Ratio

Active
$512,000
5
bds
|
4
ba
|
0
sqft
|
built
1989
3480 Hillsdale Rd, Olive Branch, MS 38654
$-773
Cash flow
-7.9%
Cash-on-Cash Return
4.5%
Cap rate
0.6%
Rent to Value Ratio

Active
$444,000
5
bds
|
4
ba
|
0
sqft
|
built
2016
650 Bouldercrest Dr, Southaven, MS 38672
$-597
Cash flow
-7.0%
Cash-on-Cash Return
4.7%
Cap rate
0.7%
Rent to Value Ratio
Active
$349,000
3
bds
|
2
ba
|
0
sqft
|
built
1905
9142 Railroad Ave, Olive Branch, MS 38654
$-183
Cash flow
-2.7%
Cash-on-Cash Return
5.6%
Cap rate
0.7%
Rent to Value Ratio

Active
$330,372
4
bds
|
3
ba
|
0
sqft
|
built
2014
7454 Redberry Dr, Horn Lake, MS 38637
$-562
Cash flow
-8.9%
Cash-on-Cash Return
4.2%
Cap rate
0.6%
Rent to Value Ratio

Active
$347,250
4
bds
|
2
ba
|
0
sqft
|
built
2018
6703 Jessie Hoyt Dr, Olive Branch, MS 38654
$-404
Cash flow
-6.1%
Cash-on-Cash Return
4.9%
Cap rate
0.7%
Rent to Value Ratio

Active
$269,900
3
bds
|
3
ba
|
0
sqft
|
built
1998
5881 Morganton Dr, Olive Branch, MS 38654
$-170
Cash flow
-3.3%
Cash-on-Cash Return
5.5%
Cap rate
0.7%
Rent to Value Ratio

Active
$465,000
5
bds
|
4
ba
|
0
sqft
|
built
1996
5135 Windy Ridge Dr, Southaven, MS 38671
$-686
Cash flow
-7.7%
Cash-on-Cash Return
4.5%
Cap rate
0.6%
Rent to Value Ratio

Active
$400,000
5
bds
|
3
ba
|
0
sqft
|
built
2022
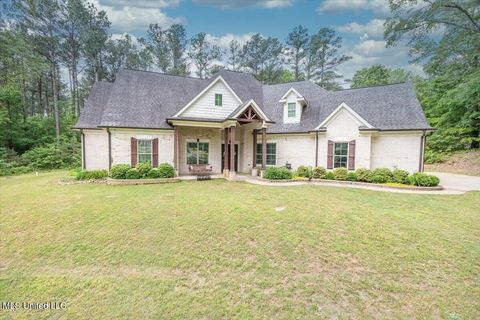
214 Byhalia Creek Farms Rd E, Byhalia, MS 38611
$-246
Cash flow
-3.2%
Cash-on-Cash Return
5.5%
Cap rate
0.7%
Rent to Value Ratio

Active
$335,000
3
bds
|
2
ba
|
0
sqft
|
built
1995
9004 Lakeside Cv, Olive Branch, MS 38654
$-356
Cash flow
-5.5%
Cash-on-Cash Return
5.0%
Cap rate
0.7%
Rent to Value Ratio
Active
$329,500
4
bds
|
3
ba
|
0
sqft
|
built
2002
1289 Ridge Cv, Hernando, MS 38632
$-216
Cash flow
-3.4%
Cash-on-Cash Return
5.5%
Cap rate
0.8%
Rent to Value Ratio
Active
$650,000
5
bds
|
5
ba
|
0
sqft
|
built
2002
4445 Robertson Gin Rd, Hernando, MS 38632
$-938
Cash flow
-7.5%
Cash-on-Cash Return
4.5%
Cap rate
0.6%
Rent to Value Ratio

Active
$559,000
5
bds
|
3
ba
|
0
sqft
|
built
2015
13881 Sycamore Creek Cv, Olive Branch, MS 38654
$-643
Cash flow
-6.0%
Cash-on-Cash Return
4.9%
Cap rate
0.6%
Rent to Value Ratio

Active
$547,500
4
bds
|
4
ba
|
0
sqft
|
built
2000
6507 Shenandoah Ln, Olive Branch, MS 38654
$-774
Cash flow
-7.4%
Cash-on-Cash Return
4.6%
Cap rate
0.7%
Rent to Value Ratio

Pending
$385,000
4
bds
|
3
ba
|
0
sqft
|
built
2019
3430 Clair Cir W, Hernando, MS 38632
$-254
Cash flow
-3.4%
Cash-on-Cash Return
5.5%
Cap rate
0.8%
Rent to Value Ratio

Active
$472,000
4
bds
|
3
ba
|
0
sqft
|
built
2019
4638 Balterson Loop S, Olive Branch, MS 38654
$-525
Cash flow
-5.8%
Cash-on-Cash Return
4.9%
Cap rate
0.7%
Rent to Value Ratio
Active
$695,000
4
bds
|
4
ba
|
0
sqft
|
built
2014
223 Fawn Cv, Hernando, MS 38632
$-1,644
Cash flow
-12.3%
Cash-on-Cash Return
3.4%
Cap rate
0.5%
Rent to Value Ratio
Active
$599,900
4
bds
|
4
ba
|
0
sqft
|
built
2006
7401 Michael Dr, Hernando, MS 38632
$-1,115
Cash flow
-9.7%
Cash-on-Cash Return
4.0%
Cap rate
0.5%
Rent to Value Ratio

Active
$382,000
4
bds
|
3
ba
|
0
sqft
|
built
2007
3426 Westwind Dr, Nesbit, MS 38651
$-388
Cash flow
-5.3%
Cash-on-Cash Return
5.0%
Cap rate
0.7%
Rent to Value Ratio

Active
$950,000
6
bds
|
6
ba
|
0
sqft
|
built
1988
7300 Davidson Rd, Olive Branch, MS 38654
$-3,138
Cash flow
-17.2%
Cash-on-Cash Return
2.3%
Cap rate
0.3%
Rent to Value Ratio
Active
$355,000
4
bds
|
3
ba
|
0
sqft
|
built
2007
2723 Hill Valley Ln, Southaven, MS 38672
$-85
Cash flow
-1.2%
Cash-on-Cash Return
6.0%
Cap rate
0.8%
Rent to Value Ratio

Active
$184,110
3
bds
|
2
ba
|
0
sqft
|
built
2008
1748 Dorchester Dr, Southaven, MS 38671
$-183
Cash flow
-5.2%
Cash-on-Cash Return
5.1%
Cap rate
0.8%
Rent to Value Ratio

Pending
$359,000
5
bds
|
3
ba
|
0
sqft
|
built
2002
4854 Stone Cross Dr, Olive Branch, MS 38654
$-451
Cash flow
-6.6%
Cash-on-Cash Return
4.8%
Cap rate
0.7%
Rent to Value Ratio
Active
$399,700
5
bds
|
3
ba
|
0
sqft
|
built
2002
7231 Wind Dr, Olive Branch, MS 38654
$-463
Cash flow
-6.0%
Cash-on-Cash Return
4.9%
Cap rate
0.6%
Rent to Value Ratio

Active
$380,000
4
bds
|
2
ba
|
0
sqft
|
built
2013
4130 Aberleigh Ln, Olive Branch, MS 38654
$-282
Cash flow
-3.9%
Cash-on-Cash Return
5.4%
Cap rate
0.7%
Rent to Value Ratio

Active
$620,000
5
bds
|
4
ba
|
0
sqft
|
built
2005
5352 Nail Rd, Olive Branch, MS 38654
$-1,059
Cash flow
-8.9%
Cash-on-Cash Return
4.2%
Cap rate
0.6%
Rent to Value Ratio

Active
$519,900
4
bds
|
3
ba
|
0
sqft
|
built
2020
9113 Rue Orleans Ln, Olive Branch, MS 38654
$-834
Cash flow
-8.4%
Cash-on-Cash Return
4.3%
Cap rate
0.6%
Rent to Value Ratio

Active
$469,000
4
bds
|
3
ba
|
0
sqft
|
built
2022
2320 Loisy Blvd, Hernando, MS 38632
$-534
Cash flow
-5.9%
Cash-on-Cash Return
4.9%
Cap rate
0.7%
Rent to Value Ratio

Active
$495,000
4
bds
|
4
ba
|
0
sqft
|
built
2014
598 Benton Dr, Nesbit, MS 38651
$-1,108
Cash flow
-11.7%
Cash-on-Cash Return
3.6%
Cap rate
0.5%
Rent to Value Ratio

Active
$399,900
4
bds
|
3
ba
|
0
sqft
|
built
1998
3680 Cypress Plantation Dr, Olive Branch, MS 38654
$-319
Cash flow
-4.2%
Cash-on-Cash Return
5.3%
Cap rate
0.7%
Rent to Value Ratio

Active
$659,900
5
bds
|
6
ba
|
0
sqft
|
built
1990
1590 Epping Forest Dr, Southaven, MS 38671
$-580
Cash flow
-4.6%
Cash-on-Cash Return
5.2%
Cap rate
0.7%
Rent to Value Ratio

Active
$545,000
4
bds
|
3
ba
|
0
sqft
|
built
1986
8080 Tchulahoma Rd, Southaven, MS 38671
$-934
Cash flow
-8.9%
Cash-on-Cash Return
4.2%
Cap rate
0.6%
Rent to Value Ratio

Active
$949,000
5
bds
|
4
ba
|
0
sqft
|
built
2022
326 Fairview Trl, Byhalia, MS 38611
$-2,786
Cash flow
-15.3%
Cash-on-Cash Return
2.7%
Cap rate
0.4%
Rent to Value Ratio

Active
$374,900
4
bds
|
4
ba
|
0
sqft
|
built
1998
1705 Cedar Lake Cv, Hernando, MS 38632
$-278
Cash flow
-3.9%
Cash-on-Cash Return
5.4%
Cap rate
0.7%
Rent to Value Ratio
Pending
$164,900
3
bds
|
1
ba
|
0
sqft
|
built
1964
8505 Southaven Cir W, Southaven, MS 38671
$0
Cash flow
0.0%
Cash-on-Cash Return
6.3%
Cap rate
0.8%
Rent to Value Ratio