De Soto County Investment Properties for Sale
Browse homes for sale and investment properties in De Soto County. Refine your search by price, property type, or more.
Best cash flowing properties in De Soto County

Active
$169,000
2
bds
|
2
ba
|
0
sqft
|
built
1984
6505 Riverdale Rd, Horn Lake, MS 38637
$244
Cash flow
7.5%
Cash-on-Cash Return
7.4%
Cap rate
0.9%
Rent to Value Ratio

Active
$270,000
3
bds
|
2
ba
|
0
sqft
|
built
1966
2881 Highway 305 S, Hernando, MS 38632
$188
Cash flow
3.6%
Cash-on-Cash Return
6.5%
Cap rate
0.8%
Rent to Value Ratio
400 out of 439 properties for sale in De Soto County
Limited Results Shown
Create a free account, or log in to reveal all property listings and enjoy the complete experience.

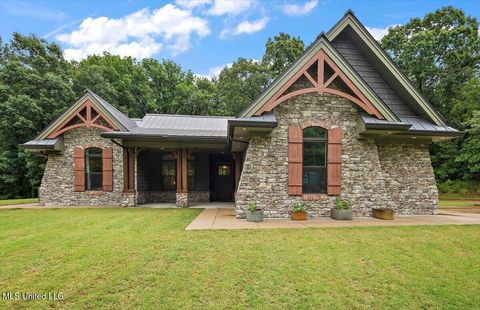
Active
$539,000
5
bds
|
3
ba
|
0
sqft
|
built
2010
14291 Buttercup Dr, Olive Branch, MS 38654
$-605
Cash flow
-5.9%
Cash-on-Cash Return
4.3%
Cap rate
0.6%
Rent to Value Ratio
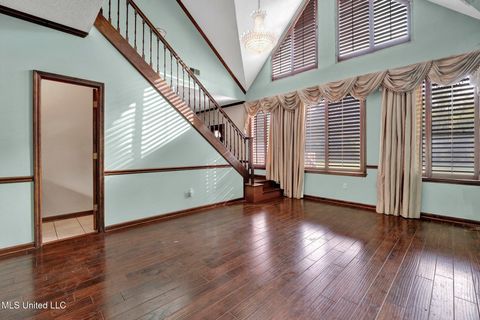
Active
$749,900
4
bds
|
4
ba
|
0
sqft
|
built
2017
4676 Star Landing Rd W, Nesbit, MS 38651
$-1,981
Cash flow
-13.8%
Cash-on-Cash Return
2.5%
Cap rate
0.3%
Rent to Value Ratio
Active
$425,000
5
bds
|
5
ba
|
0
sqft
|
built
2002
8939 Youngblood Rd, Olive Branch, MS 38654
$-256
Cash flow
-3.1%
Cash-on-Cash Return
5.0%
Cap rate
0.7%
Rent to Value Ratio

Active
$545,000
5
bds
|
3
ba
|
0
sqft
|
built
2021
4624 Bakers Trl E, Nesbit, MS 38651
$-646
Cash flow
-6.2%
Cash-on-Cash Return
4.3%
Cap rate
0.6%
Rent to Value Ratio

Active
$547,200
5
bds
|
3
ba
|
0
sqft
|
built
2020
11368 Cedar Point Cv, Hernando, MS 38632
$-314
Cash flow
-3.0%
Cash-on-Cash Return
5.0%
Cap rate
0.7%
Rent to Value Ratio

Pending
$458,920
4
bds
|
3
ba
|
0
sqft
|
built
2000
2375 Cumberland Dr, Southaven, MS 38672
$-344
Cash flow
-3.9%
Cash-on-Cash Return
4.8%
Cap rate
0.7%
Rent to Value Ratio
Active
$695,900
4
bds
|
4
ba
|
0
sqft
|
built
2000
4424 Rebekah Dr, Olive Branch, MS 38654
$-596
Cash flow
-4.5%
Cash-on-Cash Return
4.7%
Cap rate
0.6%
Rent to Value Ratio
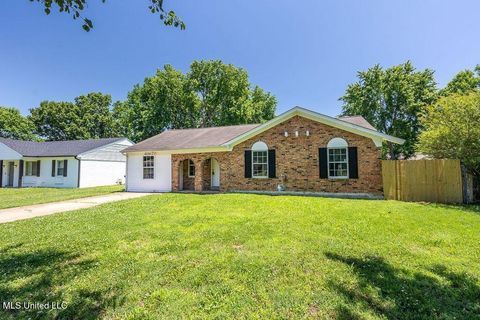
Active
$199,900
4
bds
|
2
ba
|
0
sqft
|
built
1971
6236 Tulane Rd, Horn Lake, MS 38637
$-100
Cash flow
-2.6%
Cash-on-Cash Return
5.1%
Cap rate
0.7%
Rent to Value Ratio

Active
$499,000
3
bds
|
2
ba
|
0
sqft
|
built
1999
6821 Autumn Oaks Dr, Olive Branch, MS 38654
$-589
Cash flow
-6.2%
Cash-on-Cash Return
4.3%
Cap rate
0.6%
Rent to Value Ratio

Active
$330,000
3
bds
|
2
ba
|
0
sqft
|
built
2018
6750 Whooper Swan Dr, Olive Branch, MS 38654
$-72
Cash flow
-1.1%
Cash-on-Cash Return
5.4%
Cap rate
0.8%
Rent to Value Ratio

Active
$349,500
3
bds
|
2
ba
|
0
sqft
|
built
2007
3753 Kenton Dr, Southaven, MS 38672
$-53
Cash flow
-0.8%
Cash-on-Cash Return
5.5%
Cap rate
0.7%
Rent to Value Ratio
Active
$270,000
3
bds
|
2
ba
|
0
sqft
|
built
1966
2881 Highway 305 S, Hernando, MS 38632
$188
Cash flow
3.6%
Cash-on-Cash Return
6.5%
Cap rate
0.8%
Rent to Value Ratio

Active
$499,900
5
bds
|
3
ba
|
0
sqft
|
built
2013
8240 Steven Henry Rd, Hernando, MS 38632
$-85
Cash flow
-0.9%
Cash-on-Cash Return
5.5%
Cap rate
0.7%
Rent to Value Ratio

Active
$385,000
3
bds
|
3
ba
|
0
sqft
|
built
1993
7925 Kirkwood Cv, Olive Branch, MS 38654
$-305
Cash flow
-4.1%
Cash-on-Cash Return
4.7%
Cap rate
0.6%
Rent to Value Ratio

Active
$399,975
3
bds
|
2
ba
|
0
sqft
|
built
1988
5205 Marthavale Cv, Southaven, MS 38671
$-345
Cash flow
-4.5%
Cash-on-Cash Return
4.6%
Cap rate
0.6%
Rent to Value Ratio
Active
$209,900
3
bds
|
2
ba
|
0
sqft
|
built
1981
8615 Bridgewood Dr, Southaven, MS 38671
$-18
Cash flow
-0.4%
Cash-on-Cash Return
5.6%
Cap rate
0.8%
Rent to Value Ratio

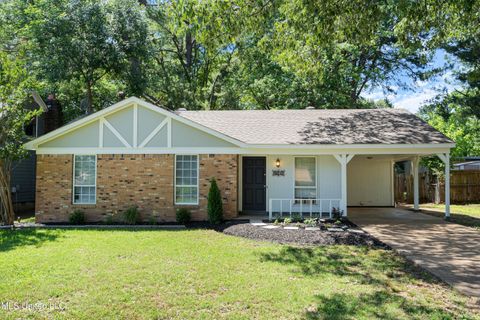
Active
$185,900
3
bds
|
2
ba
|
0
sqft
|
built
1988
6450 Yorkshire Rd, Horn Lake, MS 38637
$29
Cash flow
0.8%
Cash-on-Cash Return
5.9%
Cap rate
0.8%
Rent to Value Ratio
Active
$169,000
2
bds
|
2
ba
|
0
sqft
|
built
1984
6505 Riverdale Rd, Horn Lake, MS 38637
$244
Cash flow
7.5%
Cash-on-Cash Return
7.4%
Cap rate
0.9%
Rent to Value Ratio
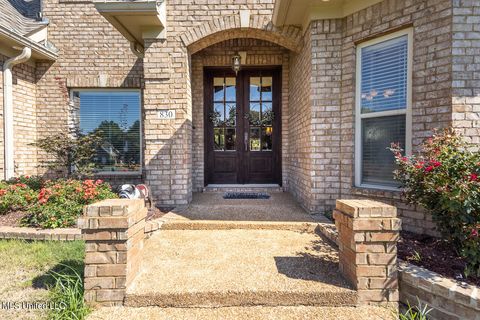
Pending
$585,000
4
bds
|
4
ba
|
0
sqft
|
built
2006
830 Slocum Point Cv W, Hernando, MS 38632
$-176
Cash flow
-1.6%
Cash-on-Cash Return
5.3%
Cap rate
0.7%
Rent to Value Ratio
Active
$315,000
4
bds
|
3
ba
|
0
sqft
|
built
1995
5525 Belmont Rd, Hernando, MS 38632
$-67
Cash flow
-1.1%
Cash-on-Cash Return
5.4%
Cap rate
0.7%
Rent to Value Ratio

Active
$189,900
3
bds
|
1
ba
|
0
sqft
|
built
1961
1597 Vicksburg Dr, Southaven, MS 38671
$56
Cash flow
1.5%
Cash-on-Cash Return
6.0%
Cap rate
0.8%
Rent to Value Ratio

Active
$319,000
4
bds
|
2
ba
|
0
sqft
|
built
2017
7497 Redberry Dr, Horn Lake, MS 38637
$-357
Cash flow
-5.8%
Cash-on-Cash Return
4.3%
Cap rate
0.6%
Rent to Value Ratio

Active
$215,000
3
bds
|
2
ba
|
0
sqft
|
built
1986
6285 Collinwood Rd, Horn Lake, MS 38637
$86
Cash flow
2.1%
Cash-on-Cash Return
6.2%
Cap rate
0.7%
Rent to Value Ratio

Active
$249,900
3
bds
|
2
ba
|
0
sqft
|
built
1982
747 Cumberland Cv, Southaven, MS 38671
$33
Cash flow
0.7%
Cash-on-Cash Return
5.8%
Cap rate
0.8%
Rent to Value Ratio

Pending
$310,000
3
bds
|
3
ba
|
0
sqft
|
built
2024
2561 Dela Dr, Southaven, MS 38672
$86
Cash flow
1.4%
Cash-on-Cash Return
6.0%
Cap rate
0.7%
Rent to Value Ratio

Active
$475,000
4
bds
|
4
ba
|
0
sqft
|
built
2022
13604 Live Oak Loop, Olive Branch, MS 38654
$-307
Cash flow
-3.4%
Cash-on-Cash Return
4.9%
Cap rate
0.7%
Rent to Value Ratio

Active
$410,000
5
bds
|
4
ba
|
0
sqft
|
built
1984
3590 Shady Oaks Dr, Olive Branch, MS 38654
$-248
Cash flow
-3.2%
Cash-on-Cash Return
5.0%
Cap rate
0.7%
Rent to Value Ratio
Active
$288,000
3
bds
|
2
ba
|
0
sqft
|
built
2002
41 Cross Creek Dr, Hernando, MS 38632
$27
Cash flow
0.5%
Cash-on-Cash Return
5.8%
Cap rate
0.8%
Rent to Value Ratio

Pending
$175,000
3
bds
|
2
ba
|
0
sqft
|
built
1984
6435 Knight Cv, Horn Lake, MS 38637
$83
Cash flow
2.5%
Cash-on-Cash Return
6.2%
Cap rate
0.8%
Rent to Value Ratio

Active
$400,000
4
bds
|
3
ba
|
0
sqft
|
built
2015
13525 Lapstone Ln, Olive Branch, MS 38654
$-133
Cash flow
-1.7%
Cash-on-Cash Return
5.3%
Cap rate
0.7%
Rent to Value Ratio

Active
$309,900
2
bds
|
2
ba
|
0
sqft
|
built
2008
8761 Parkview Oaks Cir, Olive Branch, MS 38654
$-370
Cash flow
-6.2%
Cash-on-Cash Return
4.2%
Cap rate
0.7%
Rent to Value Ratio
Active
$273,000
3
bds
|
2
ba
|
0
sqft
|
built
2024
7303 Farm Ridge Dr, Horn Lake, MS 38637
$89
Cash flow
1.7%
Cash-on-Cash Return
6.1%
Cap rate
0.8%
Rent to Value Ratio

Active
$448,000
4
bds
|
4
ba
|
0
sqft
|
built
2008
4788 Bon Jour Ln, Nesbit, MS 38651
$-390
Cash flow
-4.5%
Cash-on-Cash Return
4.6%
Cap rate
0.8%
Rent to Value Ratio

Active
$599,000
4
bds
|
4
ba
|
0
sqft
|
built
2006
4293 Trumpington Cv, Southaven, MS 38672
$-917
Cash flow
-8.0%
Cash-on-Cash Return
3.8%
Cap rate
0.5%
Rent to Value Ratio

Active
$410,000
4
bds
|
3
ba
|
0
sqft
|
built
2004
4896 Park North Dr, Olive Branch, MS 38654
$-436
Cash flow
-5.5%
Cash-on-Cash Return
4.4%
Cap rate
0.6%
Rent to Value Ratio

Active
$345,000
4
bds
|
2
ba
|
0
sqft
|
built
2020
4943 Margarette Cir W, Olive Branch, MS 38654
$-87
Cash flow
-1.3%
Cash-on-Cash Return
5.4%
Cap rate
0.7%
Rent to Value Ratio

Active
$385,000
4
bds
|
3
ba
|
0
sqft
|
built
2001
4253 Lakecrest Cv, Olive Branch, MS 38654
$-201
Cash flow
-2.7%
Cash-on-Cash Return
5.1%
Cap rate
0.7%
Rent to Value Ratio
Active
$475,000
4
bds
|
3
ba
|
0
sqft
|
built
2021
3186 Sarah Ln, Hernando, MS 38632
$-460
Cash flow
-5.1%
Cash-on-Cash Return
4.5%
Cap rate
0.7%
Rent to Value Ratio

Active
$240,000
3
bds
|
2
ba
|
0
sqft
|
built
2000
1664 Thomas St, Horn Lake, MS 38637
$-197
Cash flow
-4.3%
Cash-on-Cash Return
4.7%
Cap rate
0.7%
Rent to Value Ratio

Active
$435,000
4
bds
|
3
ba
|
0
sqft
|
built
2022
5640 Drew Glazer Dr, Olive Branch, MS 38654
$-142
Cash flow
-1.7%
Cash-on-Cash Return
5.3%
Cap rate
0.7%
Rent to Value Ratio