Mississippi Investment Properties for Sale
Browse homes for sale and investment properties in Mississippi. Refine your search by price, property type, or more.
Best cash flowing properties in Mississippi

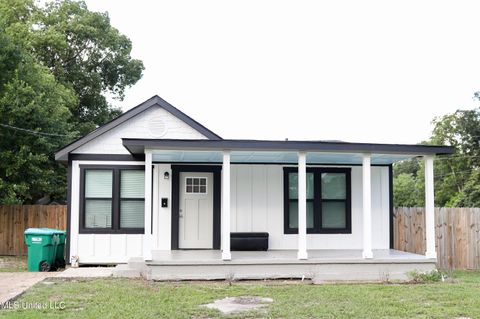
Active
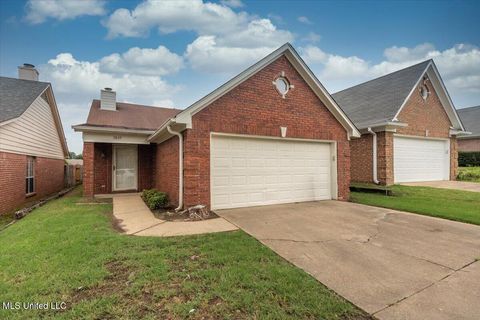
$55,000
3
bds
|
1
ba
|
0
sqft
|
built
1960
1557 Maria Dr, Jackson, MS 39204
$672
Cash flow
14.2%
Cash-on-Cash Return
14.7%
Cap rate
2.0%
Rent to Value Ratio

Active
$90,000
3
bds
|
2
ba
|
0
sqft
|
built
1940
1080 Alta Vista Blvd, Jackson, MS 39209
$394
Cash flow
22.8%
Cash-on-Cash Return
10.9%
Cap rate
1.6%
Rent to Value Ratio
2,679 out of 4,559 properties for sale in Mississippi
Limited Results Shown
Create a free account, or log in to reveal all property listings and enjoy the complete experience.

Active
$429,000
2
bds
|
3
ba
|
0
sqft
|
built
1974
420 Saint Andrews Dr, Jackson, MS 39211
$-808
Cash flow
-9.8%
Cash-on-Cash Return
3.4%
Cap rate
0.7%
Rent to Value Ratio

Active
$269,000
4
bds
|
2
ba
|
0
sqft
|
built
1970
2285 Harkness Ct, Biloxi, MS 39532
$279
Cash flow
5.4%
Cash-on-Cash Return
6.9%
Cap rate
0.9%
Rent to Value Ratio

Active
$260,000
4
bds
|
2
ba
|
0
sqft
|
built
2006
9941 Hamakua St, Diamondhead, MS 39525
$-99
Cash flow
-2.0%
Cash-on-Cash Return
5.2%
Cap rate
0.8%
Rent to Value Ratio

Active
$750,000
5
bds
|
5
ba
|
0
sqft
|
built
2016
1088 Red Banks Rd S, Byhalia, MS 38611
$-1,582
Cash flow
-11.0%
Cash-on-Cash Return
3.1%
Cap rate
0.4%
Rent to Value Ratio

Active
$220,000
3
bds
|
2
ba
|
0
sqft
|
built
2001
5793 Steffani Dr, Southaven, MS 38671
$60
Cash flow
1.4%
Cash-on-Cash Return
6.0%
Cap rate
0.7%
Rent to Value Ratio

Active
$442,000
5
bds
|
3
ba
|
0
sqft
|
built
2020
3545 Bailey Ln, Southaven, MS 38672
$-214
Cash flow
-2.5%
Cash-on-Cash Return
5.1%
Cap rate
0.7%
Rent to Value Ratio
Active
$179,000
2
bds
|
1
ba
|
0
sqft
|
built
1940
2200 19th Ave, Gulfport, MS 39501
$170
Cash flow
5.0%
Cash-on-Cash Return
6.8%
Cap rate
0.9%
Rent to Value Ratio

Active
$350,000
4
bds
|
3
ba
|
0
sqft
|
built
1985
7465 Davidson Rd, Olive Branch, MS 38654
$-201
Cash flow
-3.0%
Cash-on-Cash Return
5.0%
Cap rate
0.7%
Rent to Value Ratio

Active
$395,000
4
bds
|
3
ba
|
0
sqft
|
built
2019
123 Freeland Ln, Clinton, MS 39056
$-524
Cash flow
-6.9%
Cash-on-Cash Return
4.1%
Cap rate
0.7%
Rent to Value Ratio

Active
$292,000
3
bds
|
2
ba
|
0
sqft
|
built
1987
6324 Country Ln, Moss Point, MS 39562
$-235
Cash flow
-4.2%
Cash-on-Cash Return
4.7%
Cap rate
0.6%
Rent to Value Ratio
Active
$529,900
4
bds
|
3
ba
|
0
sqft
|
built
2011
13076 Pine Vly, Biloxi, MS 39532
$-681
Cash flow
-6.7%
Cash-on-Cash Return
4.1%
Cap rate
0.6%
Rent to Value Ratio

Active
$450,000
4
bds
|
4
ba
|
0
sqft
|
built
2002
4872 Bobo Pl, Olive Branch, MS 38654
$-419
Cash flow
-4.9%
Cash-on-Cash Return
4.6%
Cap rate
0.6%
Rent to Value Ratio
Active
$259,000
3
bds
|
2
ba
|
0
sqft
|
built
1965
4620 W Cheryl Dr, Jackson, MS 39211
$182
Cash flow
3.7%
Cash-on-Cash Return
6.5%
Cap rate
1.0%
Rent to Value Ratio

Active
$649,000
4
bds
|
3
ba
|
0
sqft
|
built
2007
129 Marcie Dr, Long Beach, MS 39560
$-1,389
Cash flow
-11.2%
Cash-on-Cash Return
3.1%
Cap rate
0.4%
Rent to Value Ratio

Active
$133,500
3
bds
|
2
ba
|
0
sqft
|
built
1972
3607 Pentagon Dr, Pascagoula, MS 39581
$394
Cash flow
15.4%
Cash-on-Cash Return
9.2%
Cap rate
1.2%
Rent to Value Ratio
Active
$254,900
3
bds
|
2
ba
|
0
sqft
|
built
2009
15920 Hardwood Pl, Biloxi, MS 39532
$-23
Cash flow
-0.5%
Cash-on-Cash Return
5.6%
Cap rate
0.8%
Rent to Value Ratio
Active
$239,900
3
bds
|
2
ba
|
0
sqft
|
built
1995
7827 Chesterfield Dr S, Southaven, MS 38671
$-12
Cash flow
-0.3%
Cash-on-Cash Return
5.6%
Cap rate
0.8%
Rent to Value Ratio

Active
$171,500
4
bds
|
2
ba
|
0
sqft
|
built
1969
329 Lionel Rd, Pearl, MS 39208
$316
Cash flow
9.6%
Cash-on-Cash Return
7.9%
Cap rate
1.0%
Rent to Value Ratio

Active
$310,000
2
bds
|
2
ba
|
0
sqft
|
built
1995
908 Hackberry Ln, Canton, MS 39046
$-57
Cash flow
-1.0%
Cash-on-Cash Return
5.5%
Cap rate
0.7%
Rent to Value Ratio
Active
$234,000
3
bds
|
3
ba
|
0
sqft
|
built
2021
2205 Magazine St, Ocean Springs, MS 39564
$30
Cash flow
0.7%
Cash-on-Cash Return
5.8%
Cap rate
0.9%
Rent to Value Ratio

Active
$499,000
4
bds
|
3
ba
|
0
sqft
|
built
2023
12452 Preservation Dr, Gulfport, MS 39503
$-909
Cash flow
-9.5%
Cash-on-Cash Return
3.5%
Cap rate
0.6%
Rent to Value Ratio
Active
$305,900
4
bds
|
2
ba
|
0
sqft
|
built
2002
13288 Roxbury Pl, Gulfport, MS 39503
$185
Cash flow
3.2%
Cash-on-Cash Return
6.4%
Cap rate
0.8%
Rent to Value Ratio

Active
$110,000
3
bds
|
1
ba
|
0
sqft
|
built
1958
333 Reed Ave, Jackson, MS 39206
$322
Cash flow
15.3%
Cash-on-Cash Return
9.2%
Cap rate
1.3%
Rent to Value Ratio
Active
$90,000
3
bds
|
2
ba
|
0
sqft
|
built
1940
1080 Alta Vista Blvd, Jackson, MS 39209
$394
Cash flow
22.8%
Cash-on-Cash Return
10.9%
Cap rate
1.6%
Rent to Value Ratio
Active
$169,900
3
bds
|
2
ba
|
0
sqft
|
built
1968
310 Polly Ave, Mendenhall, MS 39114
$230
Cash flow
7.1%
Cash-on-Cash Return
7.3%
Cap rate
0.9%
Rent to Value Ratio

Active
$149,900
2
bds
|
2
ba
|
0
sqft
|
built
1940
1607 Resca De La Palma St, Pascagoula, MS 39567
$-200
Cash flow
-7.0%
Cash-on-Cash Return
4.1%
Cap rate
0.6%
Rent to Value Ratio
Active
$1,300,000
6
bds
|
5
ba
|
0
sqft
|
built
1998
11080 Road 231, Picayune, MS 39466
$-4,643
Cash flow
-18.6%
Cash-on-Cash Return
1.4%
Cap rate
0.2%
Rent to Value Ratio

Active
$975,000
3
bds
|
4
ba
|
0
sqft
|
built
2022
316 Leonhard Ave, Bay Saint Louis, MS 39520
$-2,312
Cash flow
-12.4%
Cash-on-Cash Return
2.8%
Cap rate
0.4%
Rent to Value Ratio
Active
$339,900
2
bds
|
2
ba
|
0
sqft
|
built
1978
246 Eastbrooke St, Jackson, MS 39216
$-911
Cash flow
-14.0%
Cash-on-Cash Return
2.5%
Cap rate
0.6%
Rent to Value Ratio
Active
$275,000
4
bds
|
2
ba
|
0
sqft
|
built
2000
25541 Broad Ridge Dr, Picayune, MS 39466
$374
Cash flow
7.1%
Cash-on-Cash Return
7.3%
Cap rate
0.9%
Rent to Value Ratio
Active
$55,000
3
bds
|
1
ba
|
0
sqft
|
built
1960
1557 Maria Dr, Jackson, MS 39204
$672
Cash flow
14.2%
Cash-on-Cash Return
14.7%
Cap rate
2.0%
Rent to Value Ratio

Active
$360,000
3
bds
|
2
ba
|
0
sqft
|
built
2002
90 Vance Cv, Byhalia, MS 38611
$-196
Cash flow
-2.8%
Cash-on-Cash Return
5.0%
Cap rate
0.6%
Rent to Value Ratio
Active
$439,900
5
bds
|
3
ba
|
0
sqft
|
built
2010
1406 Koby Ln, Hernando, MS 38632
$-458
Cash flow
-5.4%
Cash-on-Cash Return
4.4%
Cap rate
0.6%
Rent to Value Ratio

Active
$299,900
3
bds
|
2
ba
|
0
sqft
|
built
1998
6507 Shoshonee Dr, Ocean Springs, MS 39564
$-175
Cash flow
-3.0%
Cash-on-Cash Return
5.0%
Cap rate
0.7%
Rent to Value Ratio

Active
$245,000
4
bds
|
4
ba
|
0
sqft
|
built
1976
32 Raintree Pl, Jackson, MS 39211
$314
Cash flow
6.7%
Cash-on-Cash Return
7.2%
Cap rate
1.1%
Rent to Value Ratio
Active
$355,000
3
bds
|
2
ba
|
0
sqft
|
built
1977
109 Palm Ave, Pass Christian, MS 39571
$-352
Cash flow
-5.2%
Cash-on-Cash Return
4.5%
Cap rate
0.6%
Rent to Value Ratio
Active
$365,000
3
bds
|
3
ba
|
0
sqft
|
built
2021
102 Shore View Cv, Madison, MS 39110
$-64
Cash flow
-0.9%
Cash-on-Cash Return
5.5%
Cap rate
0.8%
Rent to Value Ratio
Active
$136,000
3
bds
|
1
ba
|
0
sqft
|
built
1941
2411 14th St, Pascagoula, MS 39567
$172
Cash flow
6.6%
Cash-on-Cash Return
7.2%
Cap rate
1.0%
Rent to Value Ratio

Active
$249,000
3
bds
|
2
ba
|
0
sqft
|
built
1972
26060 Highway 51, Crystal Springs, MS 39059
$81
Cash flow
1.7%
Cash-on-Cash Return
6.1%
Cap rate
0.8%
Rent to Value Ratio

Active
$458,900
4
bds
|
3
ba
|
0
sqft
|
built
2004
7672 Rigmoore Pt N, Olive Branch, MS 38654
$-442
Cash flow
-5.0%
Cash-on-Cash Return
4.5%
Cap rate
0.6%
Rent to Value Ratio