Mississippi Investment Properties for Sale
Browse homes for sale and investment properties in Mississippi. Refine your search by price, property type, or more.
Best cash flowing properties in Mississippi

Active
$46,900
3
bds
|
2
ba
|
0
sqft
|
built
1955
751 Dorgan St, Jackson, MS 39204
$749
Cash flow
18.6%
Cash-on-Cash Return
19.2%
Cap rate
2.6%
Rent to Value Ratio
Active
$109,999
2
bds
|
2
ba
|
0
sqft
|
built
1984
847 Woodbury Rd, Jackson, MS 39206
$425
Cash flow
20.2%
Cash-on-Cash Return
10.3%
Cap rate
1.5%
Rent to Value Ratio
2,690 out of 4,572 properties for sale in Mississippi
Limited Results Shown
Create a free account, or log in to reveal all property listings and enjoy the complete experience.

Active
$389,900
4
bds
|
4
ba
|
0
sqft
|
built
1988
4625 Wealthy Cv, Horn Lake, MS 38637
$-394
Cash flow
-5.3%
Cash-on-Cash Return
4.5%
Cap rate
0.6%
Rent to Value Ratio
Active
$345,000
4
bds
|
3
ba
|
0
sqft
|
built
1966
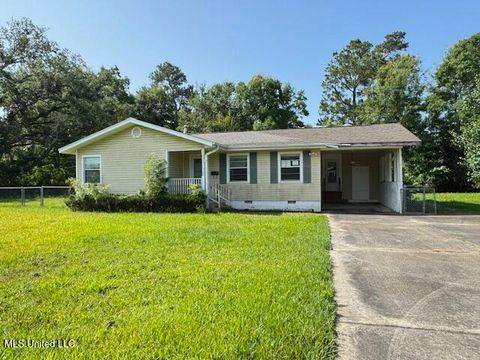
109 Boggs Cir, Long Beach, MS 39560
$-94
Cash flow
-1.4%
Cash-on-Cash Return
5.4%
Cap rate
0.7%
Rent to Value Ratio
Active
$46,900
3
bds
|
2
ba
|
0
sqft
|
built
1955
751 Dorgan St, Jackson, MS 39204
$749
Cash flow
18.6%
Cash-on-Cash Return
19.2%
Cap rate
2.6%
Rent to Value Ratio
Active
$499,900
5
bds
|
5
ba
|
0
sqft
|
built
1996
211 Monterey Dr, Clinton, MS 39056
$-798
Cash flow
-8.3%
Cash-on-Cash Return
3.8%
Cap rate
0.5%
Rent to Value Ratio
Active
$237,500
2
bds
|
2
ba
|
0
sqft
|
built
1998
814 Lynwood Ln, Pearl, MS 39208
$56
Cash flow
1.2%
Cash-on-Cash Return
6.0%
Cap rate
0.8%
Rent to Value Ratio

Active
$164,900
2
bds
|
2
ba
|
0
sqft
|
built
1967
1664 Beach Blvd, Biloxi, MS 39531
$-368
Cash flow
-11.6%
Cash-on-Cash Return
3.0%
Cap rate
0.8%
Rent to Value Ratio

Active
$389,000
5
bds
|
3
ba
|
0
sqft
|
built
1999
250 Sunnybrook Dr, Senatobia, MS 38668
$-236
Cash flow
-3.2%
Cash-on-Cash Return
5.0%
Cap rate
0.6%
Rent to Value Ratio

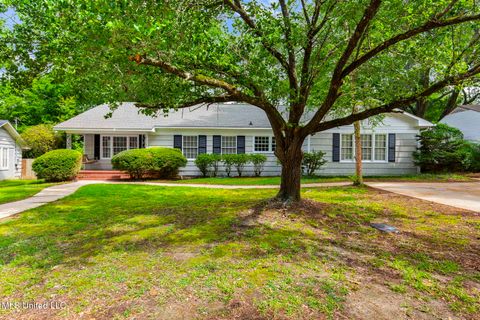
Active
$135,000
4
bds
|
2
ba
|
0
sqft
|
built
1956
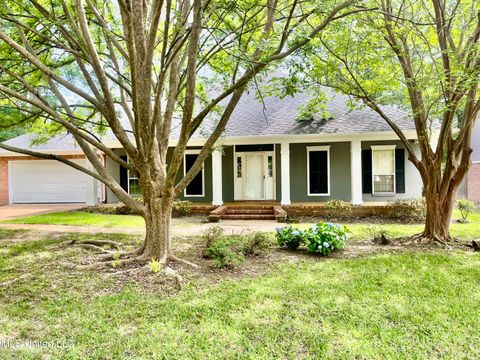
5448 Crepe Myrtle Dr, Jackson, MS 39206
$399
Cash flow
15.4%
Cash-on-Cash Return
9.2%
Cap rate
1.2%
Rent to Value Ratio
Active
$240,900
3
bds
|
2
ba
|
0
sqft
|
built
1993
3057 Windwood Cir, Flowood, MS 39232
$359
Cash flow
7.8%
Cash-on-Cash Return
7.5%
Cap rate
1.0%
Rent to Value Ratio
Active
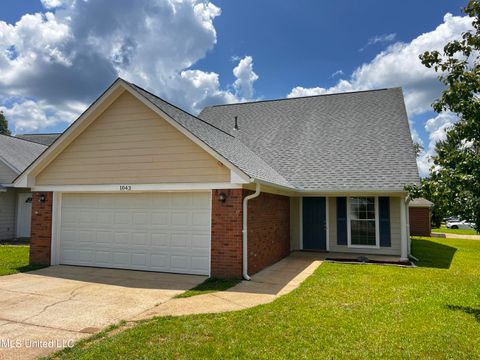
$228,000
3
bds
|
2
ba
|
0
sqft
|
built
1999
1043 Spanish Oak Blvd, Florence, MS 39073
$-100
Cash flow
-2.3%
Cash-on-Cash Return
5.2%
Cap rate
0.7%
Rent to Value Ratio

Active
$209,000
3
bds
|
3
ba
|
0
sqft
|
built
1989
2529 Windward Dr, Gautier, MS 39553
$2
Cash flow
0.0%
Cash-on-Cash Return
5.7%
Cap rate
0.8%
Rent to Value Ratio

Active
$281,900
3
bds
|
3
ba
|
0
sqft
|
built
2001
7669 Meadow Ridge Ln, Olive Branch, MS 38654
$57
Cash flow
1.1%
Cash-on-Cash Return
5.9%
Cap rate
0.8%
Rent to Value Ratio
Active
$198,000
2
bds
|
2
ba
|
0
sqft
|
built
2004
1104 2nd St SE, Magee, MS 39111
$125
Cash flow
3.3%
Cash-on-Cash Return
6.4%
Cap rate
0.9%
Rent to Value Ratio
Active
$199,000
4
bds
|
2
ba
|
0
sqft
|
built
1981
1906 Swayze St, Yazoo City, MS 39194
$262
Cash flow
6.9%
Cash-on-Cash Return
7.3%
Cap rate
1.0%
Rent to Value Ratio
Active
$369,500
4
bds
|
2
ba
|
0
sqft
|
built
2008
13105 Little Bluff Dr, Vancleave, MS 39565
$-105
Cash flow
-1.5%
Cash-on-Cash Return
5.3%
Cap rate
0.7%
Rent to Value Ratio

Active
$317,500
3
bds
|
3
ba
|
0
sqft
|
built
1991
2500 Tearose Ln, Moss Point, MS 39562
$-310
Cash flow
-5.1%
Cash-on-Cash Return
4.5%
Cap rate
0.6%
Rent to Value Ratio
Active
$250,000
4
bds
|
2
ba
|
0
sqft
|
built
1980
488 White Ash Dr, Southaven, MS 38671
$56
Cash flow
1.2%
Cash-on-Cash Return
5.9%
Cap rate
0.8%
Rent to Value Ratio
Active
$542,000
3
bds
|
3
ba
|
0
sqft
|
built
2021
605 Magnolia St, Long Beach, MS 39560
$-799
Cash flow
-7.7%
Cash-on-Cash Return
3.9%
Cap rate
0.6%
Rent to Value Ratio

Active
$254,900
3
bds
|
2
ba
|
0
sqft
|
built
1973
459 Jim Money Rd, Biloxi, MS 39531
$211
Cash flow
4.3%
Cash-on-Cash Return
6.7%
Cap rate
0.9%
Rent to Value Ratio
Active
$620,000
3
bds
|
3
ba
|
0
sqft
|
built
1984
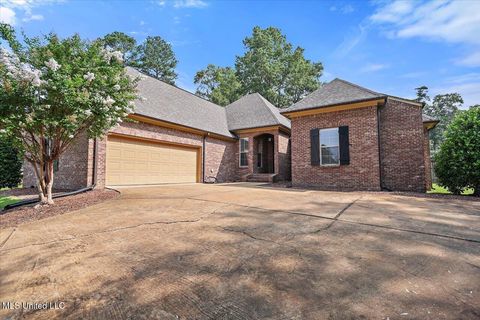
1899 Ratliff Rd, Raymond, MS 39154
$-1,165
Cash flow
-9.8%
Cash-on-Cash Return
3.4%
Cap rate
0.5%
Rent to Value Ratio

Active
$200,000
3
bds
|
2
ba
|
0
sqft
|
built
1968
810 Louis Wilson Dr, Brandon, MS 39042
$160
Cash flow
4.2%
Cash-on-Cash Return
6.6%
Cap rate
0.9%
Rent to Value Ratio
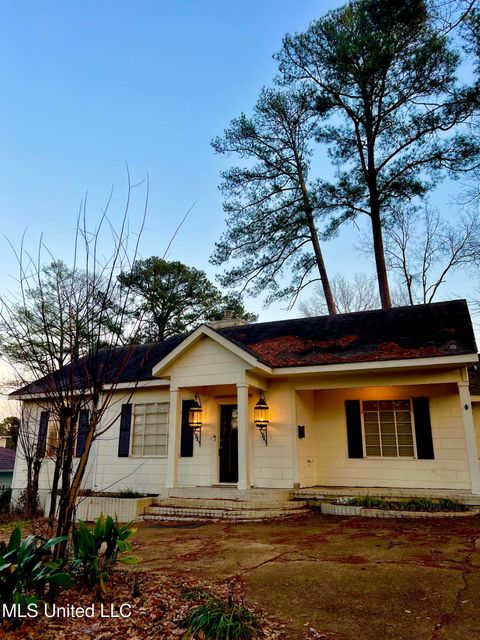
Active
$295,000
3
bds
|
3
ba
|
0
sqft
|
built
1951
3821 Montrose Cir, Jackson, MS 39216
$44
Cash flow
0.8%
Cash-on-Cash Return
5.9%
Cap rate
0.9%
Rent to Value Ratio

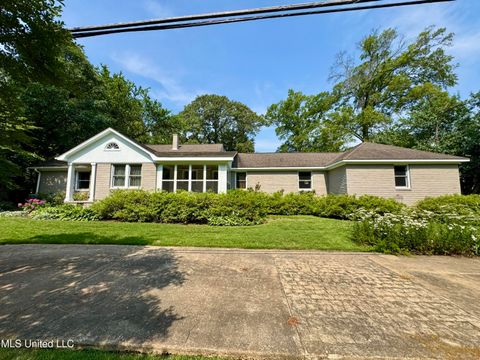
Active
$400,000
3
bds
|
2
ba
|
0
sqft
|
built
1961
4971 Church Rd, Nesbit, MS 38651
$-688
Cash flow
-9.0%
Cash-on-Cash Return
3.6%
Cap rate
0.5%
Rent to Value Ratio

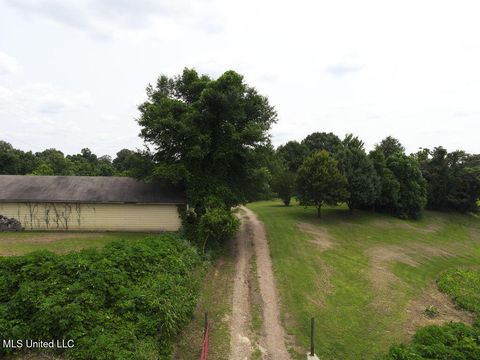
Active
$310,000
4
bds
|
2
ba
|
0
sqft
|
built
2023
8616 Hayes Dr, Southaven, MS 38672
$77
Cash flow
1.3%
Cash-on-Cash Return
6.0%
Cap rate
0.8%
Rent to Value Ratio

Active
$445,900
4
bds
|
3
ba
|
0
sqft
|
built
2021
8619 Williamson Dr, Olive Branch, MS 38654
$-353
Cash flow
-4.1%
Cash-on-Cash Return
4.7%
Cap rate
0.7%
Rent to Value Ratio
Active
$195,000
3
bds
|
2
ba
|
0
sqft
|
built
1950
3526 Old Canton Rd, Jackson, MS 39216
$-6
Cash flow
-0.2%
Cash-on-Cash Return
5.6%
Cap rate
0.9%
Rent to Value Ratio

Active
$259,999
3
bds
|
2
ba
|
0
sqft
|
built
1994
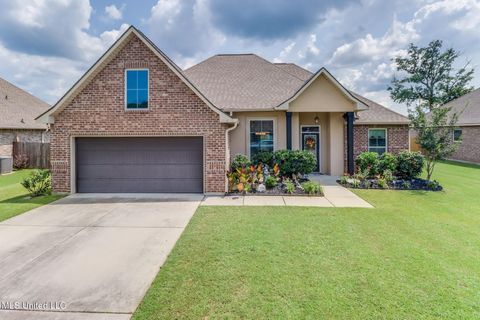
106 Ole Duke Dr, Brandon, MS 39042
$385
Cash flow
7.7%
Cash-on-Cash Return
7.5%
Cap rate
0.9%
Rent to Value Ratio

Active
$460,000
3
bds
|
3
ba
|
0
sqft
|
built
2007
2668 Beach Blvd, Biloxi, MS 39531
$-1,955
Cash flow
-22.2%
Cash-on-Cash Return
0.6%
Cap rate
0.5%
Rent to Value Ratio
Active
$385,000
3
bds
|
3
ba
|
0
sqft
|
built
1970
2293 Elm St, Hernando, MS 38632
$-24
Cash flow
-0.3%
Cash-on-Cash Return
5.6%
Cap rate
0.7%
Rent to Value Ratio

Active
$199,900
3
bds
|
2
ba
|
0
sqft
|
built
2001
2709 Robert Hiram Dr, Gautier, MS 39553
$24
Cash flow
0.6%
Cash-on-Cash Return
5.8%
Cap rate
0.9%
Rent to Value Ratio
Active
$220,000
2
bds
|
2
ba
|
0
sqft
|
built
1978
900 Old Benton Rd, Yazoo City, MS 39194
$335
Cash flow
7.9%
Cash-on-Cash Return
7.5%
Cap rate
0.9%
Rent to Value Ratio

Active
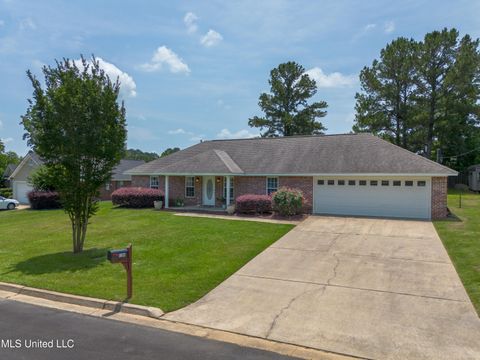
$255,900
3
bds
|
2
ba
|
0
sqft
|
built
1981
1012 Kern Ln, Crystal Springs, MS 39059
$209
Cash flow
4.3%
Cash-on-Cash Return
6.7%
Cap rate
0.9%
Rent to Value Ratio

Active
$375,000
5
bds
|
4
ba
|
0
sqft
|
built
2008
7427 Lauren Ln, Olive Branch, MS 38654
$-133
Cash flow
-1.9%
Cash-on-Cash Return
5.3%
Cap rate
0.7%
Rent to Value Ratio

Active
$245,000
4
bds
|
2
ba
|
0
sqft
|
built
1975
5039 Forest Hill Rd, Jackson, MS 39272
$387
Cash flow
8.2%
Cash-on-Cash Return
7.6%
Cap rate
1.0%
Rent to Value Ratio
Active
$134,900
2
bds
|
2
ba
|
0
sqft
|
built
1950
165 Canal St, Gulfport, MS 39507
$322
Cash flow
12.5%
Cash-on-Cash Return
8.5%
Cap rate
1.2%
Rent to Value Ratio

Active
$500,000
5
bds
|
3
ba
|
0
sqft
|
built
2021
2987 Rue Acadian Garden Dr, Biloxi, MS 39532
$-783
Cash flow
-8.2%
Cash-on-Cash Return
3.8%
Cap rate
0.6%
Rent to Value Ratio
Active
$109,999
2
bds
|
2
ba
|
0
sqft
|
built
1984
847 Woodbury Rd, Jackson, MS 39206
$425
Cash flow
20.2%
Cash-on-Cash Return
10.3%
Cap rate
1.5%
Rent to Value Ratio
Active
$464,000
4
bds
|
3
ba
|
0
sqft
|
built
2007
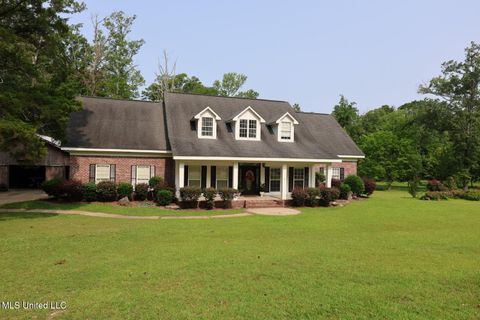
306 Canebreak Cv, Madison, MS 39110
$-502
Cash flow
-5.6%
Cash-on-Cash Return
4.4%
Cap rate
0.7%
Rent to Value Ratio
Active
$294,900
3
bds
|
2
ba
|
0
sqft
|
built
2017
2018 Pelican Cir, Long Beach, MS 39560
$-42
Cash flow
-0.7%
Cash-on-Cash Return
5.5%
Cap rate
0.7%
Rent to Value Ratio
Active
$579,900
5
bds
|
4
ba
|
0
sqft
|
built
2006
2230 Wildwood Dr, Florence, MS 39073
$-480
Cash flow
-4.3%
Cash-on-Cash Return
4.7%
Cap rate
0.6%
Rent to Value Ratio