Mississippi Investment Properties for Sale
Browse homes for sale and investment properties in Mississippi. Refine your search by price, property type, or more.
Best cash flowing properties in Mississippi
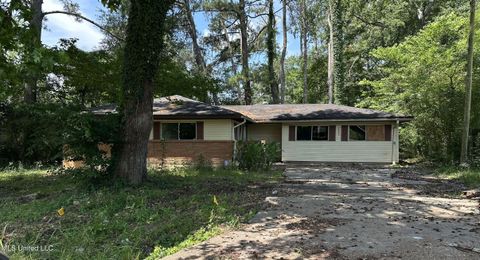
Pending
$20,000
3
bds
|
2
ba
|
0
sqft
|
built
1963
3033 Grey Blvd, Jackson, MS 39212
$796
Cash flow
46.4%
Cash-on-Cash Return
47.8%
Cap rate
6.5%
Rent to Value Ratio

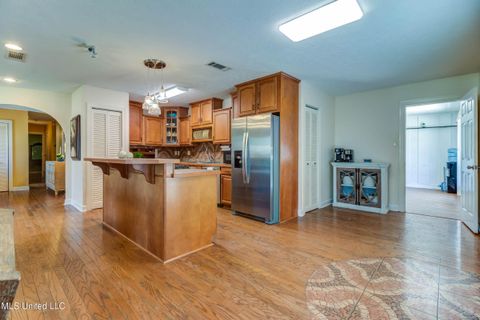
Active
$46,900
3
bds
|
2
ba
|
0
sqft
|
built
1955
751 Dorgan St, Jackson, MS 39204
$749
Cash flow
18.6%
Cash-on-Cash Return
19.2%
Cap rate
2.6%
Rent to Value Ratio
2,888 out of 4,216 properties for sale in Mississippi
Limited Results Shown
Create a free account, or log in to reveal all property listings and enjoy the complete experience.
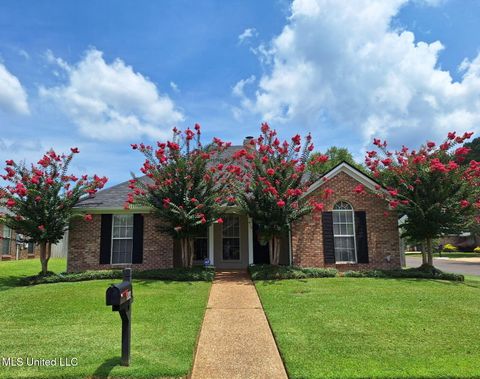
Active
$345,000
4
bds
|
3
ba
|
0
sqft
|
built
1966
109 Boggs Cir, Long Beach, MS 39560
$-94
Cash flow
-1.4%
Cash-on-Cash Return
5.4%
Cap rate
0.7%
Rent to Value Ratio

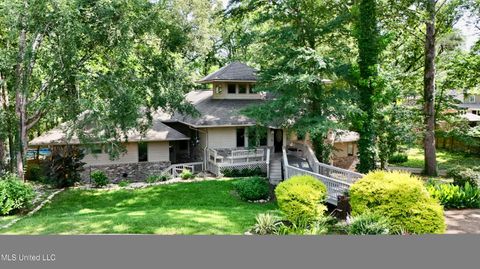
Active
$164,900
2
bds
|
2
ba
|
0
sqft
|
built
1967
1664 Beach Blvd, Biloxi, MS 39531
$-368
Cash flow
-11.6%
Cash-on-Cash Return
3.0%
Cap rate
0.8%
Rent to Value Ratio

Active
$267,500
3
bds
|
2
ba
|
0
sqft
|
built
2003
13360 Greenwich Cv, Gulfport, MS 39503
$114
Cash flow
2.2%
Cash-on-Cash Return
6.2%
Cap rate
0.8%
Rent to Value Ratio
Active
$46,900
3
bds
|
2
ba
|
0
sqft
|
built
1955
751 Dorgan St, Jackson, MS 39204
$749
Cash flow
18.6%
Cash-on-Cash Return
19.2%
Cap rate
2.6%
Rent to Value Ratio
Active
$237,500
2
bds
|
2
ba
|
0
sqft
|
built
1998
814 Lynwood Ln, Pearl, MS 39208
$56
Cash flow
1.2%
Cash-on-Cash Return
6.0%
Cap rate
0.8%
Rent to Value Ratio
Active
$499,900
5
bds
|
5
ba
|
0
sqft
|
built
1996
211 Monterey Dr, Clinton, MS 39056
$-798
Cash flow
-8.3%
Cash-on-Cash Return
3.8%
Cap rate
0.5%
Rent to Value Ratio

Active
$536,999
4
bds
|
3
ba
|
0
sqft
|
built
2023
221 Lost Oak Ln, Brandon, MS 39047
$-413
Cash flow
-4.0%
Cash-on-Cash Return
4.8%
Cap rate
0.7%
Rent to Value Ratio

Active
$389,900
4
bds
|
4
ba
|
0
sqft
|
built
1988
4625 Wealthy Cv, Horn Lake, MS 38637
$-394
Cash flow
-5.3%
Cash-on-Cash Return
4.5%
Cap rate
0.6%
Rent to Value Ratio
Active
$199,000
4
bds
|
2
ba
|
0
sqft
|
built
1981
1906 Swayze St, Yazoo City, MS 39194
$262
Cash flow
6.9%
Cash-on-Cash Return
7.3%
Cap rate
1.0%
Rent to Value Ratio

Active
$254,900
3
bds
|
2
ba
|
0
sqft
|
built
1973
459 Jim Money Rd, Biloxi, MS 39531
$211
Cash flow
4.3%
Cash-on-Cash Return
6.7%
Cap rate
0.9%
Rent to Value Ratio
Active
$480,000
4
bds
|
3
ba
|
0
sqft
|
built
2022
284 Fairview Trl, Byhalia, MS 38611
$19
Cash flow
0.2%
Cash-on-Cash Return
5.7%
Cap rate
0.8%
Rent to Value Ratio
Active
$542,000
3
bds
|
3
ba
|
0
sqft
|
built
2021
605 Magnolia St, Long Beach, MS 39560
$-799
Cash flow
-7.7%
Cash-on-Cash Return
3.9%
Cap rate
0.6%
Rent to Value Ratio
Active
$198,000
2
bds
|
2
ba
|
0
sqft
|
built
2004
1104 2nd St SE, Magee, MS 39111
$125
Cash flow
3.3%
Cash-on-Cash Return
6.4%
Cap rate
0.9%
Rent to Value Ratio

Active
$317,500
3
bds
|
3
ba
|
0
sqft
|
built
1991
2500 Tearose Ln, Moss Point, MS 39562
$-310
Cash flow
-5.1%
Cash-on-Cash Return
4.5%
Cap rate
0.6%
Rent to Value Ratio
Active
$369,500
4
bds
|
2
ba
|
0
sqft
|
built
2008
13105 Little Bluff Dr, Vancleave, MS 39565
$-105
Cash flow
-1.5%
Cash-on-Cash Return
5.3%
Cap rate
0.7%
Rent to Value Ratio
Active
$250,000
4
bds
|
2
ba
|
0
sqft
|
built
1980
488 White Ash Dr, Southaven, MS 38671
$56
Cash flow
1.2%
Cash-on-Cash Return
5.9%
Cap rate
0.8%
Rent to Value Ratio

Active
$599,000
4
bds
|
4
ba
|
0
sqft
|
built
2006
7446 Lazy Acres Rd, Pass Christian, MS 39571
$-1,020
Cash flow
-8.9%
Cash-on-Cash Return
3.6%
Cap rate
0.5%
Rent to Value Ratio
Active
$134,900
2
bds
|
1
ba
|
0
sqft
|
built
2008
9726 Limu Pl, Diamondhead, MS 39525
$131
Cash flow
5.1%
Cash-on-Cash Return
6.8%
Cap rate
1.0%
Rent to Value Ratio

Active
$247,000
3
bds
|
2
ba
|
0
sqft
|
built
1999
4141 Shadow Glen Dr, Horn Lake, MS 38637
$-27
Cash flow
-0.6%
Cash-on-Cash Return
5.5%
Cap rate
0.7%
Rent to Value Ratio
Pending
$349,500
4
bds
|
2
ba
|
0
sqft
|
built
2019
12856 Jackson Lee, Ocean Springs, MS 39564
$-86
Cash flow
-1.3%
Cash-on-Cash Return
5.4%
Cap rate
0.7%
Rent to Value Ratio
Pending
$246,500
3
bds
|
2
ba
|
0
sqft
|
built
2013
169 Beechwood Cir, Pearl, MS 39208
$27
Cash flow
0.6%
Cash-on-Cash Return
5.8%
Cap rate
0.8%
Rent to Value Ratio

Active
$362,000
3
bds
|
2
ba
|
0
sqft
|
built
1999
3 Holly Ct, Pearl, MS 39208
$-61
Cash flow
-0.9%
Cash-on-Cash Return
5.5%
Cap rate
0.8%
Rent to Value Ratio
Active
$225,000
3
bds
|
2
ba
|
0
sqft
|
built
1982
23601 Hinton Rd, Lucedale, MS 39452
$32
Cash flow
0.7%
Cash-on-Cash Return
5.9%
Cap rate
0.7%
Rent to Value Ratio
Active
$379,000
4
bds
|
2
ba
|
0
sqft
|
built
1999
720 Esplanade Dr, Ridgeland, MS 39157
$-180
Cash flow
-2.5%
Cash-on-Cash Return
5.1%
Cap rate
0.7%
Rent to Value Ratio
Pending
$342,000
5
bds
|
3
ba
|
0
sqft
|
built
2005
4368 Bloombury St, Southaven, MS 38672
$-158
Cash flow
-2.4%
Cash-on-Cash Return
5.1%
Cap rate
0.8%
Rent to Value Ratio

Active
$212,000
3
bds
|
2
ba
|
0
sqft
|
built
1994
9404 Meadowlark Ave, Ocean Springs, MS 39564
$42
Cash flow
1.0%
Cash-on-Cash Return
5.9%
Cap rate
0.8%
Rent to Value Ratio

Active
$445,900
4
bds
|
3
ba
|
0
sqft
|
built
2021
8619 Williamson Dr, Olive Branch, MS 38654
$-353
Cash flow
-4.1%
Cash-on-Cash Return
4.7%
Cap rate
0.7%
Rent to Value Ratio

Active
$460,000
3
bds
|
3
ba
|
0
sqft
|
built
2007
2668 Beach Blvd, Biloxi, MS 39531
$-1,955
Cash flow
-22.2%
Cash-on-Cash Return
0.6%
Cap rate
0.5%
Rent to Value Ratio

Active
$400,000
3
bds
|
2
ba
|
0
sqft
|
built
1961
4971 Church Rd, Nesbit, MS 38651
$-688
Cash flow
-9.0%
Cash-on-Cash Return
3.6%
Cap rate
0.5%
Rent to Value Ratio

Active
$310,000
4
bds
|
2
ba
|
0
sqft
|
built
2023
8616 Hayes Dr, Southaven, MS 38672
$77
Cash flow
1.3%
Cash-on-Cash Return
6.0%
Cap rate
0.8%
Rent to Value Ratio
Active
$370,000
3
bds
|
3
ba
|
0
sqft
|
built
1970
2293 Elm St, Hernando, MS 38632
$47
Cash flow
0.7%
Cash-on-Cash Return
5.8%
Cap rate
0.8%
Rent to Value Ratio
Active
$195,000
3
bds
|
2
ba
|
0
sqft
|
built
1950
3526 Old Canton Rd, Jackson, MS 39216
$-6
Cash flow
-0.2%
Cash-on-Cash Return
5.6%
Cap rate
0.9%
Rent to Value Ratio

Active
$259,999
3
bds
|
2
ba
|
0
sqft
|
built
1994
106 Ole Duke Dr, Brandon, MS 39042
$385
Cash flow
7.7%
Cash-on-Cash Return
7.5%
Cap rate
0.9%
Rent to Value Ratio

Active
$245,000
4
bds
|
2
ba
|
0
sqft
|
built
1975
5039 Forest Hill Rd, Jackson, MS 39272
$387
Cash flow
8.2%
Cash-on-Cash Return
7.6%
Cap rate
1.0%
Rent to Value Ratio

Active
$255,900
3
bds
|
2
ba
|
0
sqft
|
built
1981
1012 Kern Ln, Crystal Springs, MS 39059
$209
Cash flow
4.3%
Cash-on-Cash Return
6.7%
Cap rate
0.9%
Rent to Value Ratio

Active
$375,000
5
bds
|
4
ba
|
0
sqft
|
built
2008
7427 Lauren Ln, Olive Branch, MS 38654
$-133
Cash flow
-1.9%
Cash-on-Cash Return
5.3%
Cap rate
0.7%
Rent to Value Ratio
Active
$220,000
2
bds
|
2
ba
|
0
sqft
|
built
1978
900 Old Benton Rd, Yazoo City, MS 39194
$335
Cash flow
7.9%
Cash-on-Cash Return
7.5%
Cap rate
0.9%
Rent to Value Ratio
Active
$134,900
2
bds
|
2
ba
|
0
sqft
|
built
1950
165 Canal St, Gulfport, MS 39507
$322
Cash flow
12.5%
Cash-on-Cash Return
8.5%
Cap rate
1.2%
Rent to Value Ratio
Pending
$20,000
3
bds
|
2
ba
|
0
sqft
|
built
1963
3033 Grey Blvd, Jackson, MS 39212
$796
Cash flow
46.4%
Cash-on-Cash Return
47.8%
Cap rate
6.5%
Rent to Value Ratio

Active
$199,900
3
bds
|
2
ba
|
0
sqft
|
built
2001
2709 Robert Hiram Dr, Gautier, MS 39553
$24
Cash flow
0.6%
Cash-on-Cash Return
5.8%
Cap rate
0.9%
Rent to Value Ratio