Mississippi Investment Properties for Sale
Browse homes for sale and investment properties in Mississippi. Refine your search by price, property type, or more.
Best cash flowing properties in Mississippi
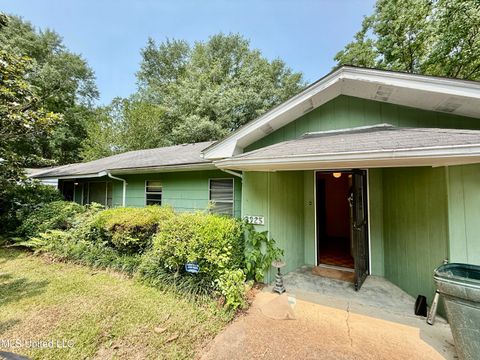
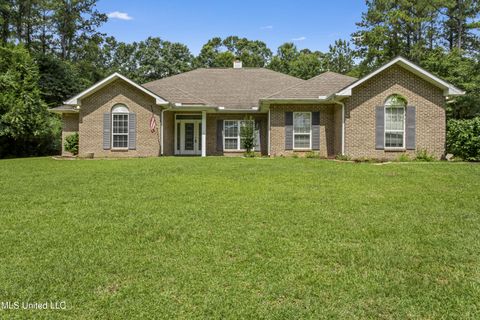
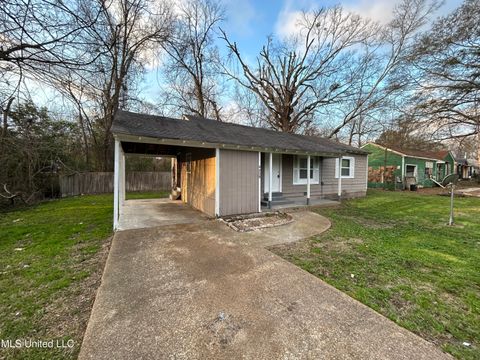
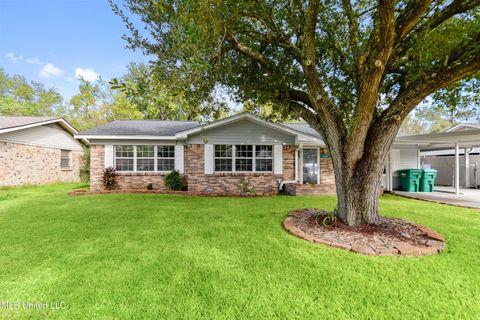
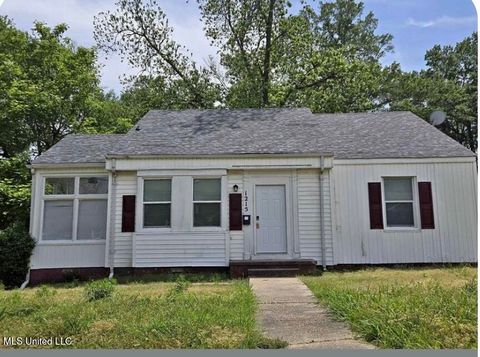
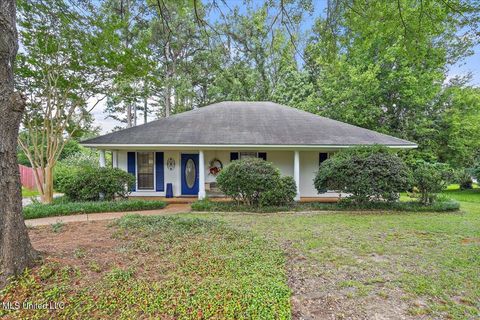
Active
$49,900
3
bds
|
2
ba
|
0
sqft
|
built
1950
3925 Garland Ave, Jackson, MS 39212
$966
Cash flow
22.6%
Cash-on-Cash Return
23.2%
Cap rate
2.8%
Rent to Value Ratio
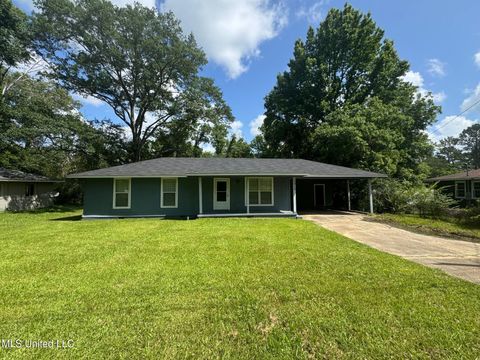
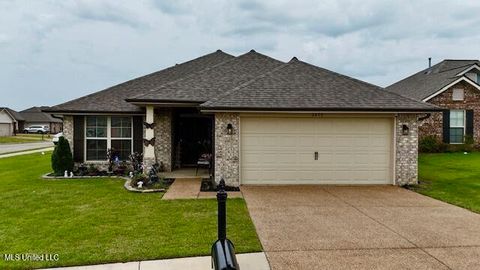
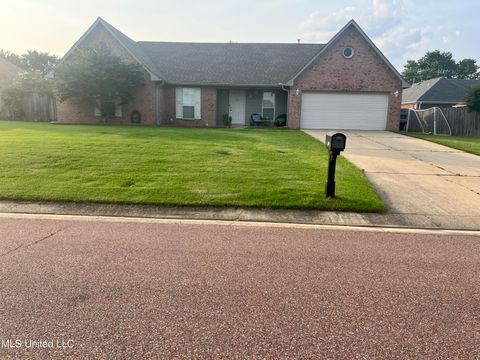
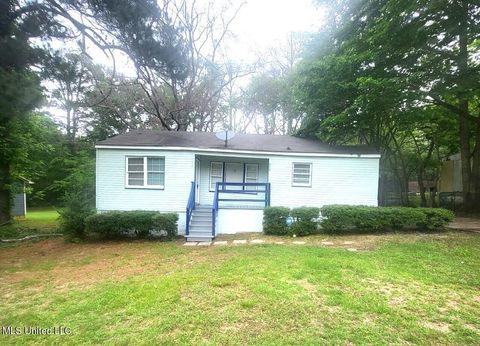
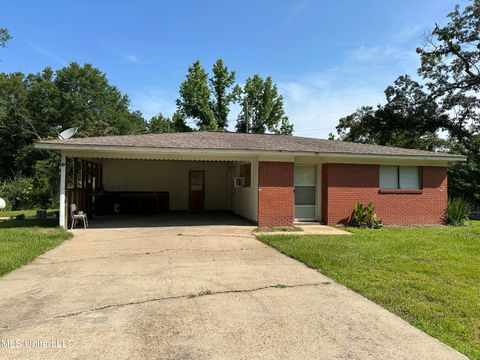
Active
$74,900
3
bds
|
2
ba
|
0
sqft
|
built
1989
1010 Deryll St, Jackson, MS 39212
$803
Cash flow
12.5%
Cash-on-Cash Return
12.9%
Cap rate
1.7%
Rent to Value Ratio
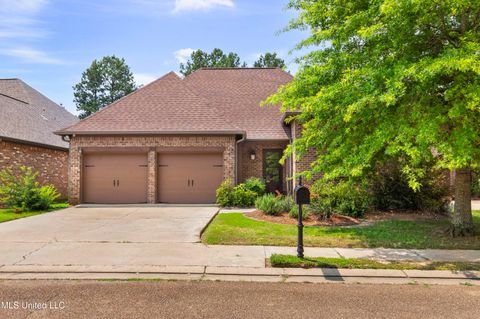
2,899 out of 4,231 properties for sale in Mississippi
Limited Results Shown
Create a free account, or log in to reveal all property listings and enjoy the complete experience.
Active
$74,900
3
bds
|
2
ba
|
0
sqft
|
built
1989
1010 Deryll St, Jackson, MS 39212
$803
Cash flow
12.5%
Cash-on-Cash Return
12.9%
Cap rate
1.7%
Rent to Value Ratio
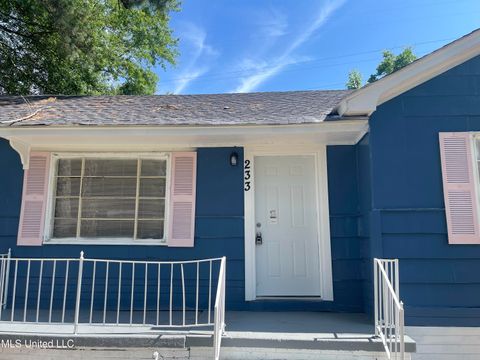
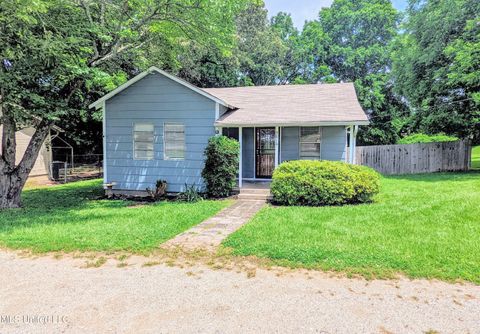
Active
$145,000
5
bds
|
3
ba
|
0
sqft
|
built
1952
233 Colonial Dr, Jackson, MS 39204
$13
Cash flow
0.5%
Cash-on-Cash Return
5.8%
Cap rate
0.8%
Rent to Value Ratio

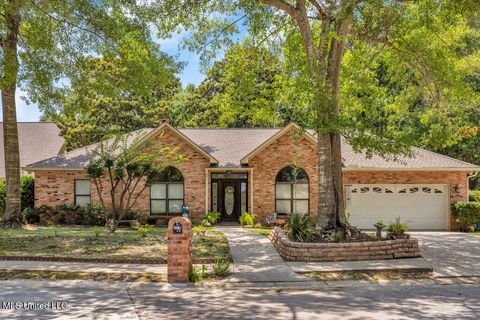
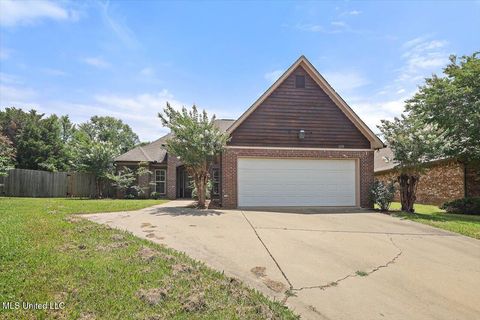
Active
$242,000
3
bds
|
2
ba
|
0
sqft
|
built
2006
708 Bo Blaze Cv, Brandon, MS 39047
$-128
Cash flow
-2.8%
Cash-on-Cash Return
5.0%
Cap rate
0.7%
Rent to Value Ratio
Active
$435,900
3
bds
|
2
ba
|
0
sqft
|
built
1996
807 Woodglen Dr, Ocean Springs, MS 39564
$-504
Cash flow
-6.0%
Cash-on-Cash Return
4.3%
Cap rate
0.6%
Rent to Value Ratio

Active
$329,900
4
bds
|
2
ba
|
0
sqft
|
built
1999
9884 Victor Dr, Olive Branch, MS 38654
$-190
Cash flow
-3.0%
Cash-on-Cash Return
5.0%
Cap rate
0.7%
Rent to Value Ratio

Active
$279,900
2
bds
|
3
ba
|
0
sqft
|
built
1975
550 Post Rd, Ridgeland, MS 39157
$-437
Cash flow
-8.1%
Cash-on-Cash Return
3.8%
Cap rate
0.7%
Rent to Value Ratio

Pending
$199,999
4
bds
|
2
ba
|
0
sqft
|
built
1968
1512 Arlington St, Clinton, MS 39056
$-54
Cash flow
-1.4%
Cash-on-Cash Return
5.4%
Cap rate
0.8%
Rent to Value Ratio

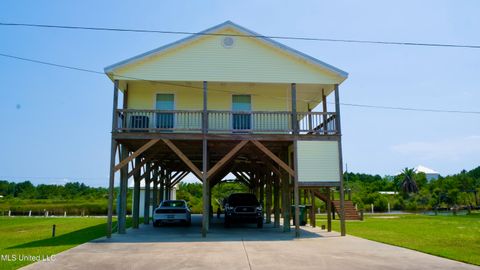
Active
$435,000
3
bds
|
1
ba
|
0
sqft
|
built
1995
11162 New York St, Bay Saint Louis, MS 39520
$-95
Cash flow
-1.1%
Cash-on-Cash Return
5.4%
Cap rate
0.7%
Rent to Value Ratio
Active
$555,000
4
bds
|
3
ba
|
0
sqft
|
built
2010
22215 Silver Hawk, Saucier, MS 39574
$-1,115
Cash flow
-10.5%
Cash-on-Cash Return
3.3%
Cap rate
0.5%
Rent to Value Ratio

Active
$895,000
27
bds
|
18
ba
|
0
sqft
|
built
1956
321 Rodenberg Ave, Biloxi, MS 39531
$-3,567
Cash flow
-20.8%
Cash-on-Cash Return
0.9%
Cap rate
0.2%
Rent to Value Ratio
Active
$285,000
3
bds
|
2
ba
|
0
sqft
|
built
2008
9019 Saint Teresa Dr, Bay Saint Louis, MS 39520
$-123
Cash flow
-2.3%
Cash-on-Cash Return
5.2%
Cap rate
0.7%
Rent to Value Ratio

Active
$168,000
3
bds
|
2
ba
|
0
sqft
|
built
2004
14906 Angela Dr, Gulfport, MS 39503
$195
Cash flow
6.1%
Cash-on-Cash Return
7.1%
Cap rate
1.0%
Rent to Value Ratio
Pending
$379,500
3
bds
|
3
ba
|
0
sqft
|
built
1988
279 Bayview Dr, Madison, MS 39110
$-272
Cash flow
-3.7%
Cash-on-Cash Return
4.8%
Cap rate
0.7%
Rent to Value Ratio

Active
$559,000
4
bds
|
3
ba
|
0
sqft
|
built
2021
12578 Alphabet Rd, Gulfport, MS 39503
$-864
Cash flow
-8.1%
Cash-on-Cash Return
3.8%
Cap rate
0.6%
Rent to Value Ratio
Active
$49,900
3
bds
|
2
ba
|
0
sqft
|
built
1950
3925 Garland Ave, Jackson, MS 39212
$966
Cash flow
22.6%
Cash-on-Cash Return
23.2%
Cap rate
2.8%
Rent to Value Ratio
Active
$887,500
5
bds
|
5
ba
|
0
sqft
|
built
2016
181 Ironwood Plantation Blvd, Madison, MS 39110
$-2,069
Cash flow
-12.2%
Cash-on-Cash Return
2.9%
Cap rate
0.4%
Rent to Value Ratio

Active
$159,000
3
bds
|
1
ba
|
0
sqft
|
built
1958
4425 Oak Ave, Moss Point, MS 39563
$214
Cash flow
7.0%
Cash-on-Cash Return
7.3%
Cap rate
0.9%
Rent to Value Ratio
Active
$85,000
3
bds
|
2
ba
|
0
sqft
|
built
1955
4229 Meadowmont Dr, Jackson, MS 39209
$232
Cash flow
14.2%
Cash-on-Cash Return
9.0%
Cap rate
1.2%
Rent to Value Ratio
Pending
$314,900
3
bds
|
2
ba
|
0
sqft
|
built
2022
2490 Marion Ln, Southaven, MS 38672
$-50
Cash flow
-0.8%
Cash-on-Cash Return
5.5%
Cap rate
0.8%
Rent to Value Ratio

Pending
$445,000
4
bds
|
3
ba
|
0
sqft
|
built
2009
128 Grayhawk Pkwy, Madison, MS 39110
$17
Cash flow
0.2%
Cash-on-Cash Return
5.7%
Cap rate
0.8%
Rent to Value Ratio
Active
$350,000
3
bds
|
2
ba
|
0
sqft
|
built
2006
109 Hampton Chase, Madison, MS 39110
$82
Cash flow
1.2%
Cash-on-Cash Return
6.0%
Cap rate
0.8%
Rent to Value Ratio

Active
$289,000
4
bds
|
3
ba
|
0
sqft
|
built
2023
5378 Leeds Ln, Biloxi, MS 39532
$196
Cash flow
3.5%
Cash-on-Cash Return
6.5%
Cap rate
0.8%
Rent to Value Ratio
Active
$245,900
4
bds
|
1
ba
|
0
sqft
|
built
1974
239 Traceland Dr, Madison, MS 39110
$99
Cash flow
2.1%
Cash-on-Cash Return
6.2%
Cap rate
0.8%
Rent to Value Ratio

Active
$370,000
3
bds
|
3
ba
|
0
sqft
|
built
1992
2552 Conifer Ct, Biloxi, MS 39531
$58
Cash flow
0.8%
Cash-on-Cash Return
5.9%
Cap rate
0.8%
Rent to Value Ratio

Active
$915,000
6
bds
|
5
ba
|
0
sqft
|
built
2022
114 Mc Geehee Rd, Senatobia, MS 38668
$-2,686
Cash flow
-15.3%
Cash-on-Cash Return
2.2%
Cap rate
0.3%
Rent to Value Ratio
Active
$204,999
4
bds
|
2
ba
|
0
sqft
|
built
1972
2709 E Angela Cir, Gulfport, MS 39503
$473
Cash flow
12.0%
Cash-on-Cash Return
8.4%
Cap rate
1.1%
Rent to Value Ratio
Active
$230,000
3
bds
|
2
ba
|
0
sqft
|
built
1999
1300 Richland Dr, Southaven, MS 38671
$-69
Cash flow
-1.6%
Cash-on-Cash Return
5.3%
Cap rate
0.7%
Rent to Value Ratio
Active
$345,900
3
bds
|
3
ba
|
0
sqft
|
built
2023
104 Beverly Dr, Ocean Springs, MS 39564
$-383
Cash flow
-5.8%
Cash-on-Cash Return
4.4%
Cap rate
0.7%
Rent to Value Ratio
Active
$89,000
3
bds
|
1
ba
|
0
sqft
|
built
1952
1715 Dixie Dr, Jackson, MS 39209
$270
Cash flow
15.8%
Cash-on-Cash Return
9.3%
Cap rate
1.2%
Rent to Value Ratio

Active
$379,900
3
bds
|
2
ba
|
0
sqft
|
built
1994
7635 Fairway Dr, Diamondhead, MS 39525
$-468
Cash flow
-6.4%
Cash-on-Cash Return
4.2%
Cap rate
0.7%
Rent to Value Ratio

Active
$260,000
4
bds
|
3
ba
|
0
sqft
|
built
1968
506 Loposser Ave, Gulfport, MS 39507
$71
Cash flow
1.4%
Cash-on-Cash Return
6.0%
Cap rate
0.8%
Rent to Value Ratio
Active
$75,000
3
bds
|
2
ba
|
0
sqft
|
built
1941
1215 Lawnview Pl, Jackson, MS 39203
$192
Cash flow
13.4%
Cash-on-Cash Return
8.8%
Cap rate
1.2%
Rent to Value Ratio
Active
$72,000
2
bds
|
1
ba
|
0
sqft
|
built
1950
954 Winn St, Jackson, MS 39204
$521
Cash flow
8.4%
Cash-on-Cash Return
8.7%
Cap rate
1.1%
Rent to Value Ratio
Active
$175,000
3
bds
|
1
ba
|
0
sqft
|
built
1939
9816 Goodman Rd, Olive Branch, MS 38654
$71
Cash flow
2.1%
Cash-on-Cash Return
6.2%
Cap rate
0.8%
Rent to Value Ratio

Active
$228,000
7
bds
|
6
ba
|
0
sqft
|
built
1940
3902 Pascagoula St, Pascagoula, MS 39567
$122
Cash flow
2.8%
Cash-on-Cash Return
6.3%
Cap rate
0.8%
Rent to Value Ratio
Active
$315,000
4
bds
|
2
ba
|
0
sqft
|
built
2008
519 Morning Glory Cv, Madison, MS 39110
$-232
Cash flow
-3.8%
Cash-on-Cash Return
4.8%
Cap rate
0.7%
Rent to Value Ratio
Active
$225,000
4
bds
|
2
ba
|
0
sqft
|
built
1988
634 Twin Harbor Pl, Madison, MS 39110
$423
Cash flow
9.8%
Cash-on-Cash Return
7.9%
Cap rate
1.0%
Rent to Value Ratio
Active
$135,900
3
bds
|
2
ba
|
0
sqft
|
built
1968
1628 Dry Creek Rd, Magee, MS 39111
$231
Cash flow
8.9%
Cash-on-Cash Return
7.7%
Cap rate
1.0%
Rent to Value Ratio

Active
$469,000
4
bds
|
3
ba
|
0
sqft
|
built
2000
3770 Swinnea Rd, Southaven, MS 38672
$-551
Cash flow
-6.1%
Cash-on-Cash Return
4.3%
Cap rate
0.6%
Rent to Value Ratio

Active
$440,000
4
bds
|
2
ba
|
0
sqft
|
built
2006
3 Rue Orleans, Long Beach, MS 39560
$-208
Cash flow
-2.5%
Cash-on-Cash Return
5.1%
Cap rate
0.7%
Rent to Value Ratio