Mississippi Investment Properties for Sale
Browse homes for sale and investment properties in Mississippi. Refine your search by price, property type, or more.
Best cash flowing properties in Mississippi
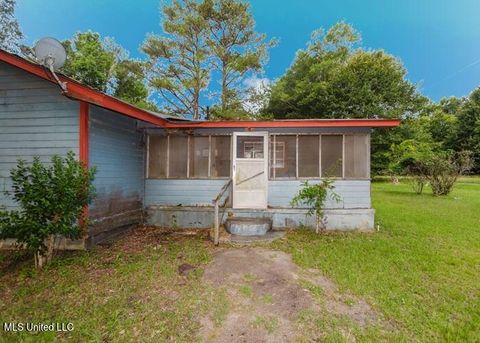
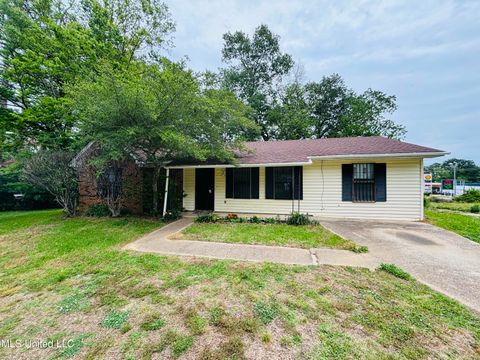
Active
$10,600
3
bds
|
2
ba
|
0
sqft
|
built
1967
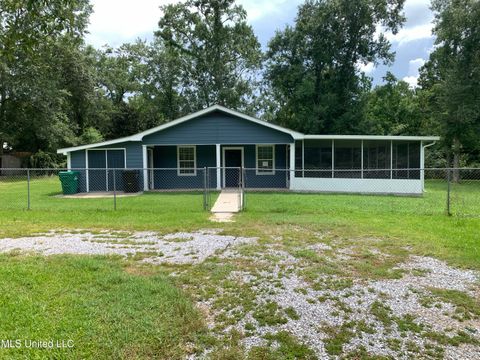
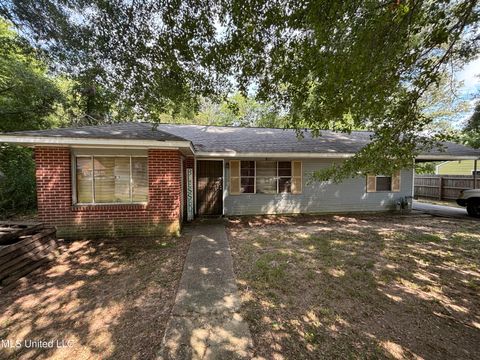
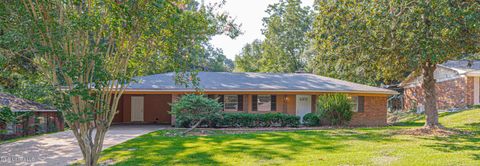
1157 Bunyard Rd, Clinton, MS 39056
$1,072
Cash flow
117.8%
Cash-on-Cash Return
121.4%
Cap rate
15.1%
Rent to Value Ratio
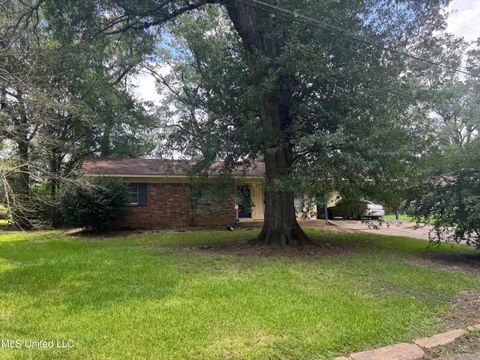
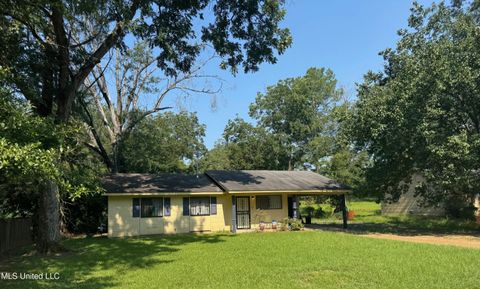
Active
$74,500
3
bds
|
2
ba
|
0
sqft
|
built
1967
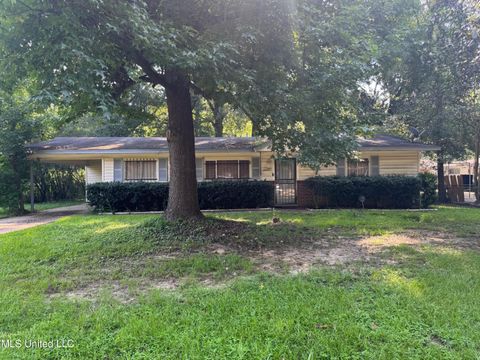
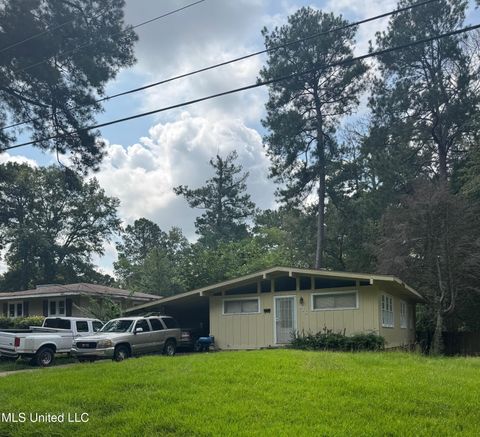
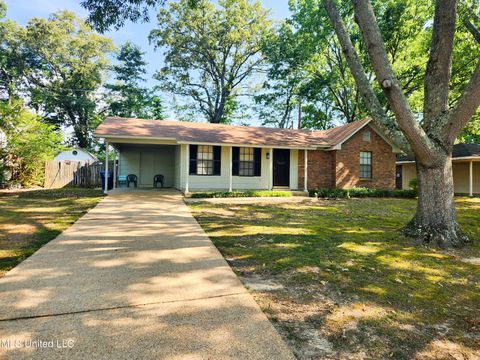
1954 Longwood Dr, Jackson, MS 39212
$852
Cash flow
13.3%
Cash-on-Cash Return
13.7%
Cap rate
1.9%
Rent to Value Ratio
2,085 out of 3,130 properties for sale in Mississippi
Limited Results Shown
Create a free account, or log in to reveal all property listings and enjoy the complete experience.
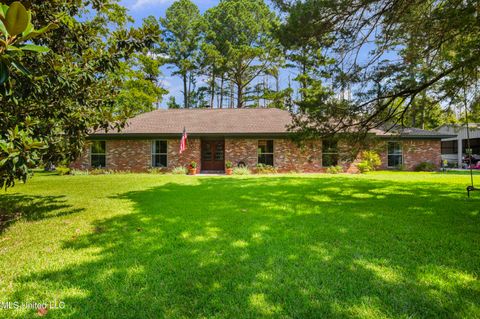
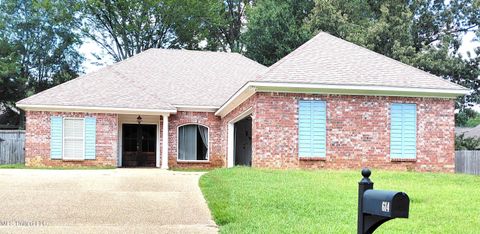
Active
$554,500
4
bds
|
2
ba
|
0
sqft
|
built
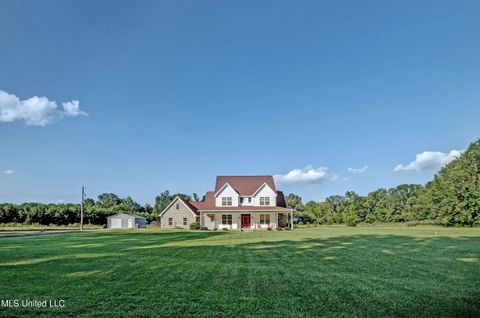
1973
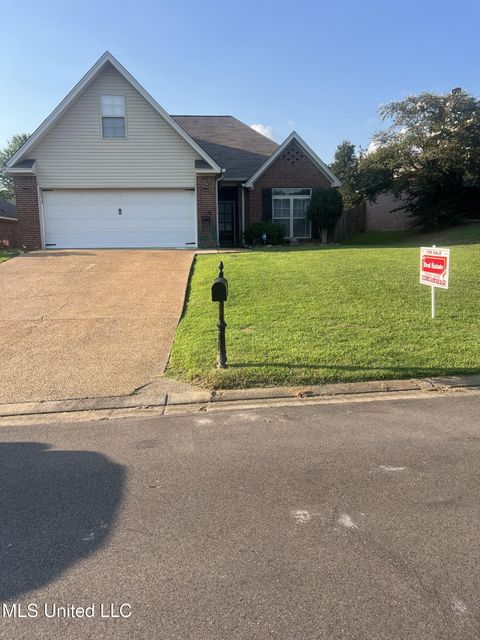
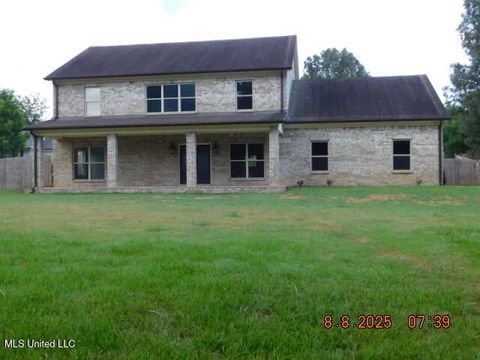
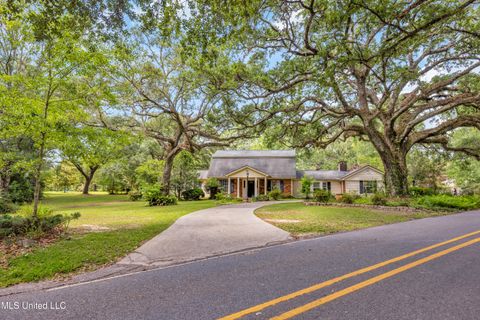
879 N Old Canton Rd, Canton, MS 39046
$-1,118
Cash flow
-10.5%
Cash-on-Cash Return
3.3%
Cap rate
0.4%
Rent to Value Ratio
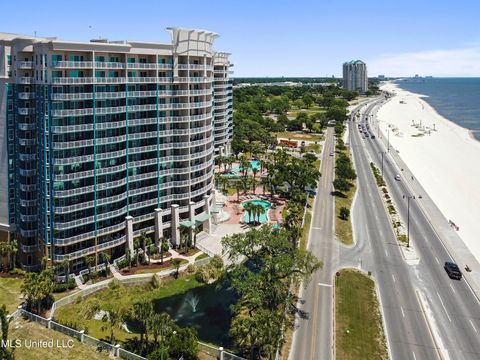
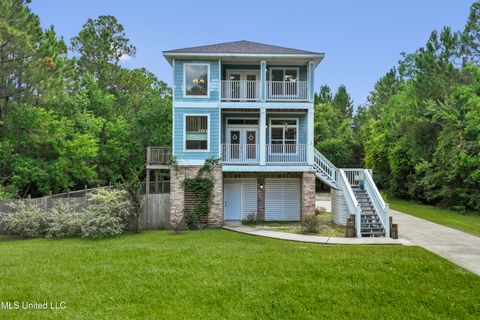
Active
$485,000
3
bds
|
3
ba
|
0
sqft
|
built
2006
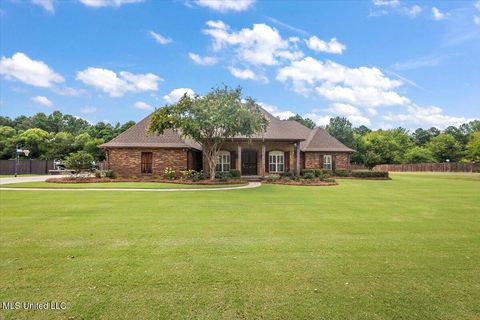
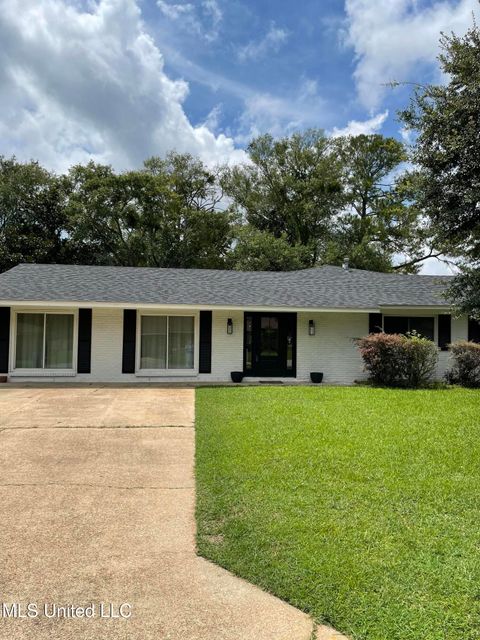
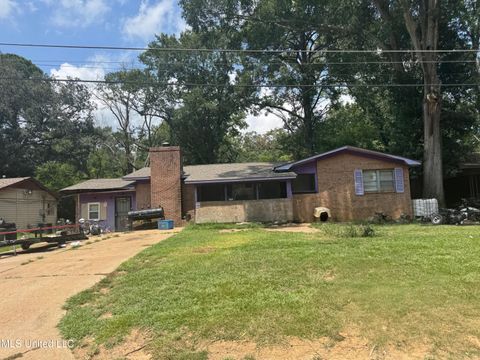
2228 Beach Dr, Gulfport, MS 39507
$-1,700
Cash flow
-18.3%
Cash-on-Cash Return
1.5%
Cap rate
0.7%
Rent to Value Ratio

Active
$699,000
3
bds
|
4
ba
|
0
sqft
|
built
2004
7514 Augusta Way, Diamondhead, MS 39525
$-1,444
Cash flow
-10.8%
Cash-on-Cash Return
3.2%
Cap rate
0.4%
Rent to Value Ratio
Active
$245,000
3
bds
|
2
ba
|
0
sqft
|
built
1986
102 Live Oak Cv, Brandon, MS 39047
$-142
Cash flow
-3.0%
Cash-on-Cash Return
5.0%
Cap rate
0.7%
Rent to Value Ratio
Active
$219,000
3
bds
|
2
ba
|
0
sqft
|
built
1979
12509 Ponce De Leon Dr, Ocean Springs, MS 39564
$241
Cash flow
5.7%
Cash-on-Cash Return
7.0%
Cap rate
0.9%
Rent to Value Ratio
Active
$194,250
4
bds
|
2
ba
|
0
sqft
|
built
2002
11298 Cypress Bayou Dr, Gulfport, MS 39503
$287
Cash flow
7.7%
Cash-on-Cash Return
7.5%
Cap rate
1.0%
Rent to Value Ratio
Active
$140,000
3
bds
|
2
ba
|
0
sqft
|
built
1962
14224 Dedeaux Rd, Gulfport, MS 39503
$441
Cash flow
16.4%
Cash-on-Cash Return
9.5%
Cap rate
1.1%
Rent to Value Ratio
Active
$249,000
3
bds
|
2
ba
|
0
sqft
|
built
1983
10085 Paradise Ln, Bay Saint Louis, MS 39520
$47
Cash flow
1.0%
Cash-on-Cash Return
5.9%
Cap rate
0.8%
Rent to Value Ratio
Active
$74,500
3
bds
|
1
ba
|
0
sqft
|
built
1956
3062 Lakewood Dr, Jackson, MS 39212
$725
Cash flow
11.3%
Cash-on-Cash Return
11.7%
Cap rate
1.6%
Rent to Value Ratio
Active
$265,000
4
bds
|
2
ba
|
0
sqft
|
built
2005
555 Lincolns Dr, Brandon, MS 39042
$188
Cash flow
3.7%
Cash-on-Cash Return
6.5%
Cap rate
0.9%
Rent to Value Ratio
Active
$650,000
4
bds
|
4
ba
|
0
sqft
|
built
2005
216 Meadowlands Dr, Brandon, MS 39047
$-991
Cash flow
-8.0%
Cash-on-Cash Return
3.8%
Cap rate
0.5%
Rent to Value Ratio
Active
$39,000
4
bds
|
2
ba
|
0
sqft
|
built
1950
3920 Walker Ave, Jackson, MS 39212
$703
Cash flow
21.0%
Cash-on-Cash Return
21.6%
Cap rate
2.8%
Rent to Value Ratio
Active
$79,000
3
bds
|
1
ba
|
0
sqft
|
built
1957
635 Witsell Rd, Jackson, MS 39206
$479
Cash flow
31.6%
Cash-on-Cash Return
13.0%
Cap rate
1.8%
Rent to Value Ratio
Active
$479,000
5
bds
|
3
ba
|
0
sqft
|
built
2016
8511 Byhalia Rd, Olive Branch, MS 38654
$-589
Cash flow
-6.4%
Cash-on-Cash Return
4.2%
Cap rate
0.6%
Rent to Value Ratio

Active
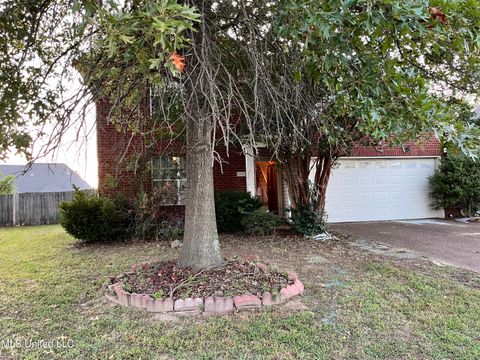
$279,900
3
bds
|
2
ba
|
0
sqft
|
built
1990
6650 Player Dr, Olive Branch, MS 38654
$34
Cash flow
0.6%
Cash-on-Cash Return
5.8%
Cap rate
0.8%
Rent to Value Ratio
Active
$349,900
3
bds
|
2
ba
|
0
sqft
|
built
1966
100 Hunter Dr, Ocean Springs, MS 39564
$92
Cash flow
1.4%
Cash-on-Cash Return
6.0%
Cap rate
0.8%
Rent to Value Ratio
Active
$549,900
5
bds
|
3
ba
|
0
sqft
|
built
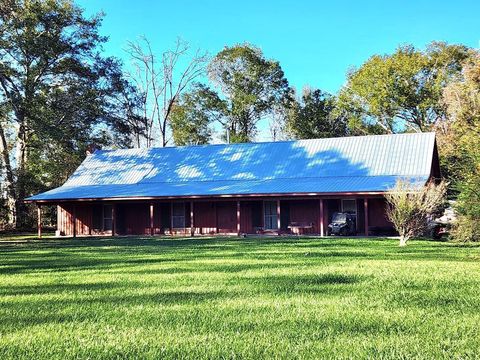
2018
360 Haynes Chapel Rd, Pelahatchie, MS 39145
$-404
Cash flow
-3.8%
Cash-on-Cash Return
4.8%
Cap rate
0.6%
Rent to Value Ratio
Active
$199,900
3
bds
|
2
ba
|
0
sqft
|
built
1999
8891 Shellflower Dr, Southaven, MS 38671
$243
Cash flow
6.3%
Cash-on-Cash Return
7.1%
Cap rate
0.9%
Rent to Value Ratio
Active
$90,000
4
bds
|
2
ba
|
0
sqft
|
built
1955
290 Marla Ave, Jackson, MS 39204
$218
Cash flow
12.6%
Cash-on-Cash Return
8.6%
Cap rate
1.2%
Rent to Value Ratio
Active
$265,000
3
bds
|
2
ba
|
0
sqft
|
built
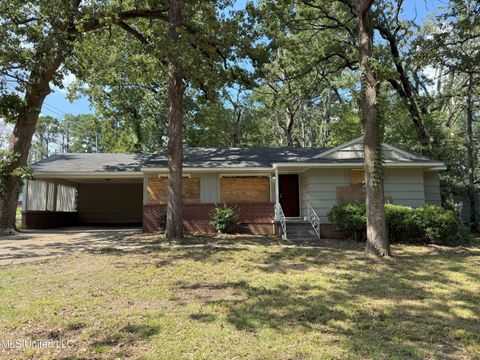
1984
1077 Cleveland St, Hazlehurst, MS 39083
$477
Cash flow
9.4%
Cash-on-Cash Return
7.8%
Cap rate
1.0%
Rent to Value Ratio
Active
$300,000
4
bds
|
3
ba
|
0
sqft
|
built
2018
15405 Needle St, Biloxi, MS 39532
$194
Cash flow
3.4%
Cash-on-Cash Return
6.5%
Cap rate
0.9%
Rent to Value Ratio
Active
$74,500
3
bds
|
2
ba
|
0
sqft
|
built
1958
1735 Woody Dr, Jackson, MS 39212
$672
Cash flow
10.5%
Cash-on-Cash Return
10.8%
Cap rate
1.5%
Rent to Value Ratio
Active
$85,000
3
bds
|
2
ba
|
0
sqft
|
built
1985
248 Kimbrough Dr, Jackson, MS 39204
$363
Cash flow
22.3%
Cash-on-Cash Return
10.8%
Cap rate
1.4%
Rent to Value Ratio
Active
$249,000
3
bds
|
2
ba
|
0
sqft
|
built
2004
614 Walnut Grove Dr, Pearl, MS 39208
$340
Cash flow
7.1%
Cash-on-Cash Return
7.3%
Cap rate
0.9%
Rent to Value Ratio
Active
$213,000
3
bds
|
2
ba
|
0
sqft
|
built
1966
1011 Laurelwood Dr, Clinton, MS 39056
$9
Cash flow
0.2%
Cash-on-Cash Return
5.7%
Cap rate
0.8%
Rent to Value Ratio
Active
$185,000
3
bds
|
2
ba
|
0
sqft
|
built
1985
5646 Briarwood Dr, Horn Lake, MS 38637
$162
Cash flow
4.6%
Cash-on-Cash Return
6.7%
Cap rate
0.9%
Rent to Value Ratio
Active
$365,000
4
bds
|
3
ba
|
0
sqft
|
built
1974
9618 Paige Bayou Rd, Vancleave, MS 39565
$-177
Cash flow
-2.5%
Cash-on-Cash Return
5.1%
Cap rate
0.7%
Rent to Value Ratio

Active
$294,000
3
bds
|
2
ba
|
0
sqft
|
built
2001
104 Fernwood Dr, Pass Christian, MS 39571
$157
Cash flow
2.8%
Cash-on-Cash Return
6.3%
Cap rate
0.9%
Rent to Value Ratio

Active
$230,000
3
bds
|
2
ba
|
0
sqft
|
built
1969
15309 Royal St, Gulfport, MS 39503
$31
Cash flow
0.7%
Cash-on-Cash Return
5.8%
Cap rate
0.7%
Rent to Value Ratio
Active
$64,000
3
bds
|
1
ba
|
0
sqft
|
built
1960
412 Cameron St, Jackson, MS 39212
$758
Cash flow
13.8%
Cash-on-Cash Return
14.2%
Cap rate
1.9%
Rent to Value Ratio
Active
$163,350
3
bds
|
2
ba
|
0
sqft
|
built
1959
205 Pimlico Pl, Jackson, MS 39211
$380
Cash flow
12.1%
Cash-on-Cash Return
8.5%
Cap rate
1.2%
Rent to Value Ratio
Active
$799,000
4
bds
|
4
ba
|
0
sqft
|
built
2010
5 Pecan Tree Pl, Jackson, MS 39211
$-1,409
Cash flow
-9.2%
Cash-on-Cash Return
3.6%
Cap rate
0.6%
Rent to Value Ratio
Active
$345,000
2
bds
|
3
ba
|
0
sqft
|
built
1974
54 Eastbrooke St, Jackson, MS 39216
$-928
Cash flow
-14.0%
Cash-on-Cash Return
2.5%
Cap rate
0.7%
Rent to Value Ratio
Active
$691,500
3
bds
|
4
ba
|
0
sqft
|
built
2010
253 S Lang Ave, Long Beach, MS 39560
$-1,008
Cash flow
-7.6%
Cash-on-Cash Return
3.9%
Cap rate
0.6%
Rent to Value Ratio
Active
$449,000
4
bds
|
3
ba
|
0
sqft
|
built
1992
19085 Commission Rd, Long Beach, MS 39560
$-696
Cash flow
-8.1%
Cash-on-Cash Return
3.8%
Cap rate
0.5%
Rent to Value Ratio

Active
$345,000
3
bds
|
3
ba
|
0
sqft
|
built
1994
5010 Live Oak Dr, Long Beach, MS 39560
$-281
Cash flow
-4.2%
Cash-on-Cash Return
4.7%
Cap rate
0.7%
Rent to Value Ratio
Active
$257,700
4
bds
|
3
ba
|
0
sqft
|
built
1970
7650 Lexington Dr, Biloxi, MS 39532
$347
Cash flow
7.0%
Cash-on-Cash Return
7.3%
Cap rate
0.9%
Rent to Value Ratio
Active
$785,000
5
bds
|
5
ba
|
0
sqft
|
built
1958
100 City Limits Rd, Brandon, MS 39042
$-1,955
Cash flow
-13.0%
Cash-on-Cash Return
2.7%
Cap rate
0.4%
Rent to Value Ratio