Mississippi Investment Properties for Sale
Browse homes for sale and investment properties in Mississippi. Refine your search by price, property type, or more.
Best cash flowing properties in Mississippi
Active
$17,000
2
bds
|
1
ba
|
0
sqft
|
built
1935
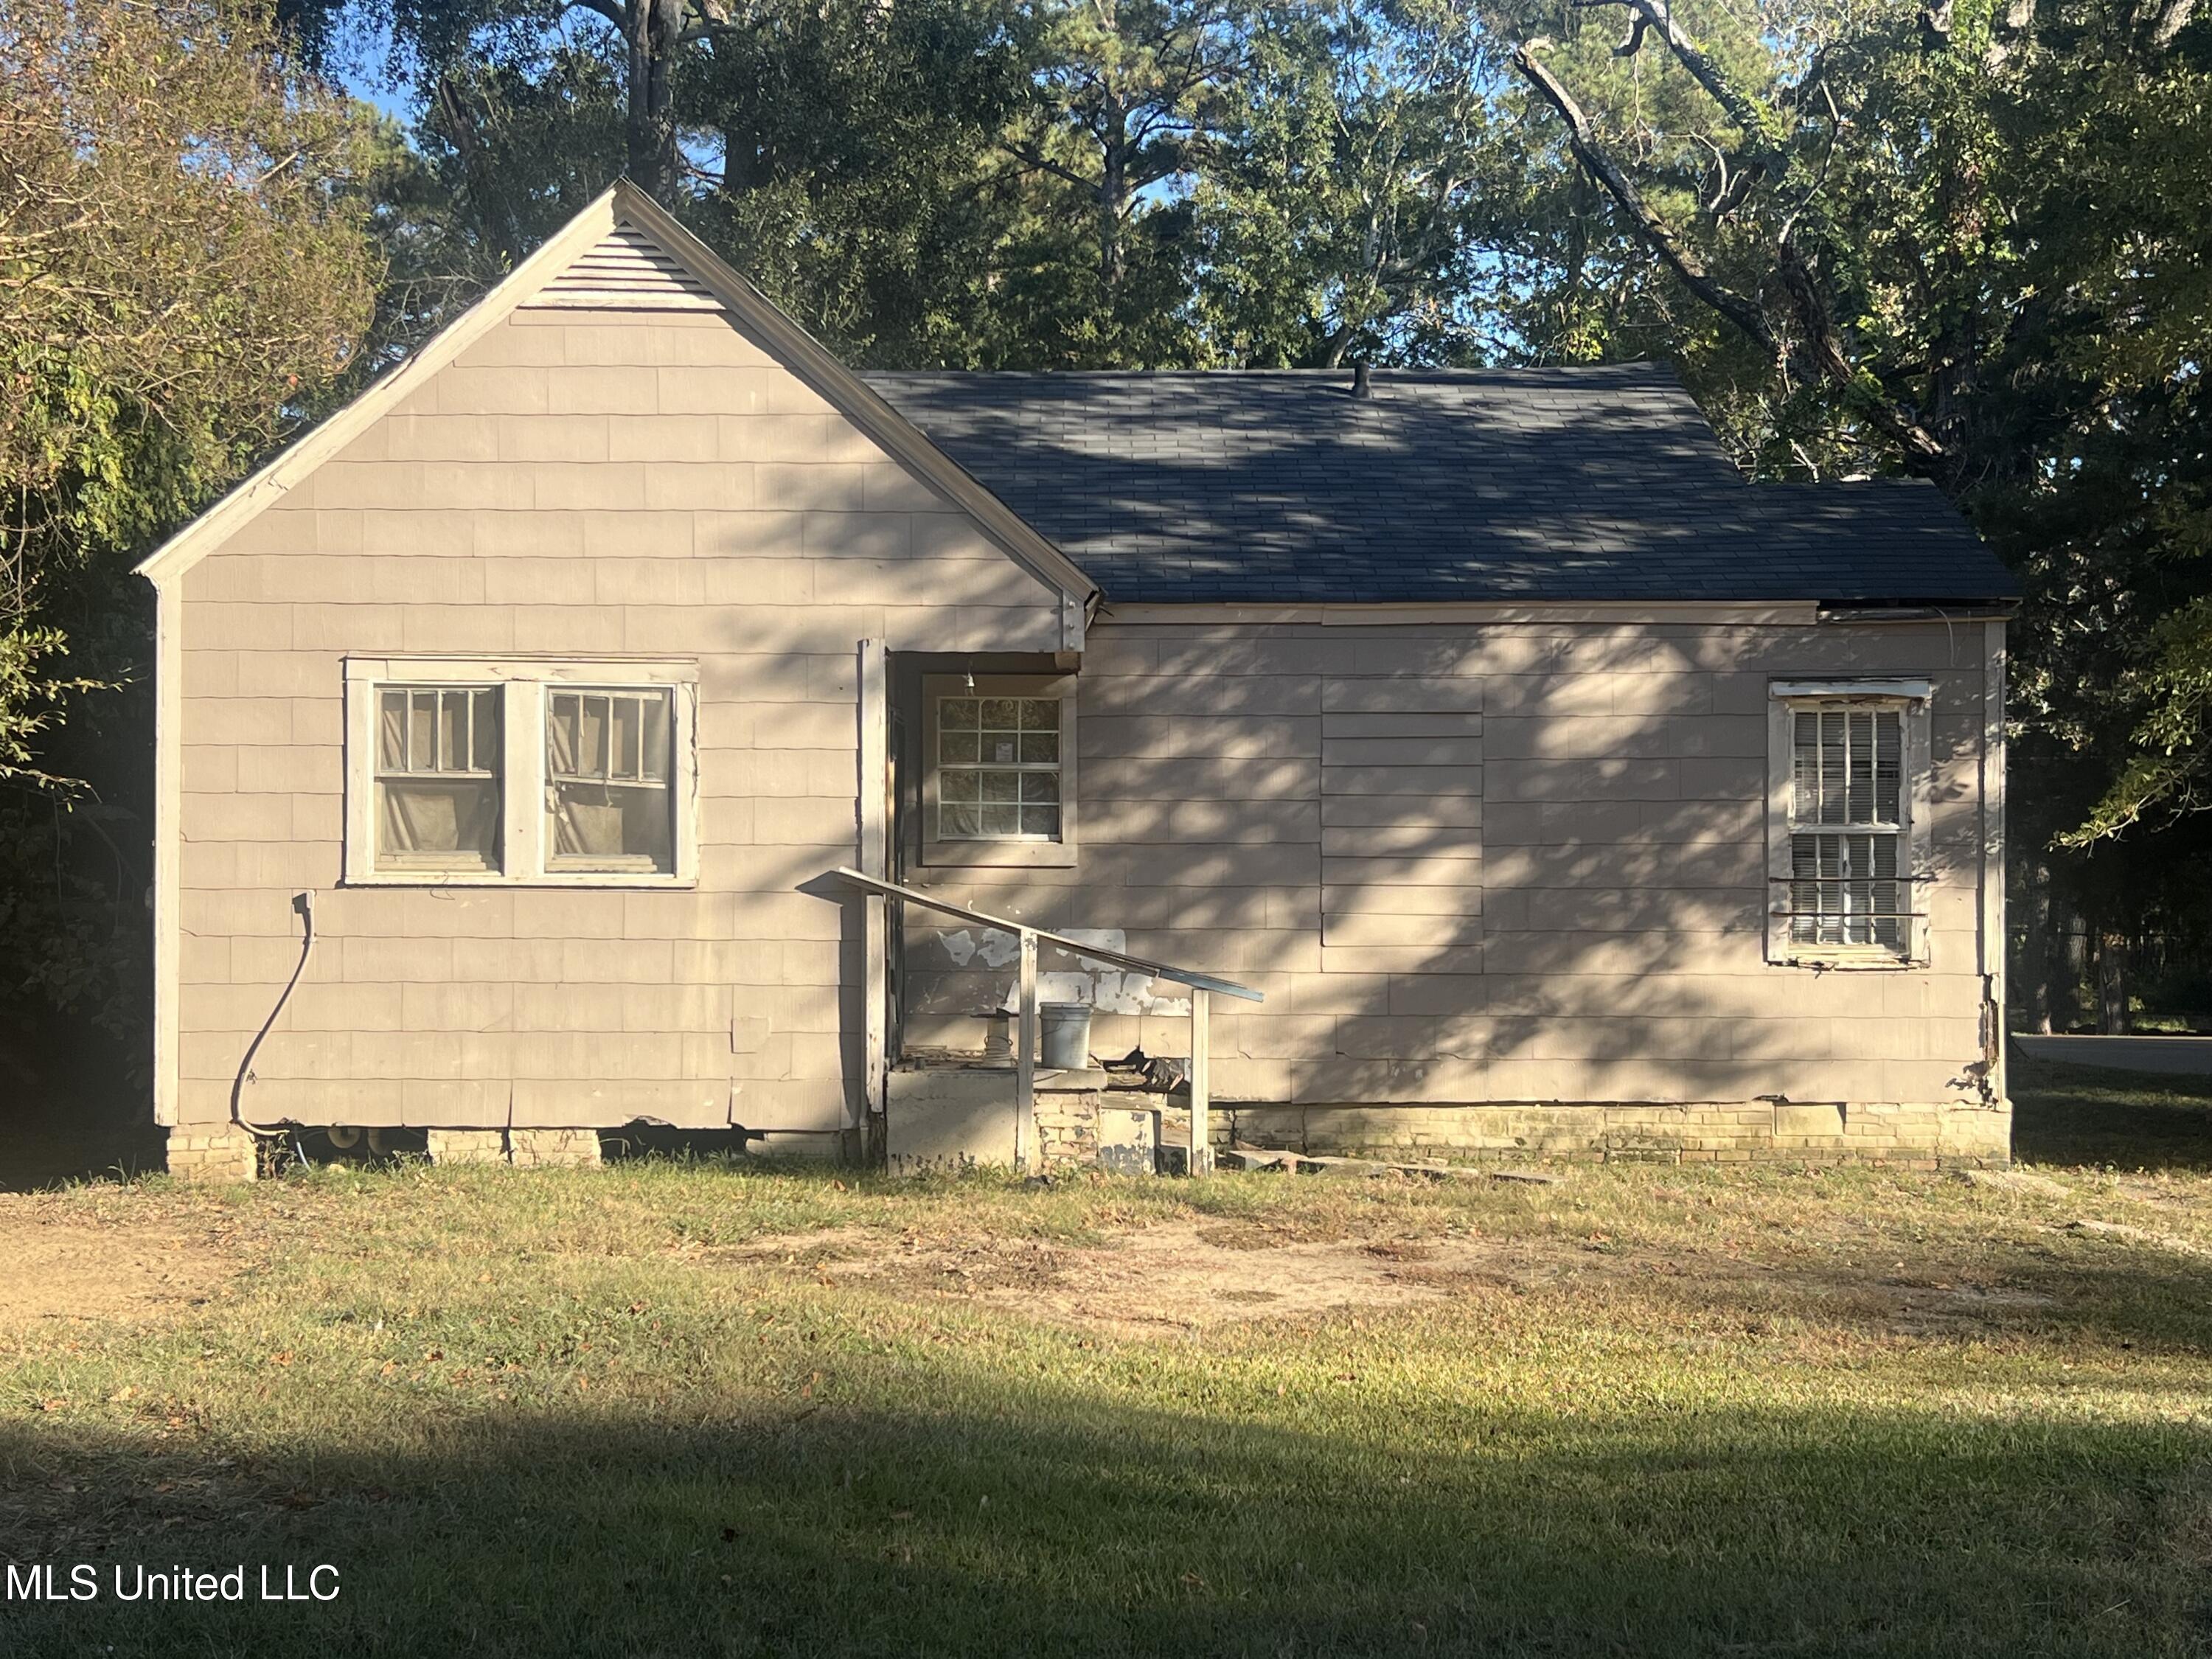
173 Parkside Pl, Jackson, MS 39209
$518
Cash flow
35.5%
Cash-on-Cash Return
36.6%
Cap rate
4.7%
Rent to Value Ratio

Active
$145,000
3
bds
|
1
ba
|
0
sqft
|
built
1970
2112 Woodside Dr, Gautier, MS 39553
$221
Cash flow
8.0%
Cash-on-Cash Return
7.5%
Cap rate
1.0%
Rent to Value Ratio
2,913 out of 4,249 properties for sale in Mississippi
Limited Results Shown
Create a free account, or log in to reveal all property listings and enjoy the complete experience.
Active
$587,777
4
bds
|
4
ba
|
0
sqft
|
built
1999
1025 Monet Cv, Brandon, MS 39047
$-335
Cash flow
-3.0%
Cash-on-Cash Return
5.0%
Cap rate
0.7%
Rent to Value Ratio
Active
$485,000
5
bds
|
5
ba
|
0
sqft
|
built
1984
121 Countrywood Cir, Clinton, MS 39056
$-445
Cash flow
-4.8%
Cash-on-Cash Return
4.6%
Cap rate
0.7%
Rent to Value Ratio
Active
$385,900
4
bds
|
3
ba
|
0
sqft
|
built
1971
17508 John Cumbest Rd, Moss Point, MS 39562
$-252
Cash flow
-3.4%
Cash-on-Cash Return
4.9%
Cap rate
0.6%
Rent to Value Ratio
Active
$1,080,000
3
bds
|
2
ba
|
0
sqft
|
built
1945
1309 Bowen Ave, Ocean Springs, MS 39564
$-3,781
Cash flow
-18.3%
Cash-on-Cash Return
1.5%
Cap rate
0.2%
Rent to Value Ratio
Active
$379,000
4
bds
|
4
ba
|
0
sqft
|
built
2000
140 Whisper Lake Blvd, Madison, MS 39110
$90
Cash flow
1.2%
Cash-on-Cash Return
6.0%
Cap rate
0.8%
Rent to Value Ratio
Active
$299,950
4
bds
|
2
ba
|
0
sqft
|
built
2021
211 Hawthorne Dr, Long Beach, MS 39560
$-62
Cash flow
-1.1%
Cash-on-Cash Return
5.4%
Cap rate
0.8%
Rent to Value Ratio
Active
$320,000
4
bds
|
2
ba
|
0
sqft
|
built
2022
2532 Rutherford Dr, Southaven, MS 38672
$52
Cash flow
0.8%
Cash-on-Cash Return
5.9%
Cap rate
0.8%
Rent to Value Ratio
Active
$597,500
4
bds
|
4
ba
|
0
sqft
|
built
1980
524 Champlin St, Gulfport, MS 39507
$-1,164
Cash flow
-10.2%
Cash-on-Cash Return
3.3%
Cap rate
0.5%
Rent to Value Ratio
Active
$361,258
3
bds
|
3
ba
|
0
sqft
|
built
1986
14 Peachtree Ln, Madison, MS 39110
$-70
Cash flow
-1.0%
Cash-on-Cash Return
5.4%
Cap rate
0.7%
Rent to Value Ratio
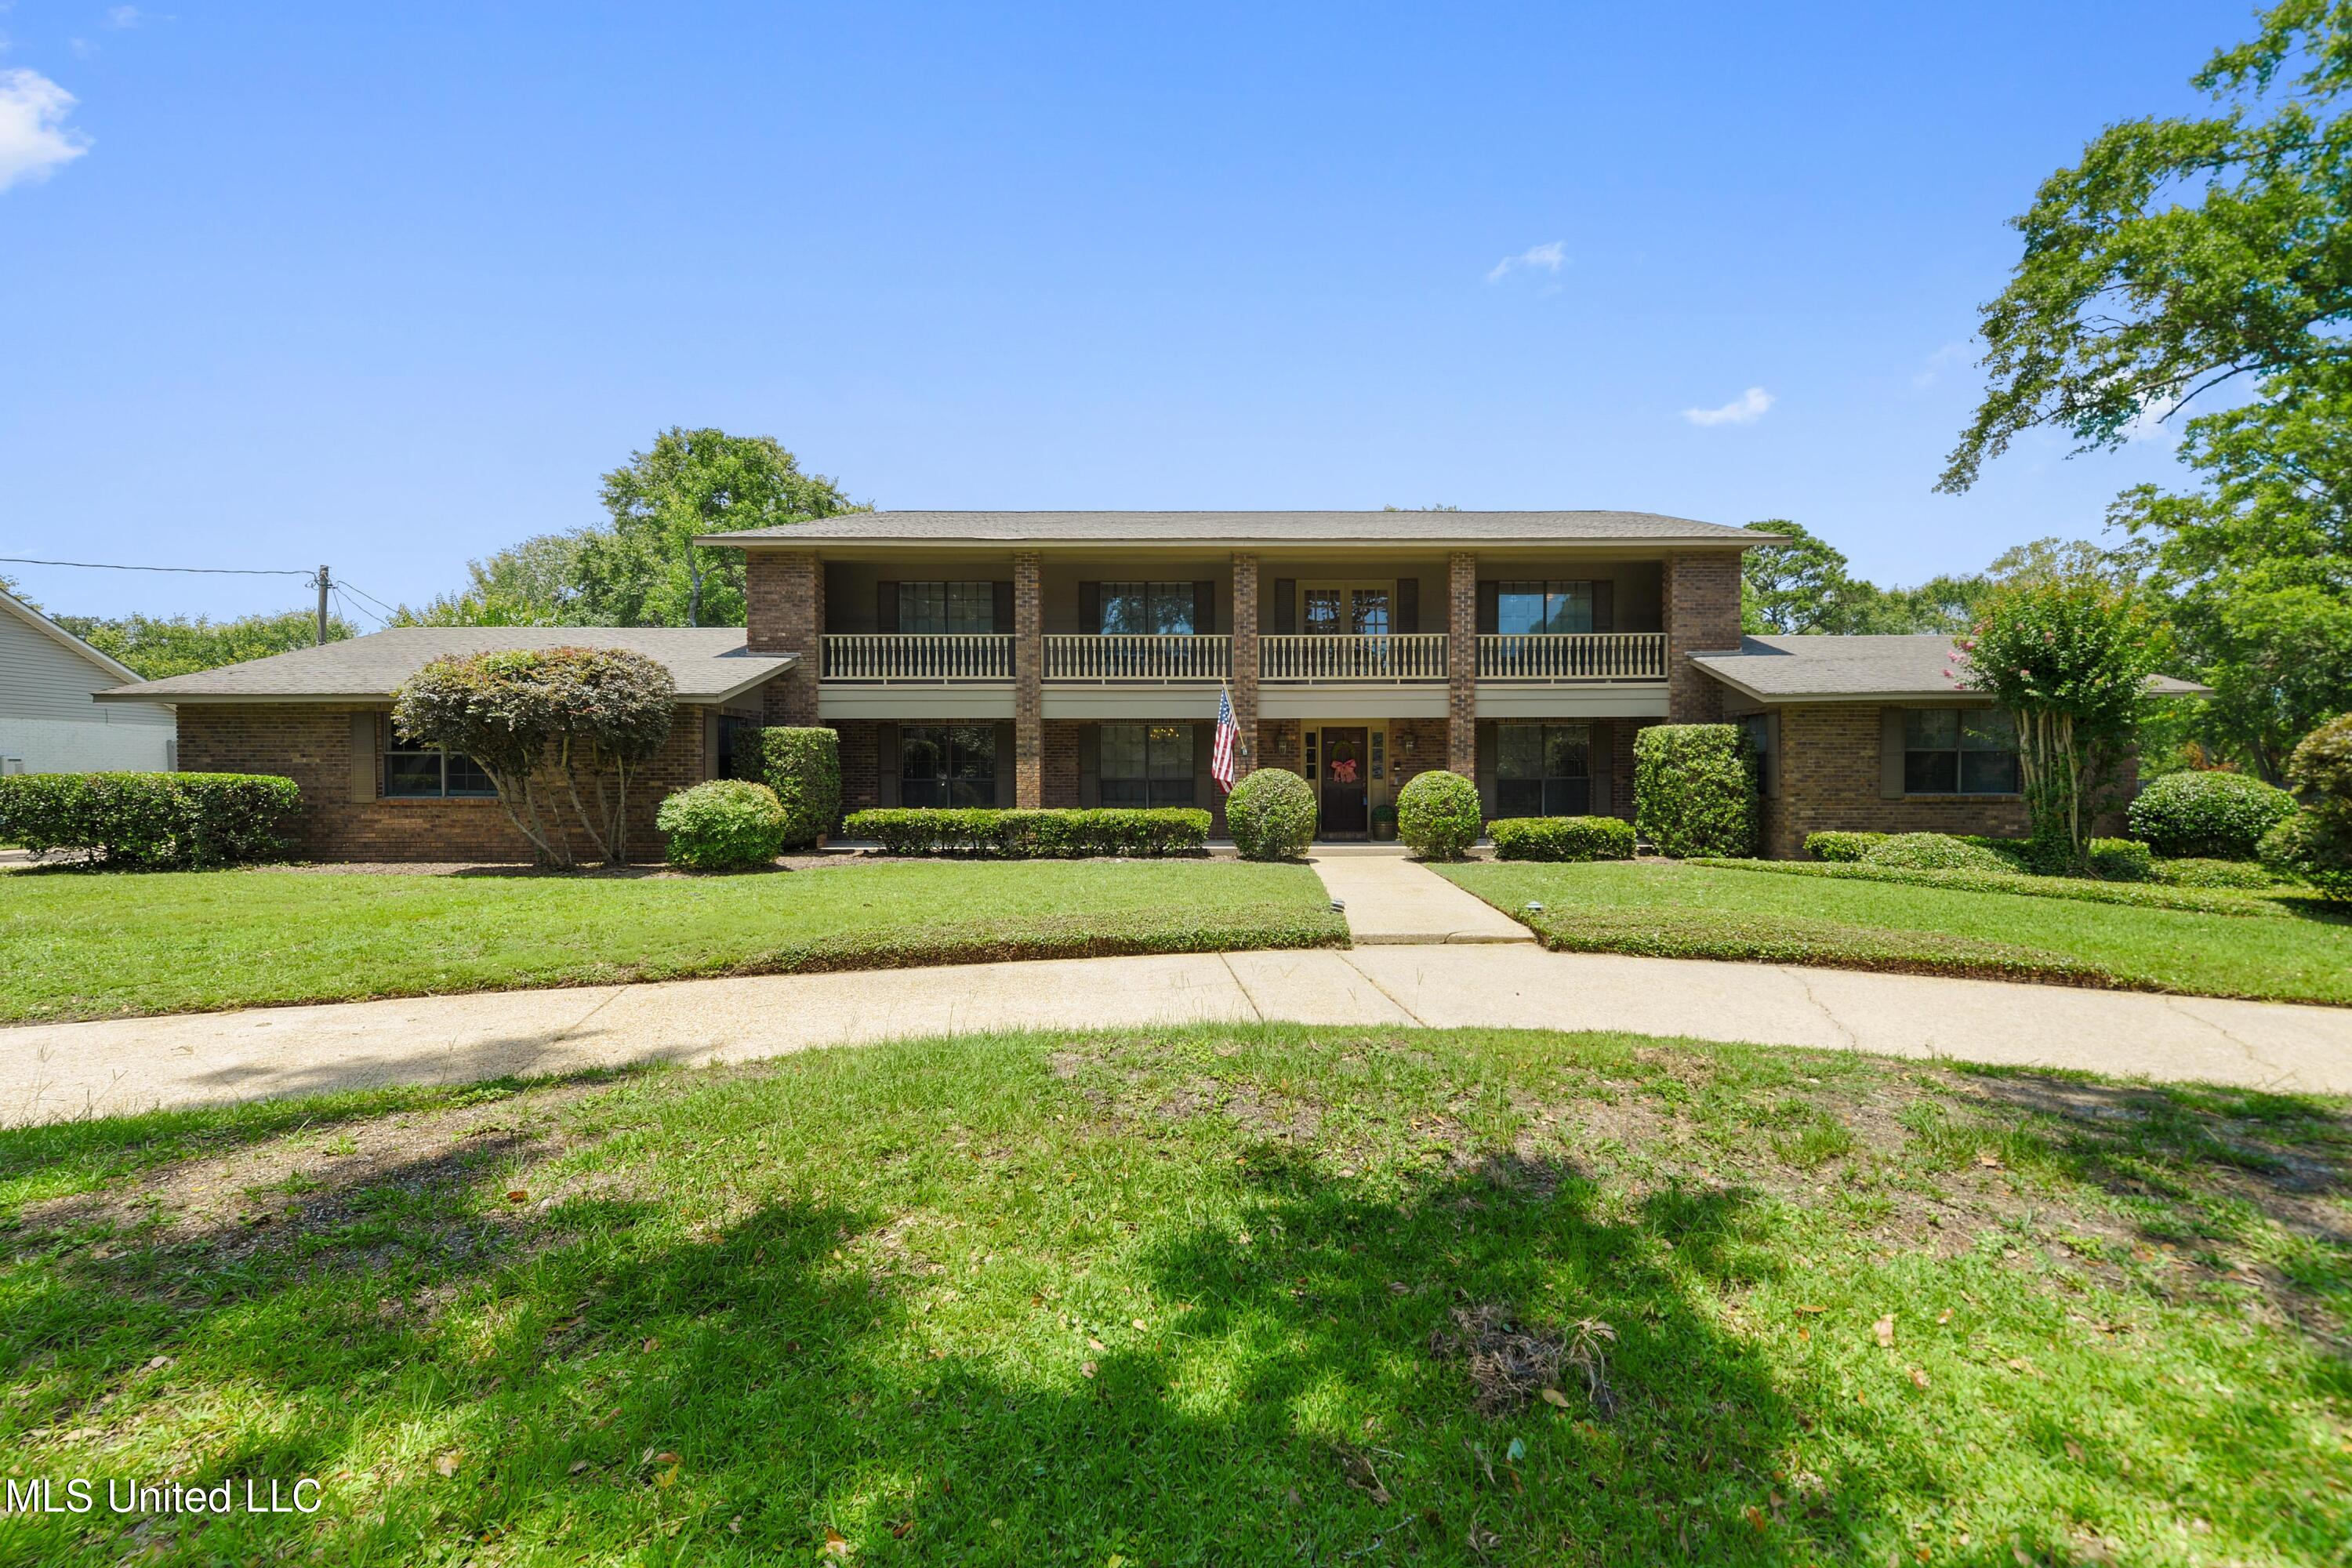
Pending
$396,000
5
bds
|
4
ba
|
0
sqft
|
built
1981
316 Meadow Creek Pl, Jackson, MS 39211
$-817
Cash flow
-10.8%
Cash-on-Cash Return
3.2%
Cap rate
0.6%
Rent to Value Ratio
Active
$385,000
4
bds
|
3
ba
|
0
sqft
|
built
2005
221 Penny Ln, Brandon, MS 39042
$-126
Cash flow
-1.7%
Cash-on-Cash Return
5.3%
Cap rate
0.7%
Rent to Value Ratio
Active
$350,000
4
bds
|
3
ba
|
0
sqft
|
built
1982
560 Post Office Rd, Coldwater, MS 38618
$-276
Cash flow
-4.1%
Cash-on-Cash Return
4.7%
Cap rate
0.6%
Rent to Value Ratio

Active
$165,000
4
bds
|
2
ba
|
0
sqft
|
built
1977
1701 Timber Lane Rd, Gautier, MS 39553
$218
Cash flow
6.9%
Cash-on-Cash Return
7.3%
Cap rate
1.0%
Rent to Value Ratio

Active
$725,000
5
bds
|
4
ba
|
0
sqft
|
built
2019
368 Goose Pointe Blvd, Biloxi, MS 39531
$-1,006
Cash flow
-7.2%
Cash-on-Cash Return
4.0%
Cap rate
0.5%
Rent to Value Ratio
Active
$265,000
3
bds
|
2
ba
|
0
sqft
|
built
2003
3617 Kennebrew Rd, Jackson, MS 39209
$103
Cash flow
2.0%
Cash-on-Cash Return
6.1%
Cap rate
0.8%
Rent to Value Ratio
Pending
$310,000
4
bds
|
3
ba
|
0
sqft
|
built
2003
7413 Fox Creek Dr, Olive Branch, MS 38654
$-11
Cash flow
-0.2%
Cash-on-Cash Return
5.6%
Cap rate
0.8%
Rent to Value Ratio

Active
$205,000
2
bds
|
2
ba
|
0
sqft
|
built
1976
10883 Loch Venarcher Cv, Hernando, MS 38632
$75
Cash flow
1.9%
Cash-on-Cash Return
6.1%
Cap rate
0.8%
Rent to Value Ratio
Active
$419,000
8
bds
|
8
ba
|
0
sqft
|
built
1989
3440 Kickapoo Rd, Jackson, MS 39209
$-379
Cash flow
-4.7%
Cash-on-Cash Return
4.6%
Cap rate
0.8%
Rent to Value Ratio
Active
$145,000
3
bds
|
1
ba
|
0
sqft
|
built
1970
2112 Woodside Dr, Gautier, MS 39553
$221
Cash flow
8.0%
Cash-on-Cash Return
7.5%
Cap rate
1.0%
Rent to Value Ratio
Active
$359,000
5
bds
|
3
ba
|
0
sqft
|
built
1975
136 Westlake Dr, Brandon, MS 39047
$136
Cash flow
2.0%
Cash-on-Cash Return
6.1%
Cap rate
0.8%
Rent to Value Ratio
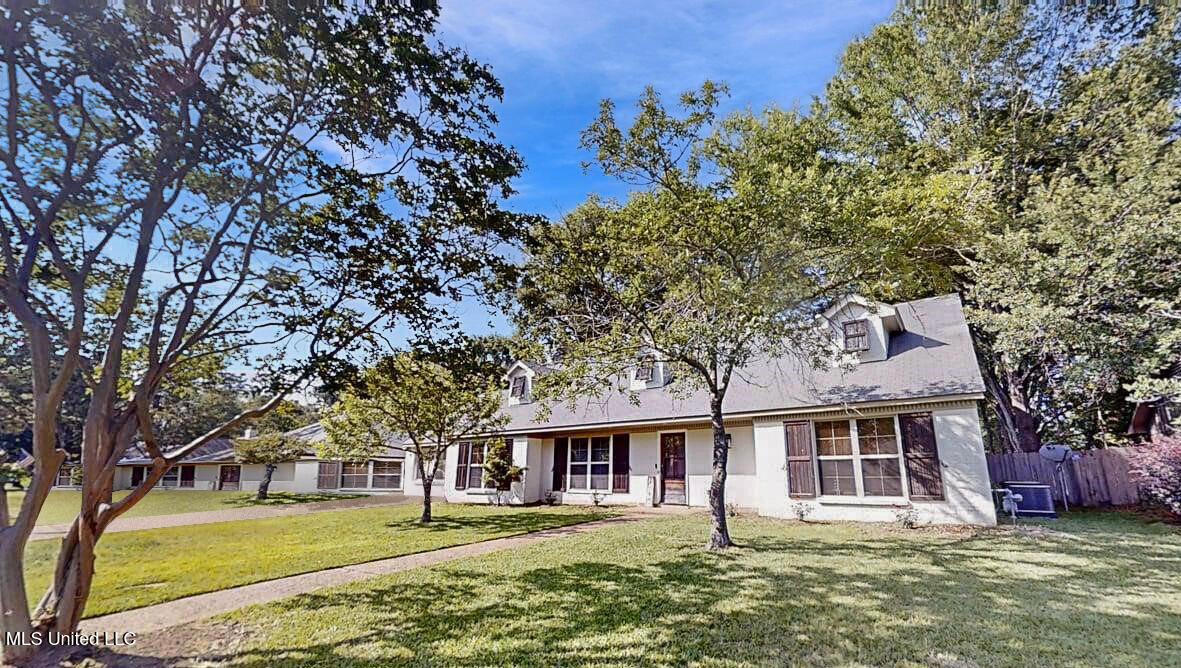
Active
$395,000
5
bds
|
4
ba
|
0
sqft
|
built
1963
455 Armour Dr, Jackson, MS 39211
$-357
Cash flow
-4.7%
Cash-on-Cash Return
4.6%
Cap rate
0.7%
Rent to Value Ratio

Active
$339,000
2
bds
|
2
ba
|
0
sqft
|
built
2008
5068 Bordage St, Bay Saint Louis, MS 39520
$-96
Cash flow
-1.5%
Cash-on-Cash Return
5.3%
Cap rate
0.7%
Rent to Value Ratio
Active
$17,000
2
bds
|
1
ba
|
0
sqft
|
built
1935
173 Parkside Pl, Jackson, MS 39209
$518
Cash flow
35.5%
Cash-on-Cash Return
36.6%
Cap rate
4.7%
Rent to Value Ratio
Active
$535,000
4
bds
|
3
ba
|
0
sqft
|
built
1940
1616 Poplar Blvd, Jackson, MS 39202
$-857
Cash flow
-8.4%
Cash-on-Cash Return
3.8%
Cap rate
0.5%
Rent to Value Ratio
Active
$379,000
4
bds
|
2
ba
|
0
sqft
|
built
1994
103 Sutton Ln, Madison, MS 39110
$-241
Cash flow
-3.3%
Cash-on-Cash Return
4.9%
Cap rate
0.7%
Rent to Value Ratio

Active
$309,000
3
bds
|
2
ba
|
0
sqft
|
built
1966
5539 Gates Ave, Long Beach, MS 39560
$-6
Cash flow
-0.1%
Cash-on-Cash Return
5.7%
Cap rate
0.7%
Rent to Value Ratio
Active
$189,900
3
bds
|
2
ba
|
0
sqft
|
built
1984
428 Simpson Cir, Mendenhall, MS 39114
$201
Cash flow
5.5%
Cash-on-Cash Return
7.0%
Cap rate
0.9%
Rent to Value Ratio
Pending
$585,000
4
bds
|
4
ba
|
0
sqft
|
built
1998
207 Wisteria Ct, Flowood, MS 39232
$-1,117
Cash flow
-10.0%
Cash-on-Cash Return
3.4%
Cap rate
0.5%
Rent to Value Ratio
Pending
$285,000
3
bds
|
2
ba
|
0
sqft
|
built
1977
217 Briarhill Cv, Florence, MS 39073
$196
Cash flow
3.6%
Cash-on-Cash Return
6.5%
Cap rate
0.8%
Rent to Value Ratio
Active
$481,500
4
bds
|
3
ba
|
0
sqft
|
built
2022
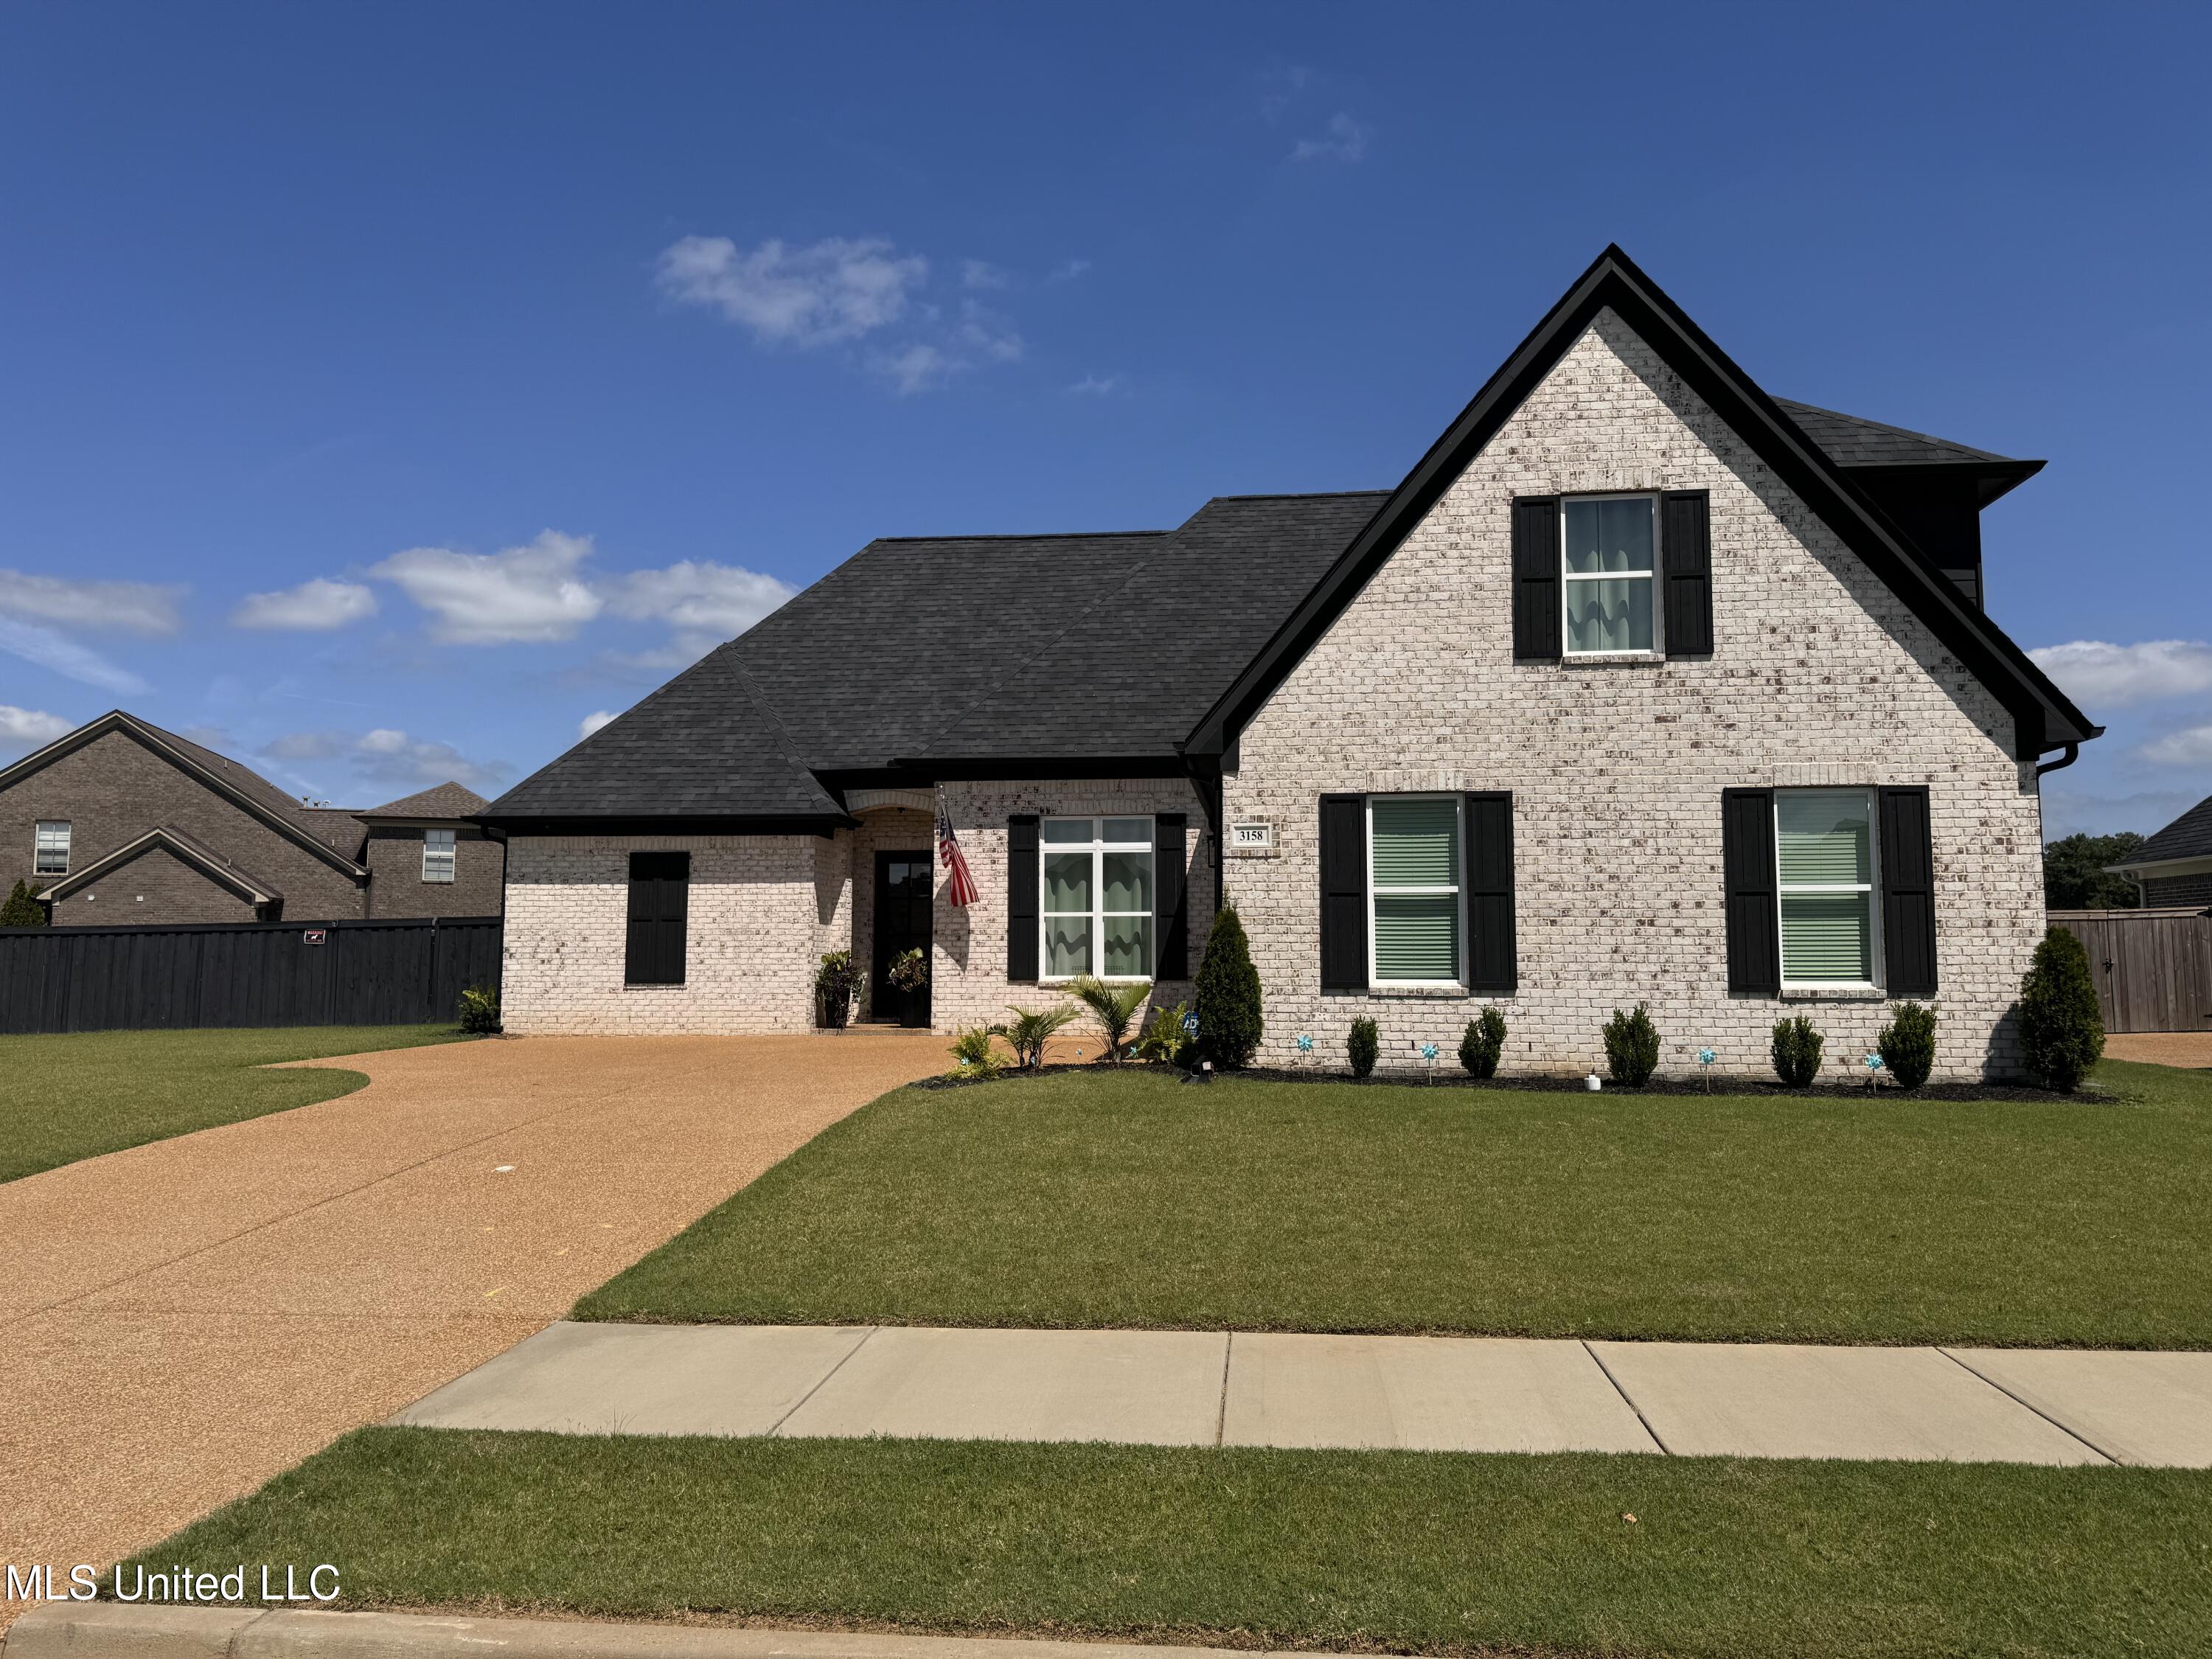
3158 Summer Ave, Hernando, MS 38632
$-79
Cash flow
-0.9%
Cash-on-Cash Return
5.5%
Cap rate
0.7%
Rent to Value Ratio

Active
$310,000
3
bds
|
2
ba
|
0
sqft
|
built
1954
202 45th St, Gulfport, MS 39507
$-226
Cash flow
-3.8%
Cash-on-Cash Return
4.8%
Cap rate
0.6%
Rent to Value Ratio
Pending
$285,900
3
bds
|
2
ba
|
0
sqft
|
built
1970
244 Saddle Club Rd, Holly Springs, MS 38635
$-116
Cash flow
-2.1%
Cash-on-Cash Return
5.2%
Cap rate
0.6%
Rent to Value Ratio
Active
$249,900
4
bds
|
3
ba
|
0
sqft
|
built
1965
105 Mark Dr, Mendenhall, MS 39114
$219
Cash flow
4.6%
Cash-on-Cash Return
6.7%
Cap rate
0.9%
Rent to Value Ratio
Active
$565,000
5
bds
|
4
ba
|
0
sqft
|
built
1975
100 Sandpiper Rd, Brandon, MS 39047
$-766
Cash flow
-7.1%
Cash-on-Cash Return
4.1%
Cap rate
0.5%
Rent to Value Ratio
Active
$324,900
3
bds
|
3
ba
|
0
sqft
|
built
1996
5348 Tournament Dr, Olive Branch, MS 38654
$151
Cash flow
2.4%
Cash-on-Cash Return
6.2%
Cap rate
0.8%
Rent to Value Ratio
Active
$335,000
4
bds
|
3
ba
|
0
sqft
|
built
2022
7718 Parkridge Dr, Southaven, MS 38671
$-64
Cash flow
-1.0%
Cash-on-Cash Return
5.4%
Cap rate
0.7%
Rent to Value Ratio
Active
$324,999
4
bds
|
3
ba
|
0
sqft
|
built
2001
4213 Victoria Ln, Biloxi, MS 39532
$-153
Cash flow
-2.5%
Cash-on-Cash Return
5.1%
Cap rate
0.7%
Rent to Value Ratio
Active
$669,500
3
bds
|
3
ba
|
0
sqft
|
built
1976
15208 C C Camp Rd, Gulfport, MS 39503
$-1,443
Cash flow
-11.2%
Cash-on-Cash Return
3.1%
Cap rate
0.4%
Rent to Value Ratio
Active
$507,000
5
bds
|
4
ba
|
0
sqft
|
built
1994
138 Sunflower Rd, Madison, MS 39110
$-1,339
Cash flow
-13.8%
Cash-on-Cash Return
2.5%
Cap rate
0.5%
Rent to Value Ratio
Active
$148,000
3
bds
|
2
ba
|
0
sqft
|
built
1958
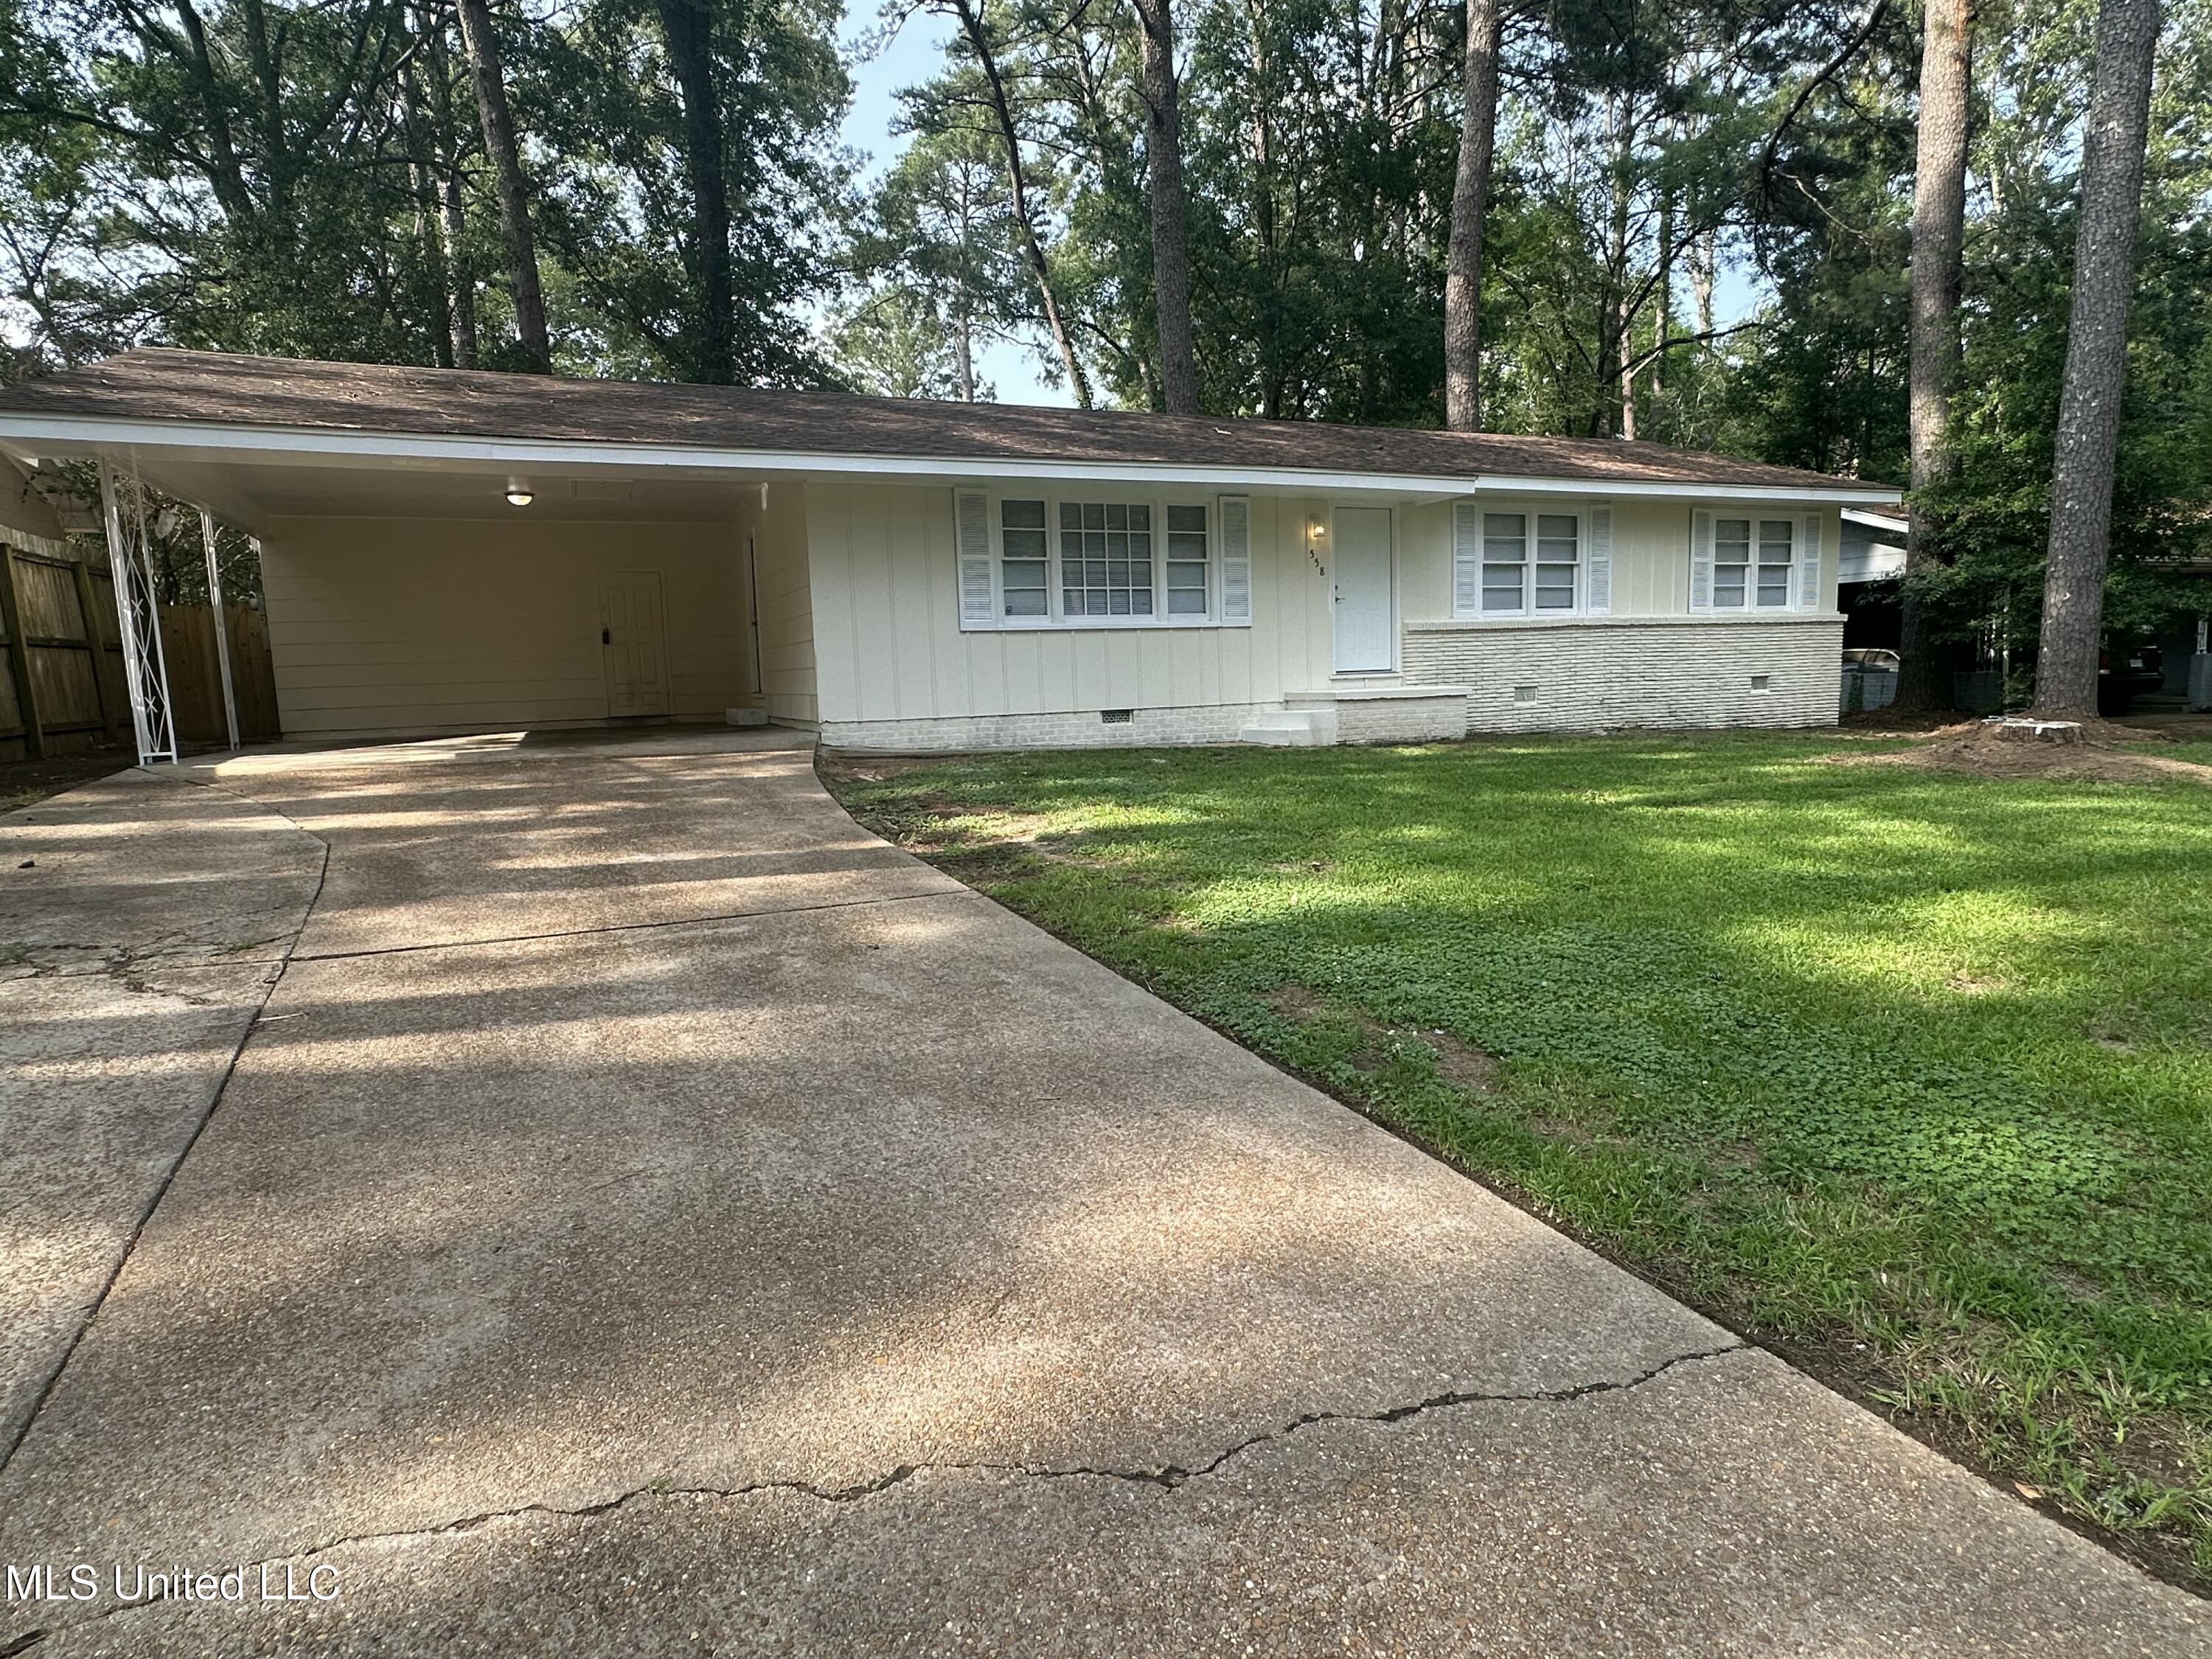
558 Daniel Cir, Jackson, MS 39212
$-10
Cash flow
-0.4%
Cash-on-Cash Return
5.6%
Cap rate
0.8%
Rent to Value Ratio