Mississippi Investment Properties for Sale
Browse homes for sale and investment properties in Mississippi. Refine your search by price, property type, or more.
Best cash flowing properties in Mississippi
Active
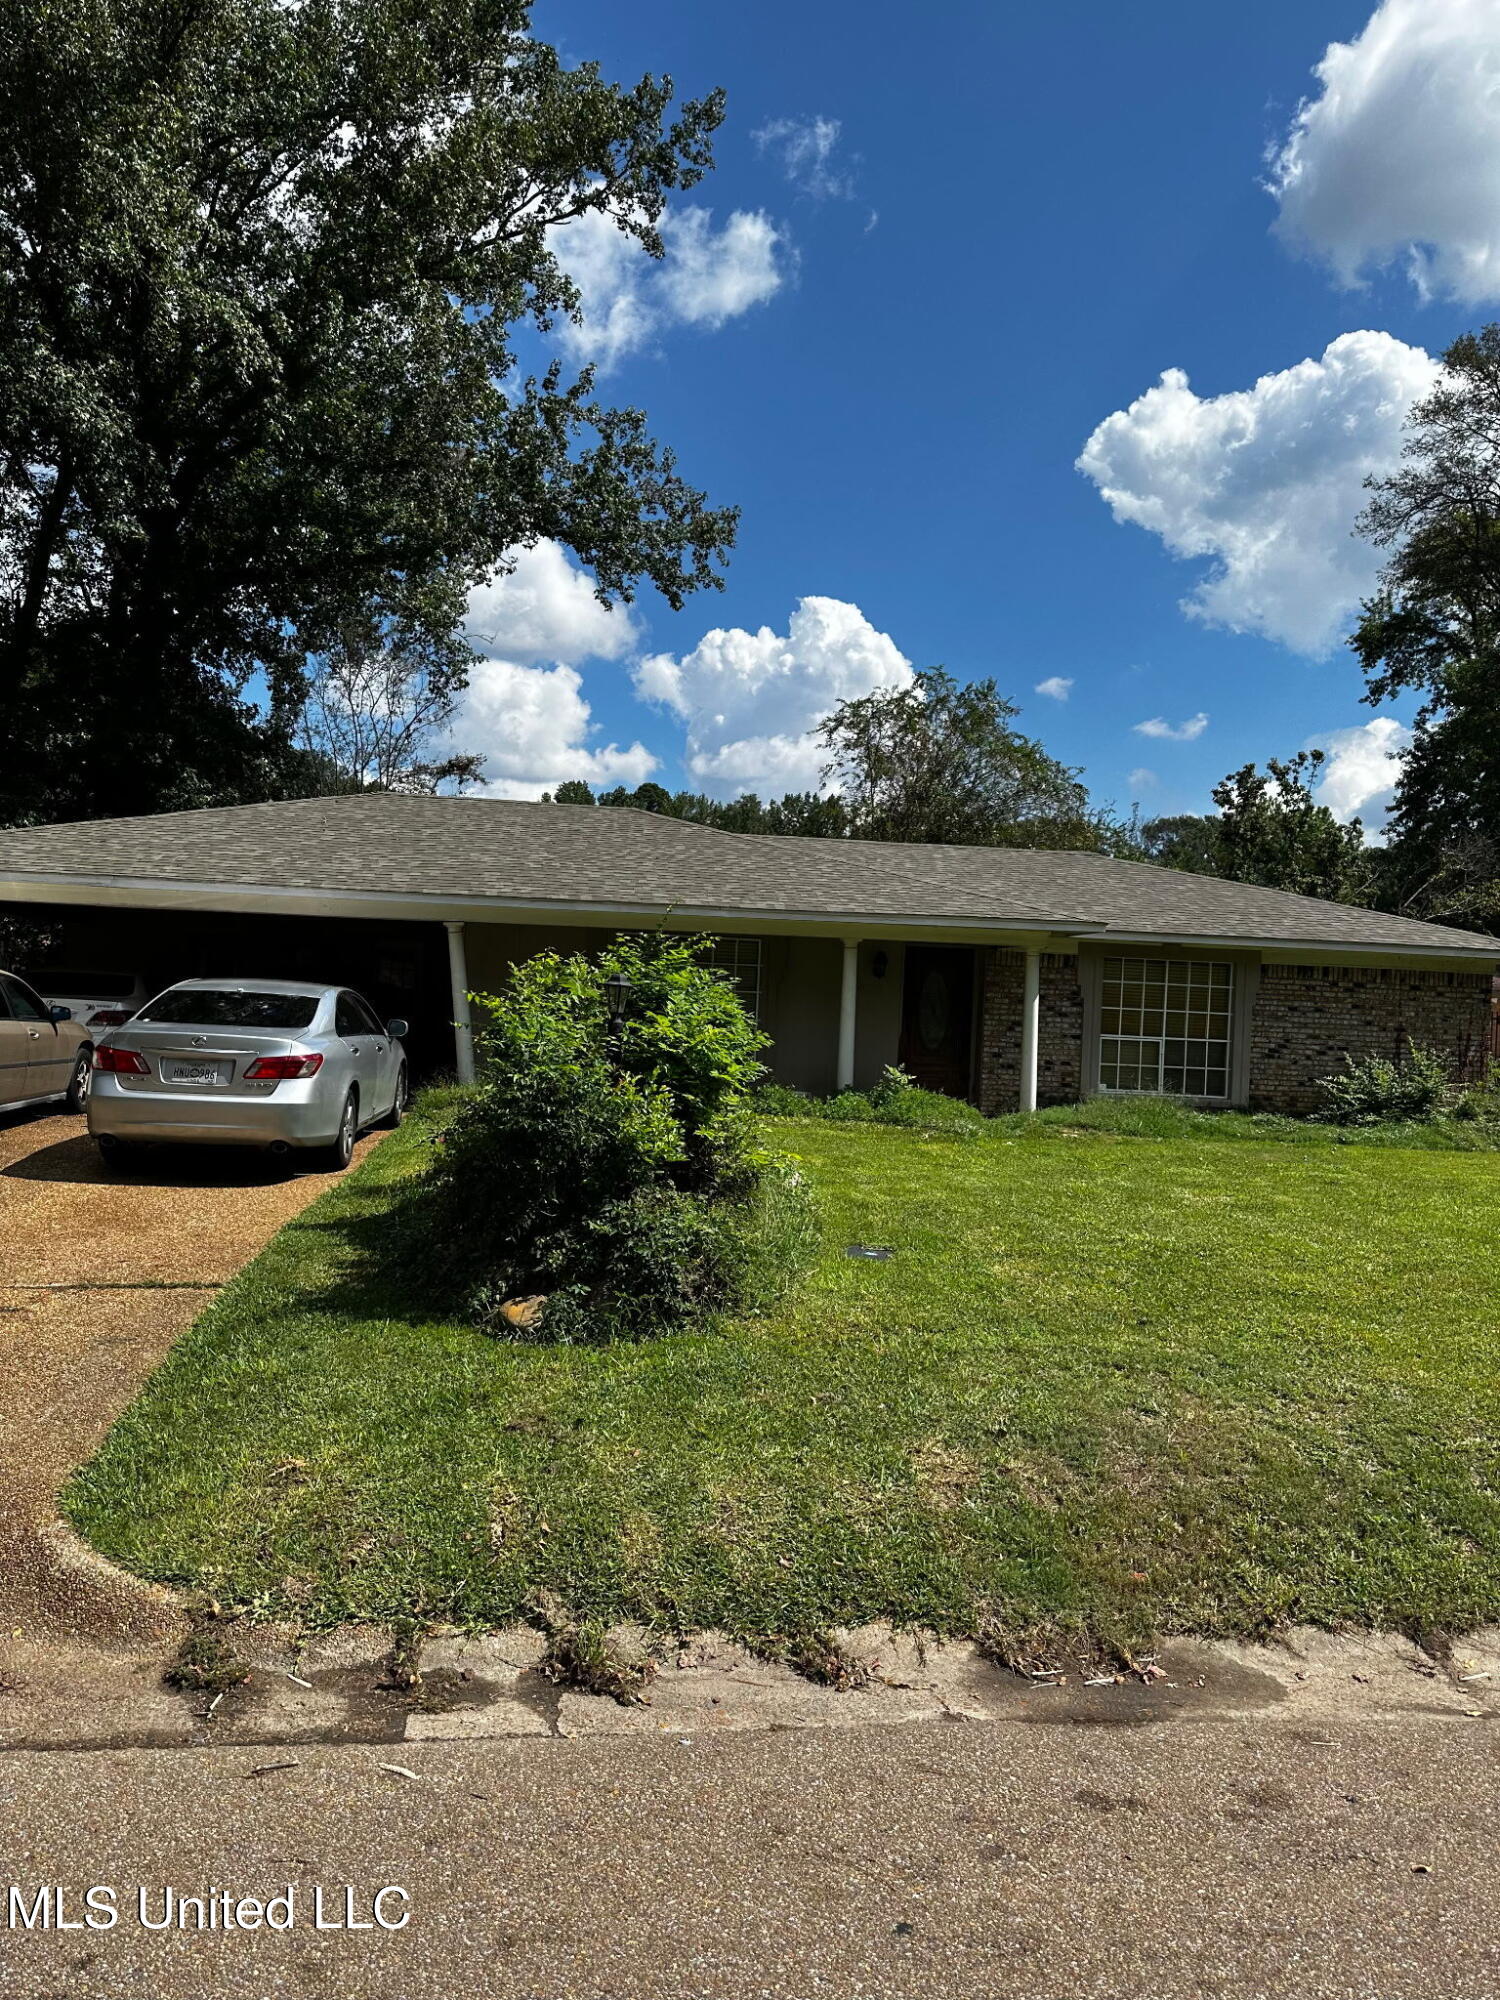
$80,000
3
bds
|
2
ba
|
0
sqft
|
built
1971
4668 Norway Dr, Jackson, MS 39206
$685
Cash flow
44.7%
Cash-on-Cash Return
16.0%
Cap rate
2.3%
Rent to Value Ratio
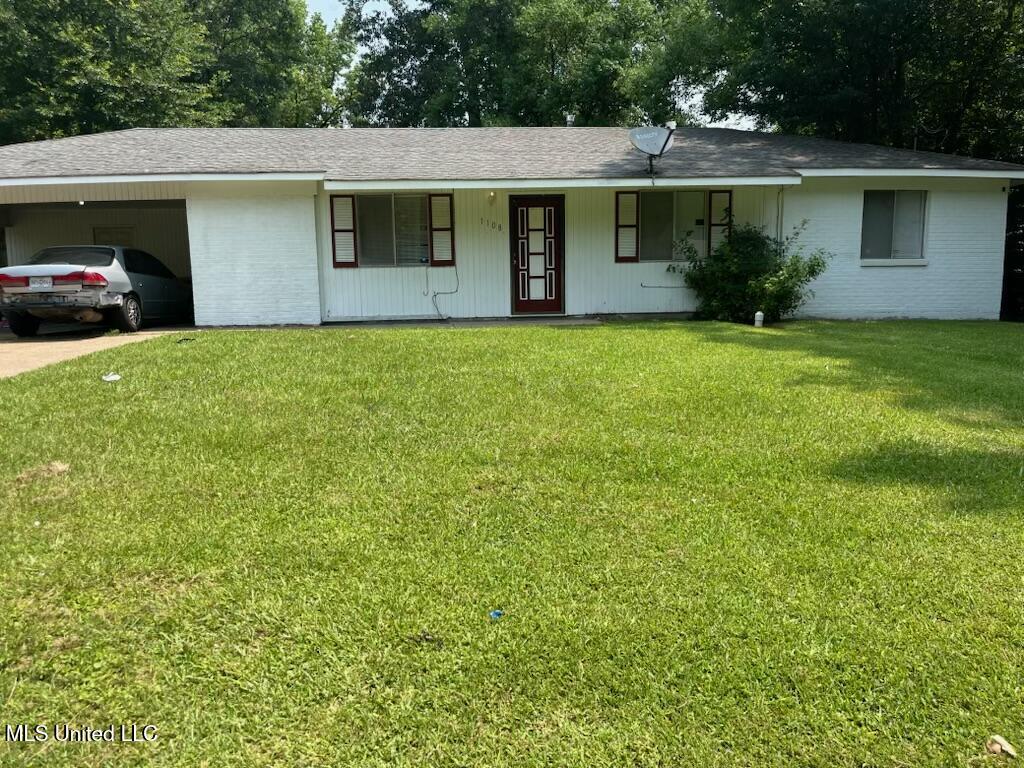
Active
$62,500
2
bds
|
2
ba
|
0
sqft
|
built
1960
1108 Wooddell Dr, Jackson, MS 39212
$643
Cash flow
12.0%
Cash-on-Cash Return
12.3%
Cap rate
1.8%
Rent to Value Ratio
2,913 out of 4,249 properties for sale in Mississippi
Limited Results Shown
Create a free account, or log in to reveal all property listings and enjoy the complete experience.
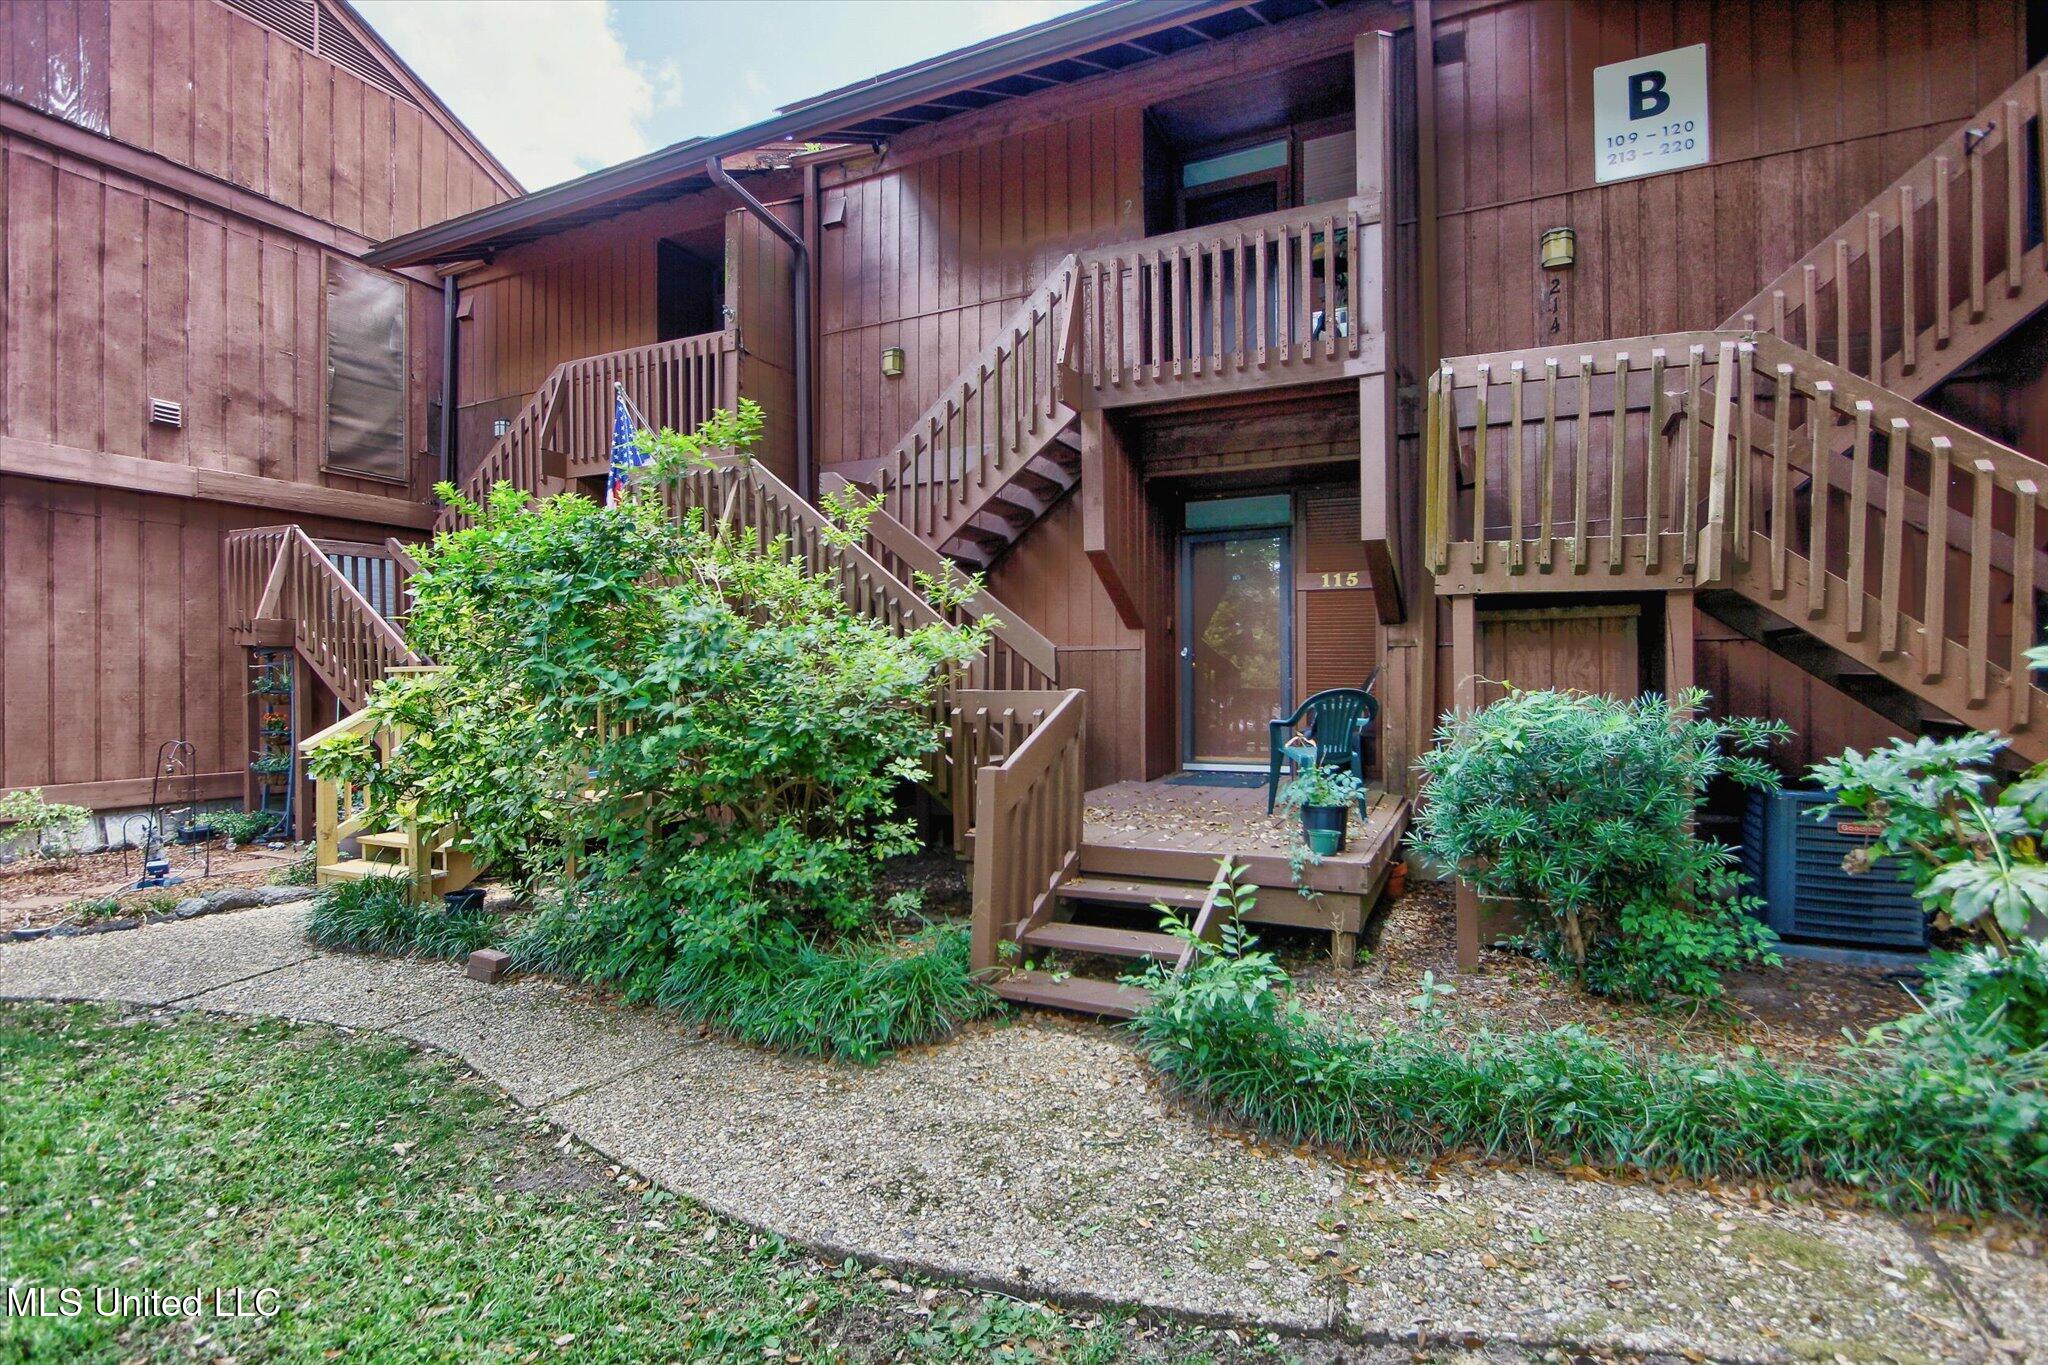
Active
$79,400
bds
|
1
ba
|
0
sqft
|
built
1975
215 Lakeside Villa, Diamondhead, MS 39525
$34
Cash flow
2.2%
Cash-on-Cash Return
6.2%
Cap rate
1.4%
Rent to Value Ratio

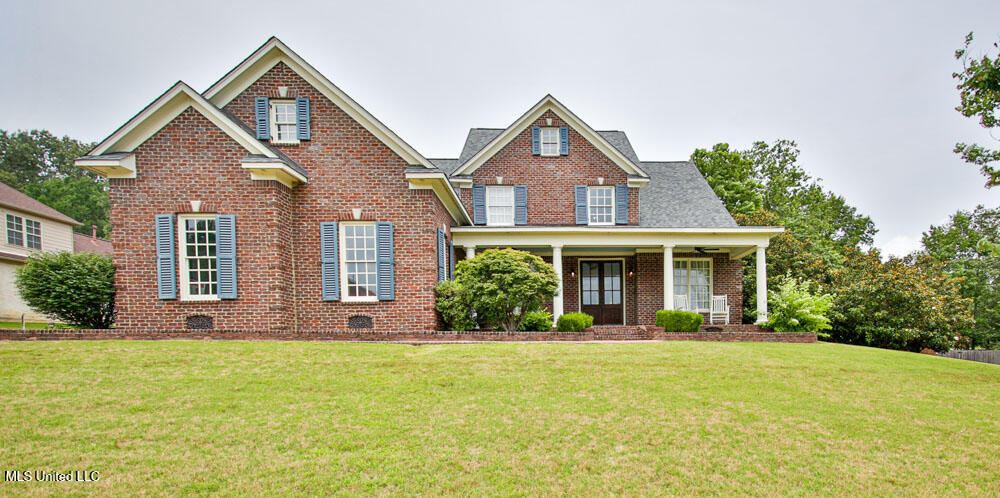
Active
$825,000
4
bds
|
4
ba
|
0
sqft
|
built
2017
1075 Laughter Rd S, Hernando, MS 38632
$-1,021
Cash flow
-6.5%
Cash-on-Cash Return
4.2%
Cap rate
0.5%
Rent to Value Ratio
Active
$575,000
5
bds
|
3
ba
|
0
sqft
|
built
2004
2948 Grove Meadow Dr, Nesbit, MS 38651
$-660
Cash flow
-6.0%
Cash-on-Cash Return
4.3%
Cap rate
0.6%
Rent to Value Ratio
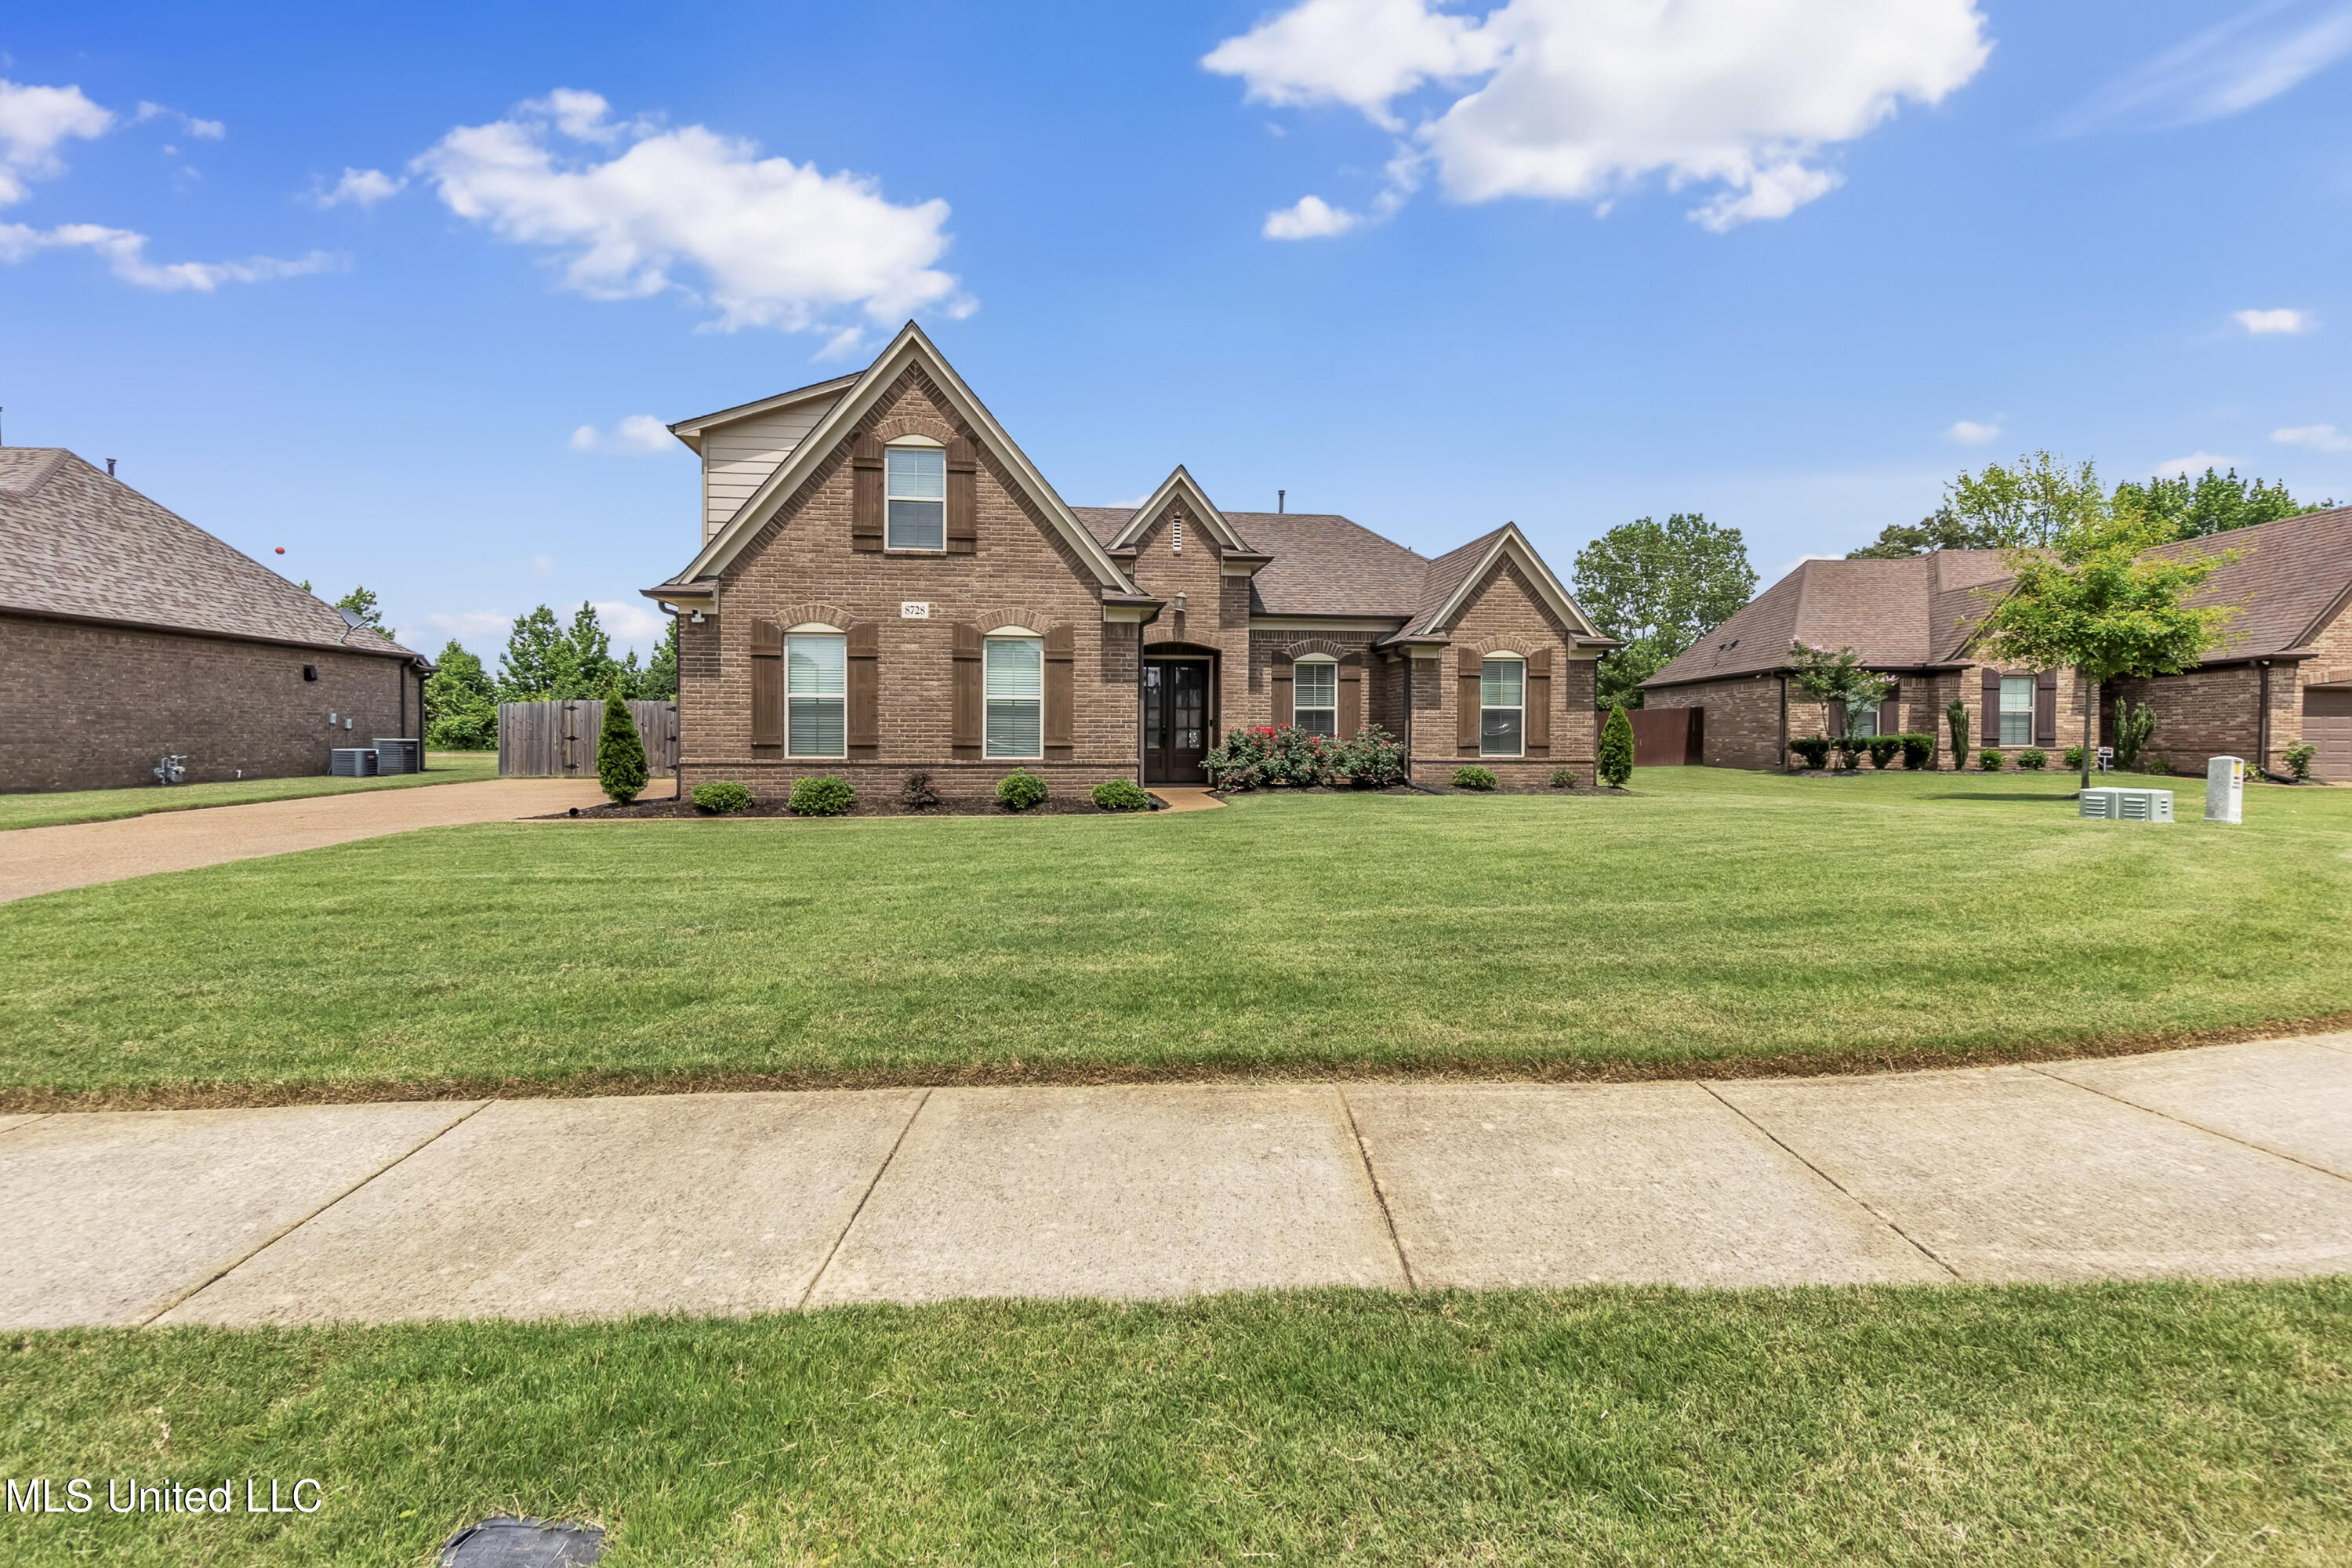
Pending
$350,000
4
bds
|
2
ba
|
0
sqft
|
built
2018
8728 Kenwood Ln, Olive Branch, MS 38654
$-240
Cash flow
-3.6%
Cash-on-Cash Return
4.9%
Cap rate
0.7%
Rent to Value Ratio
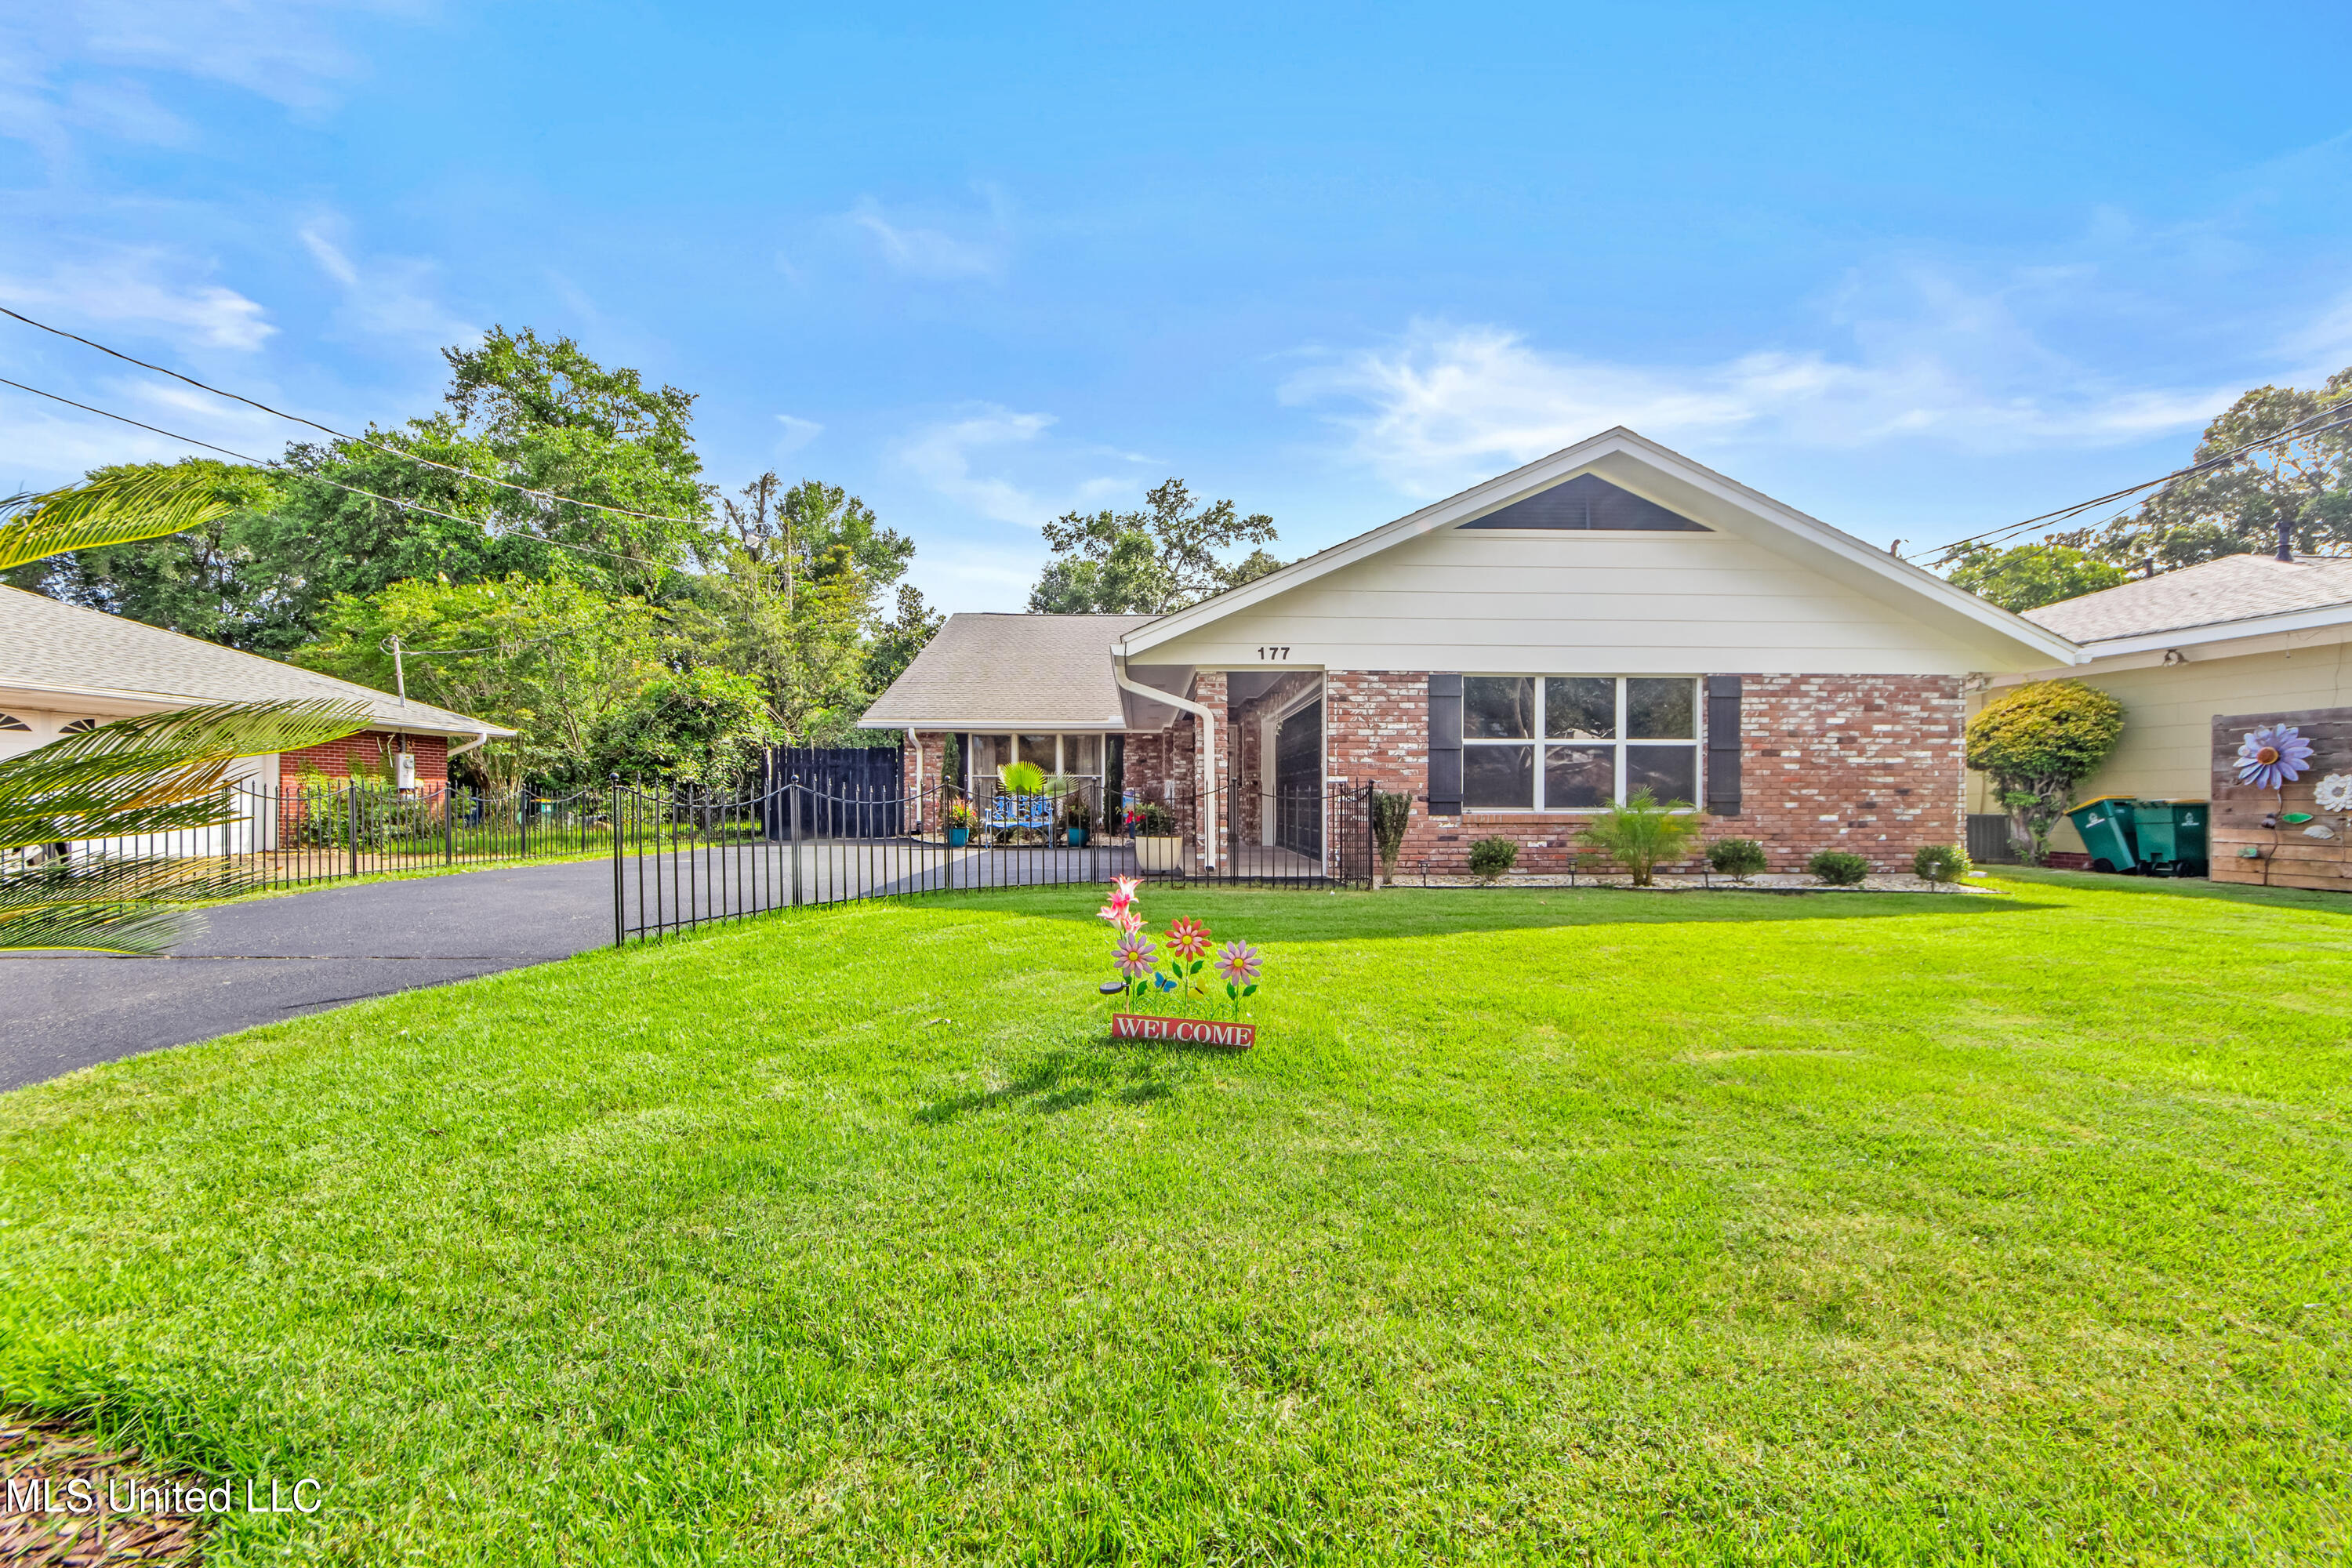
Active
$379,000
3
bds
|
3
ba
|
0
sqft
|
built
1975
177 Edgewater Dr, Biloxi, MS 39531
$-113
Cash flow
-1.6%
Cash-on-Cash Return
5.3%
Cap rate
0.7%
Rent to Value Ratio
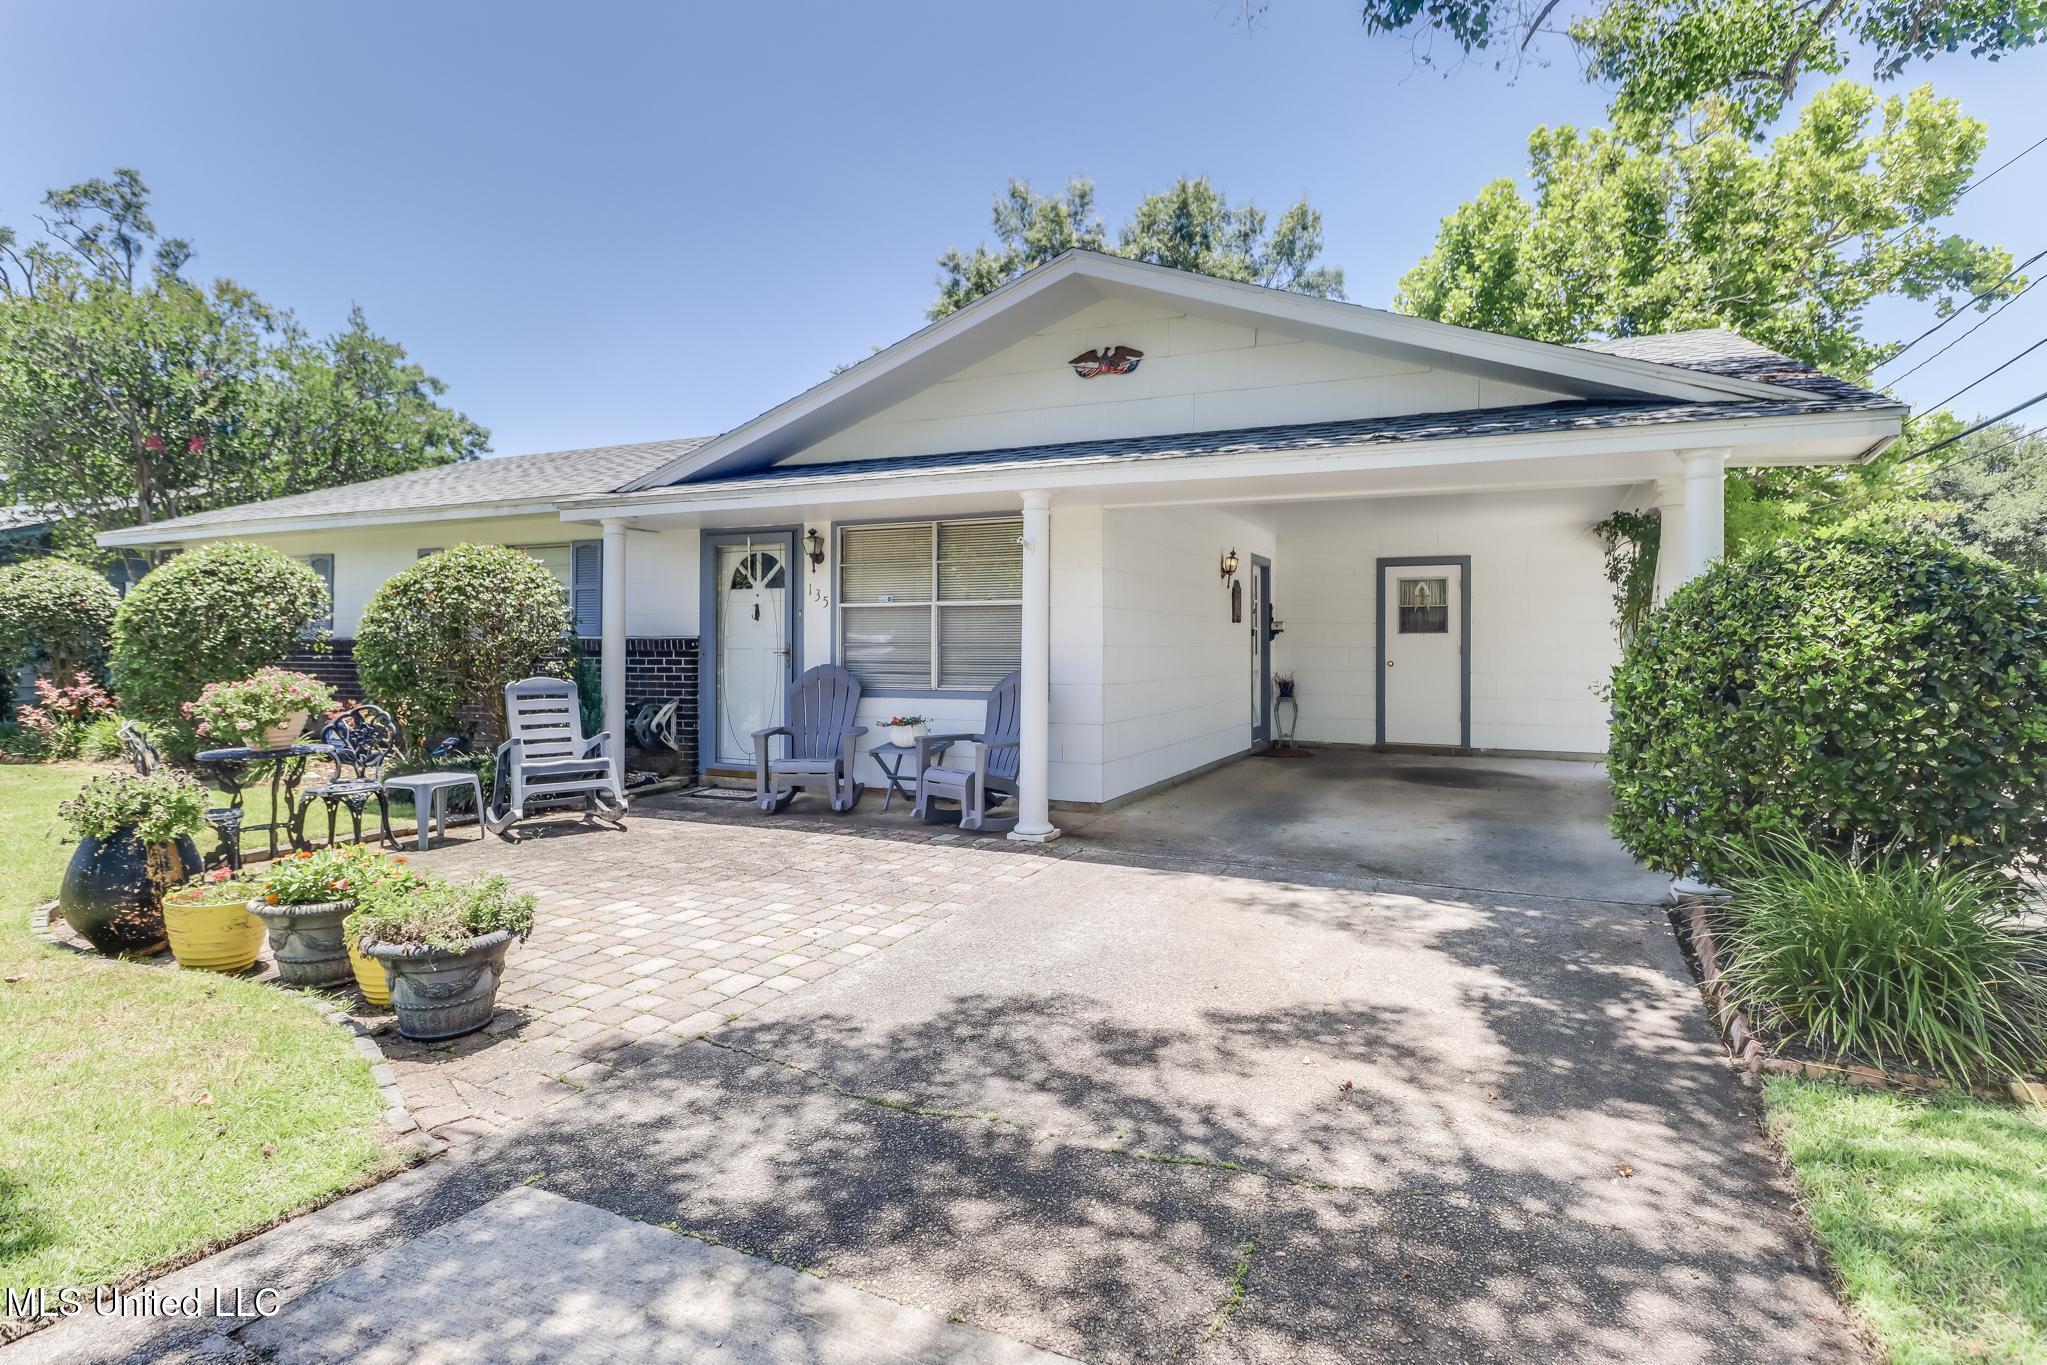
Pending
$239,000
4
bds
|
2
ba
|
0
sqft
|
built
1965
135 Mount Bass, Long Beach, MS 39560
$163
Cash flow
3.6%
Cash-on-Cash Return
6.5%
Cap rate
0.8%
Rent to Value Ratio

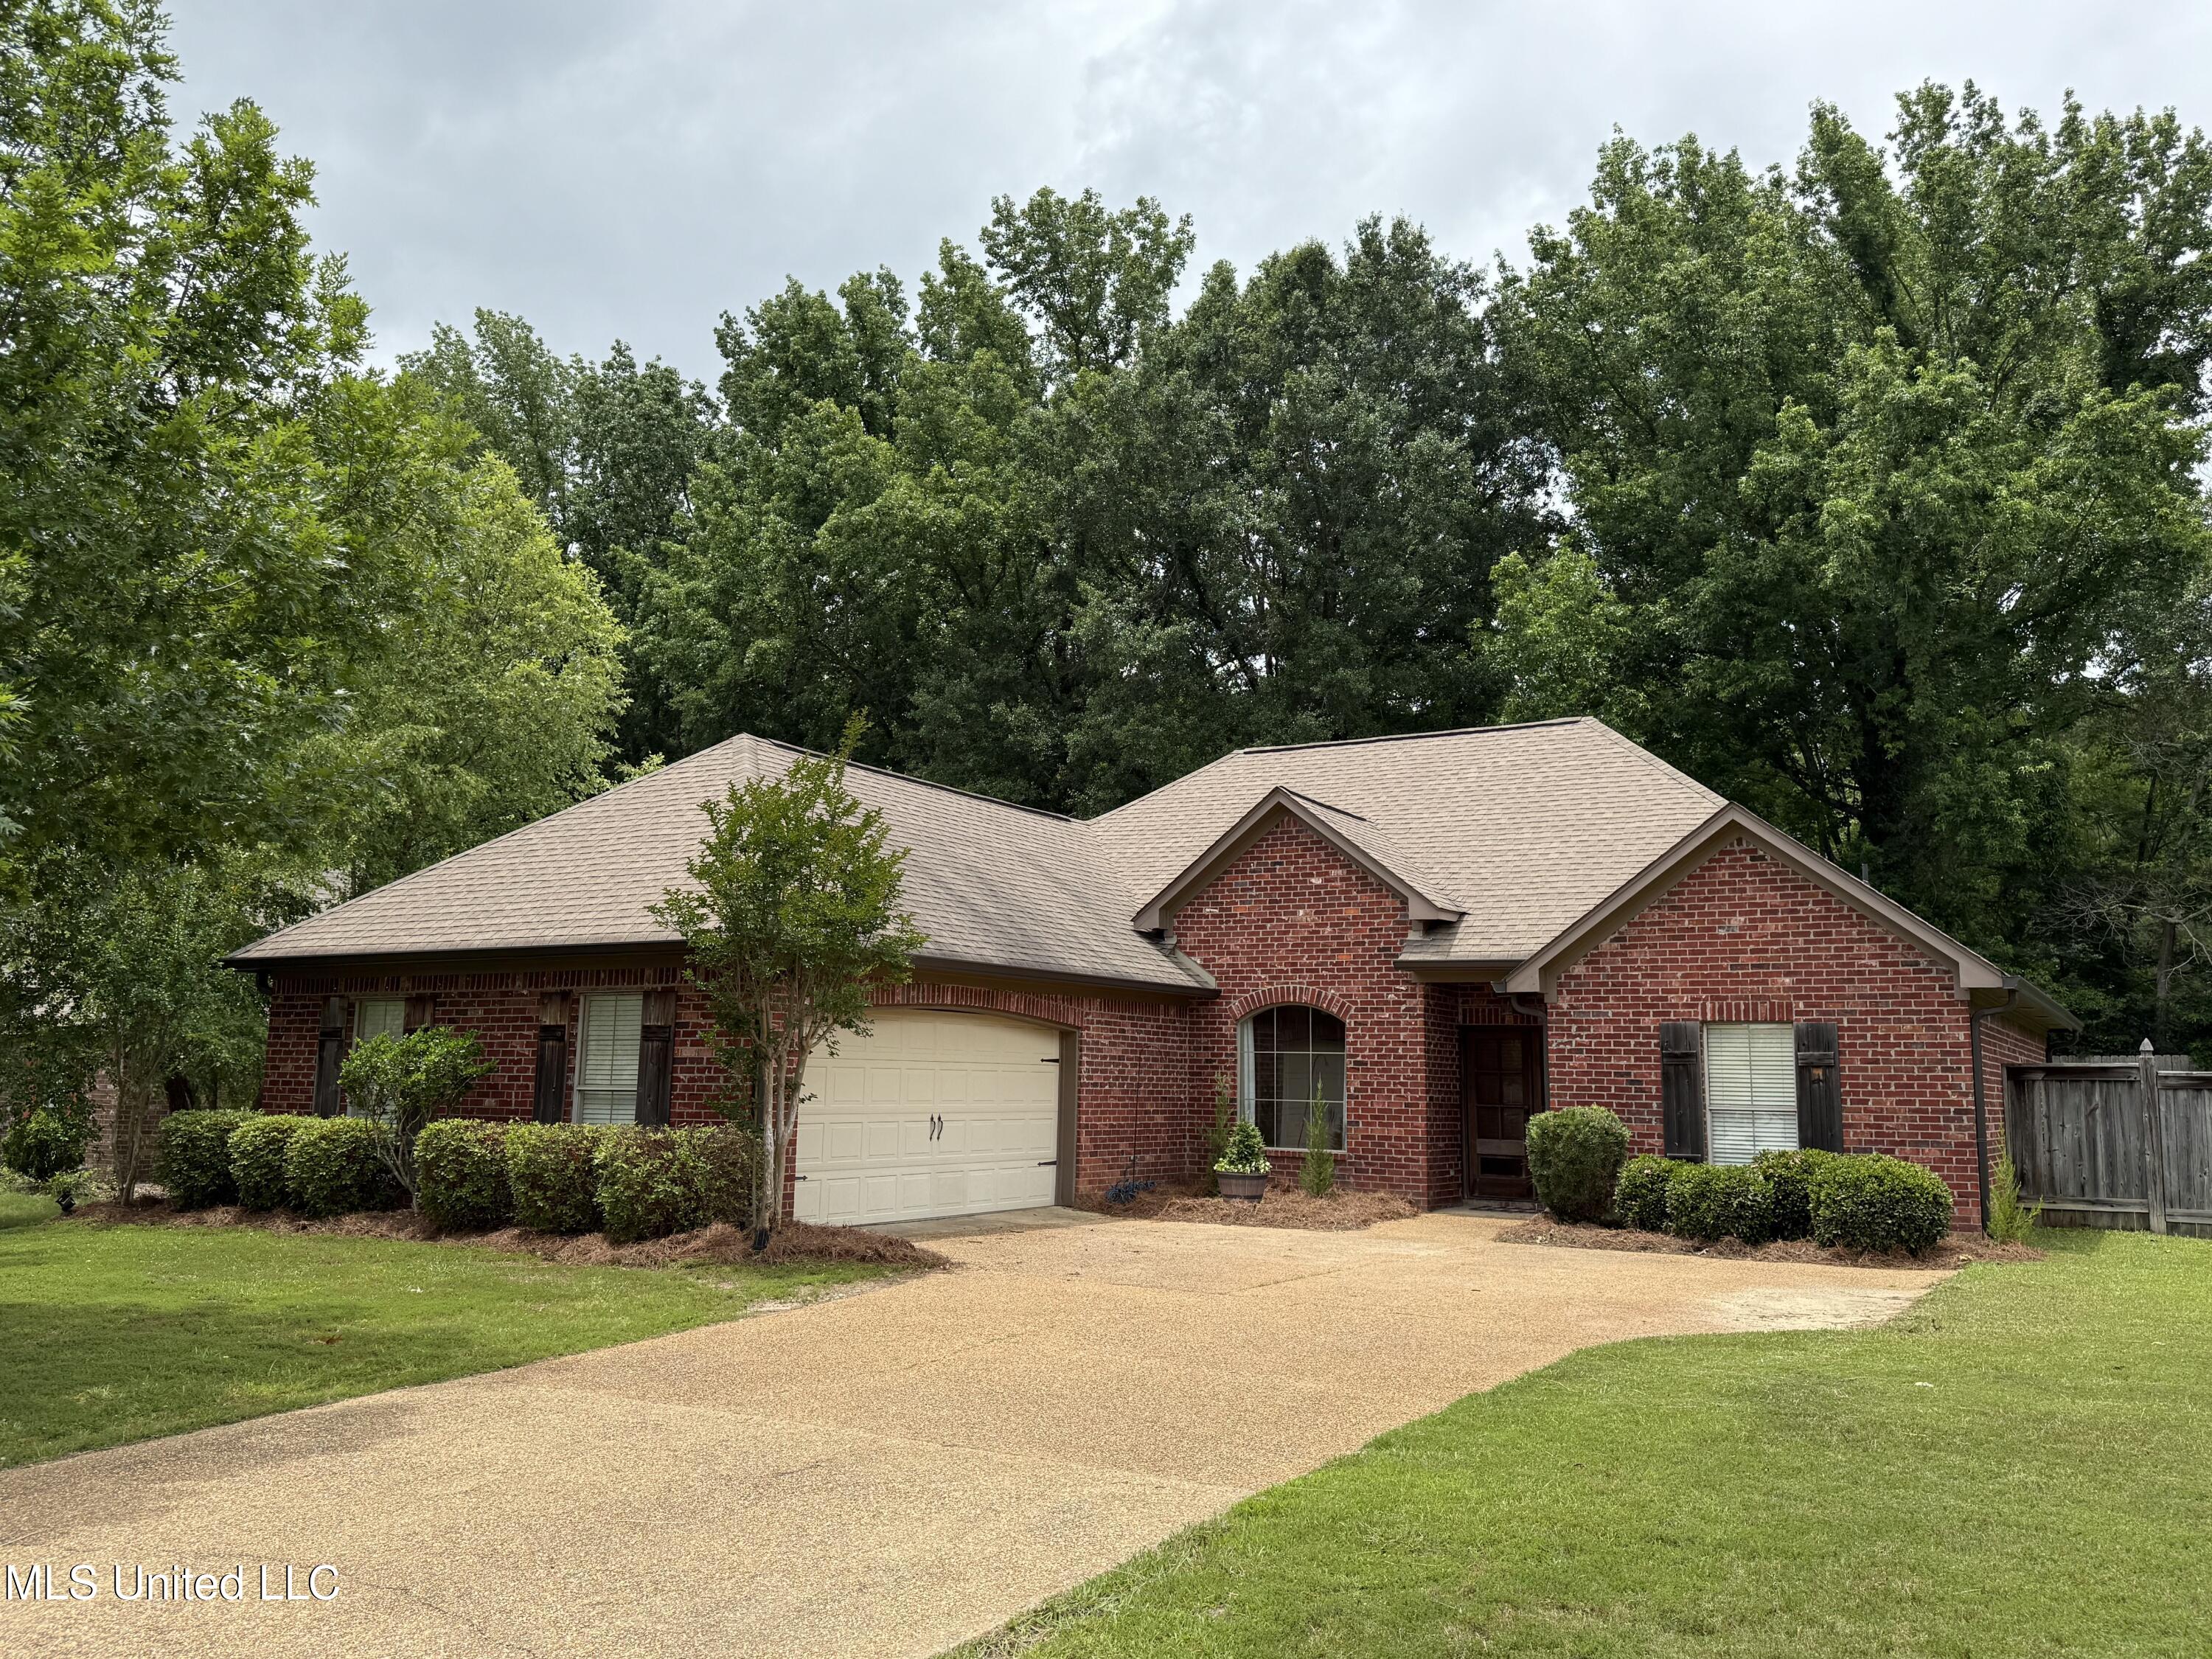
Active
$459,900
4
bds
|
3
ba
|
0
sqft
|
built
1998
6280 Spring Hill Dr, Olive Branch, MS 38654
$-542
Cash flow
-6.1%
Cash-on-Cash Return
4.3%
Cap rate
0.6%
Rent to Value Ratio
Active
$80,000
3
bds
|
2
ba
|
0
sqft
|
built
1971
4668 Norway Dr, Jackson, MS 39206
$685
Cash flow
44.7%
Cash-on-Cash Return
16.0%
Cap rate
2.3%
Rent to Value Ratio

Active
$468,900
4
bds
|
4
ba
|
0
sqft
|
built
2008
3327 Pettingill Way, Hernando, MS 38632
$-262
Cash flow
-2.9%
Cash-on-Cash Return
5.0%
Cap rate
0.7%
Rent to Value Ratio
Active
$310,000
3
bds
|
2
ba
|
0
sqft
|
built
2009
104 Belle Oak Dr, Brandon, MS 39042
$-65
Cash flow
-1.1%
Cash-on-Cash Return
5.4%
Cap rate
0.7%
Rent to Value Ratio
Active
$299,900
3
bds
|
3
ba
|
0
sqft
|
built
1995
315 Wilson Welch Rd, Mendenhall, MS 39114
$15
Cash flow
0.3%
Cash-on-Cash Return
5.7%
Cap rate
0.7%
Rent to Value Ratio
Active
$62,500
2
bds
|
2
ba
|
0
sqft
|
built
1960
1108 Wooddell Dr, Jackson, MS 39212
$643
Cash flow
12.0%
Cash-on-Cash Return
12.3%
Cap rate
1.8%
Rent to Value Ratio
Active
$180,000
2
bds
|
2
ba
|
0
sqft
|
built
1972
4783 Village Dr, Jackson, MS 39206
$-88
Cash flow
-2.6%
Cash-on-Cash Return
5.1%
Cap rate
0.8%
Rent to Value Ratio
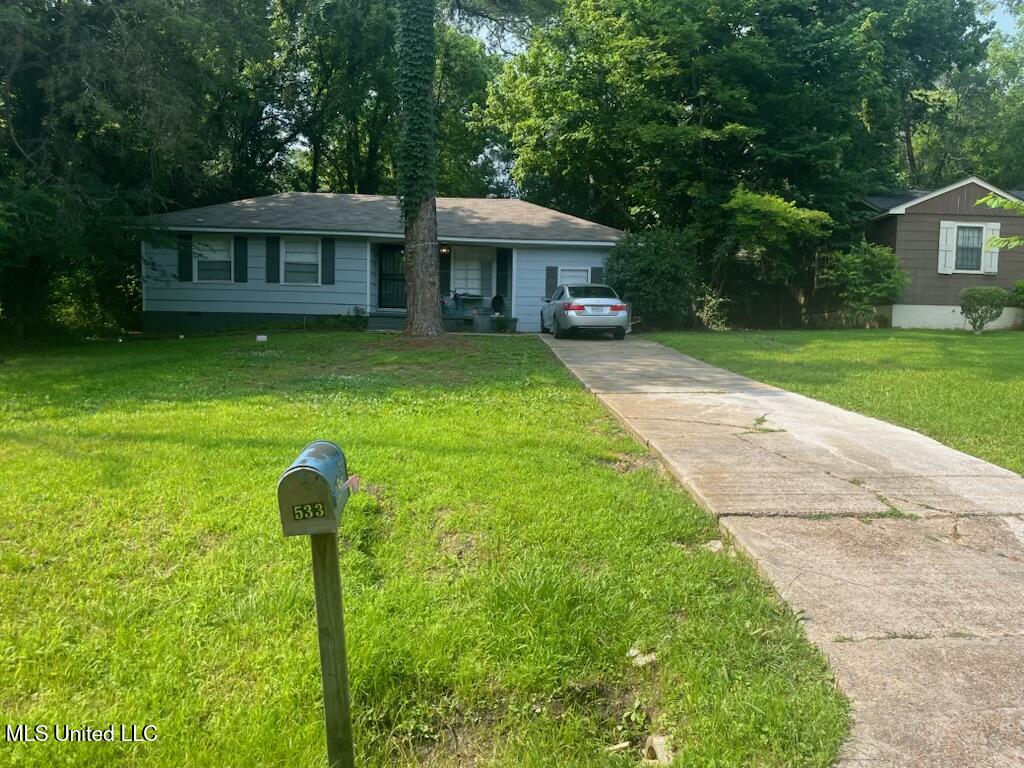
Active
$115,000
4
bds
|
2
ba
|
0
sqft
|
built
1953
533 Lawrence Rd, Jackson, MS 39206
$312
Cash flow
14.2%
Cash-on-Cash Return
8.9%
Cap rate
1.2%
Rent to Value Ratio
Active
$160,000
3
bds
|
2
ba
|
0
sqft
|
built
1974
15449 Mimosa Dr, Gulfport, MS 39503
$481
Cash flow
15.7%
Cash-on-Cash Return
9.3%
Cap rate
1.2%
Rent to Value Ratio

Active
$290,000
3
bds
|
2
ba
|
0
sqft
|
built
1994
83158 Lola Dr, Diamondhead, MS 39525
$-129
Cash flow
-2.3%
Cash-on-Cash Return
5.1%
Cap rate
0.8%
Rent to Value Ratio
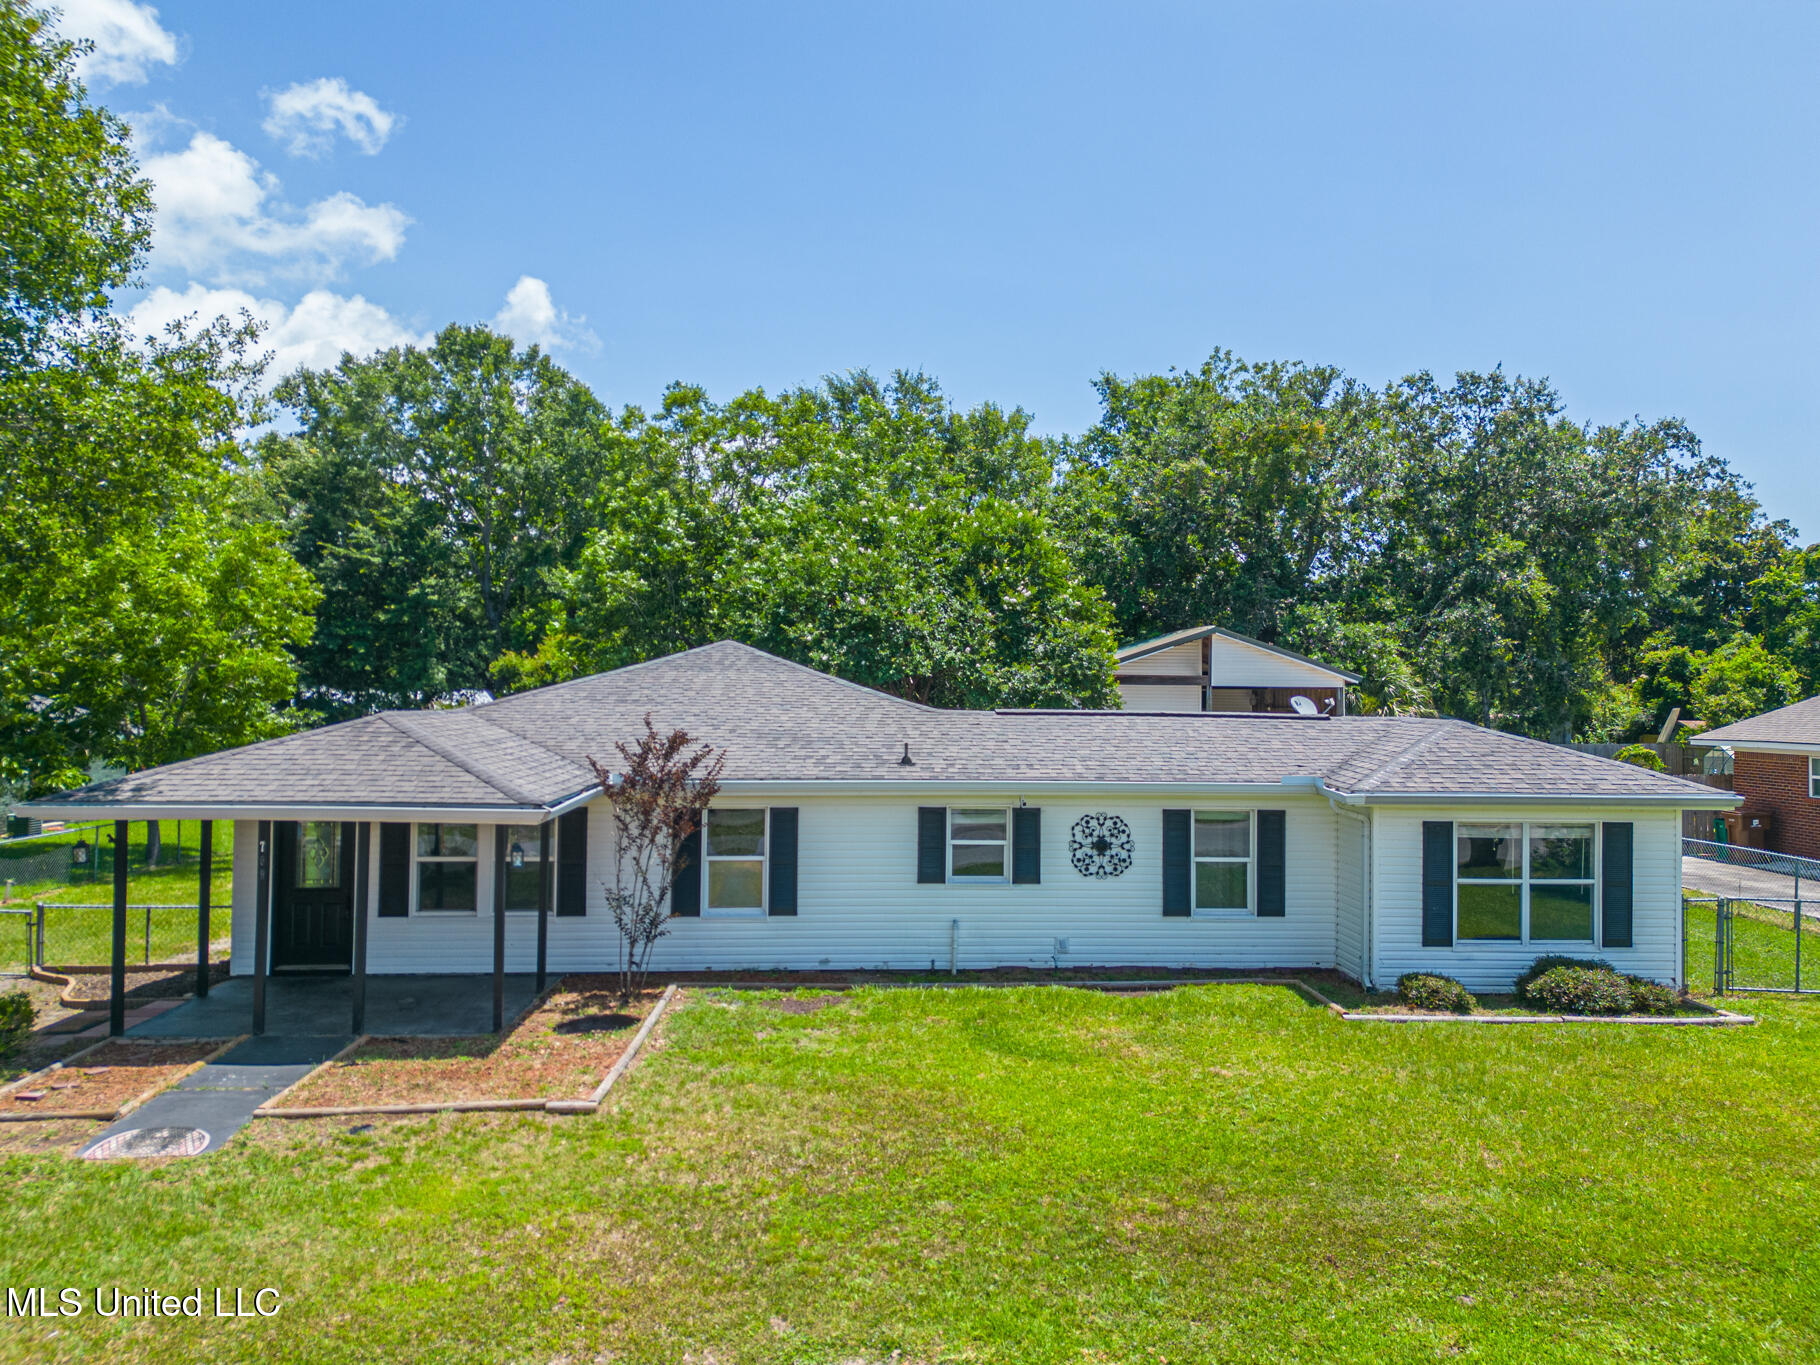
Pending
$239,500
5
bds
|
3
ba
|
0
sqft
|
built
1955
709 Gardendale Ave, Long Beach, MS 39560
$-13
Cash flow
-0.3%
Cash-on-Cash Return
5.6%
Cap rate
0.8%
Rent to Value Ratio
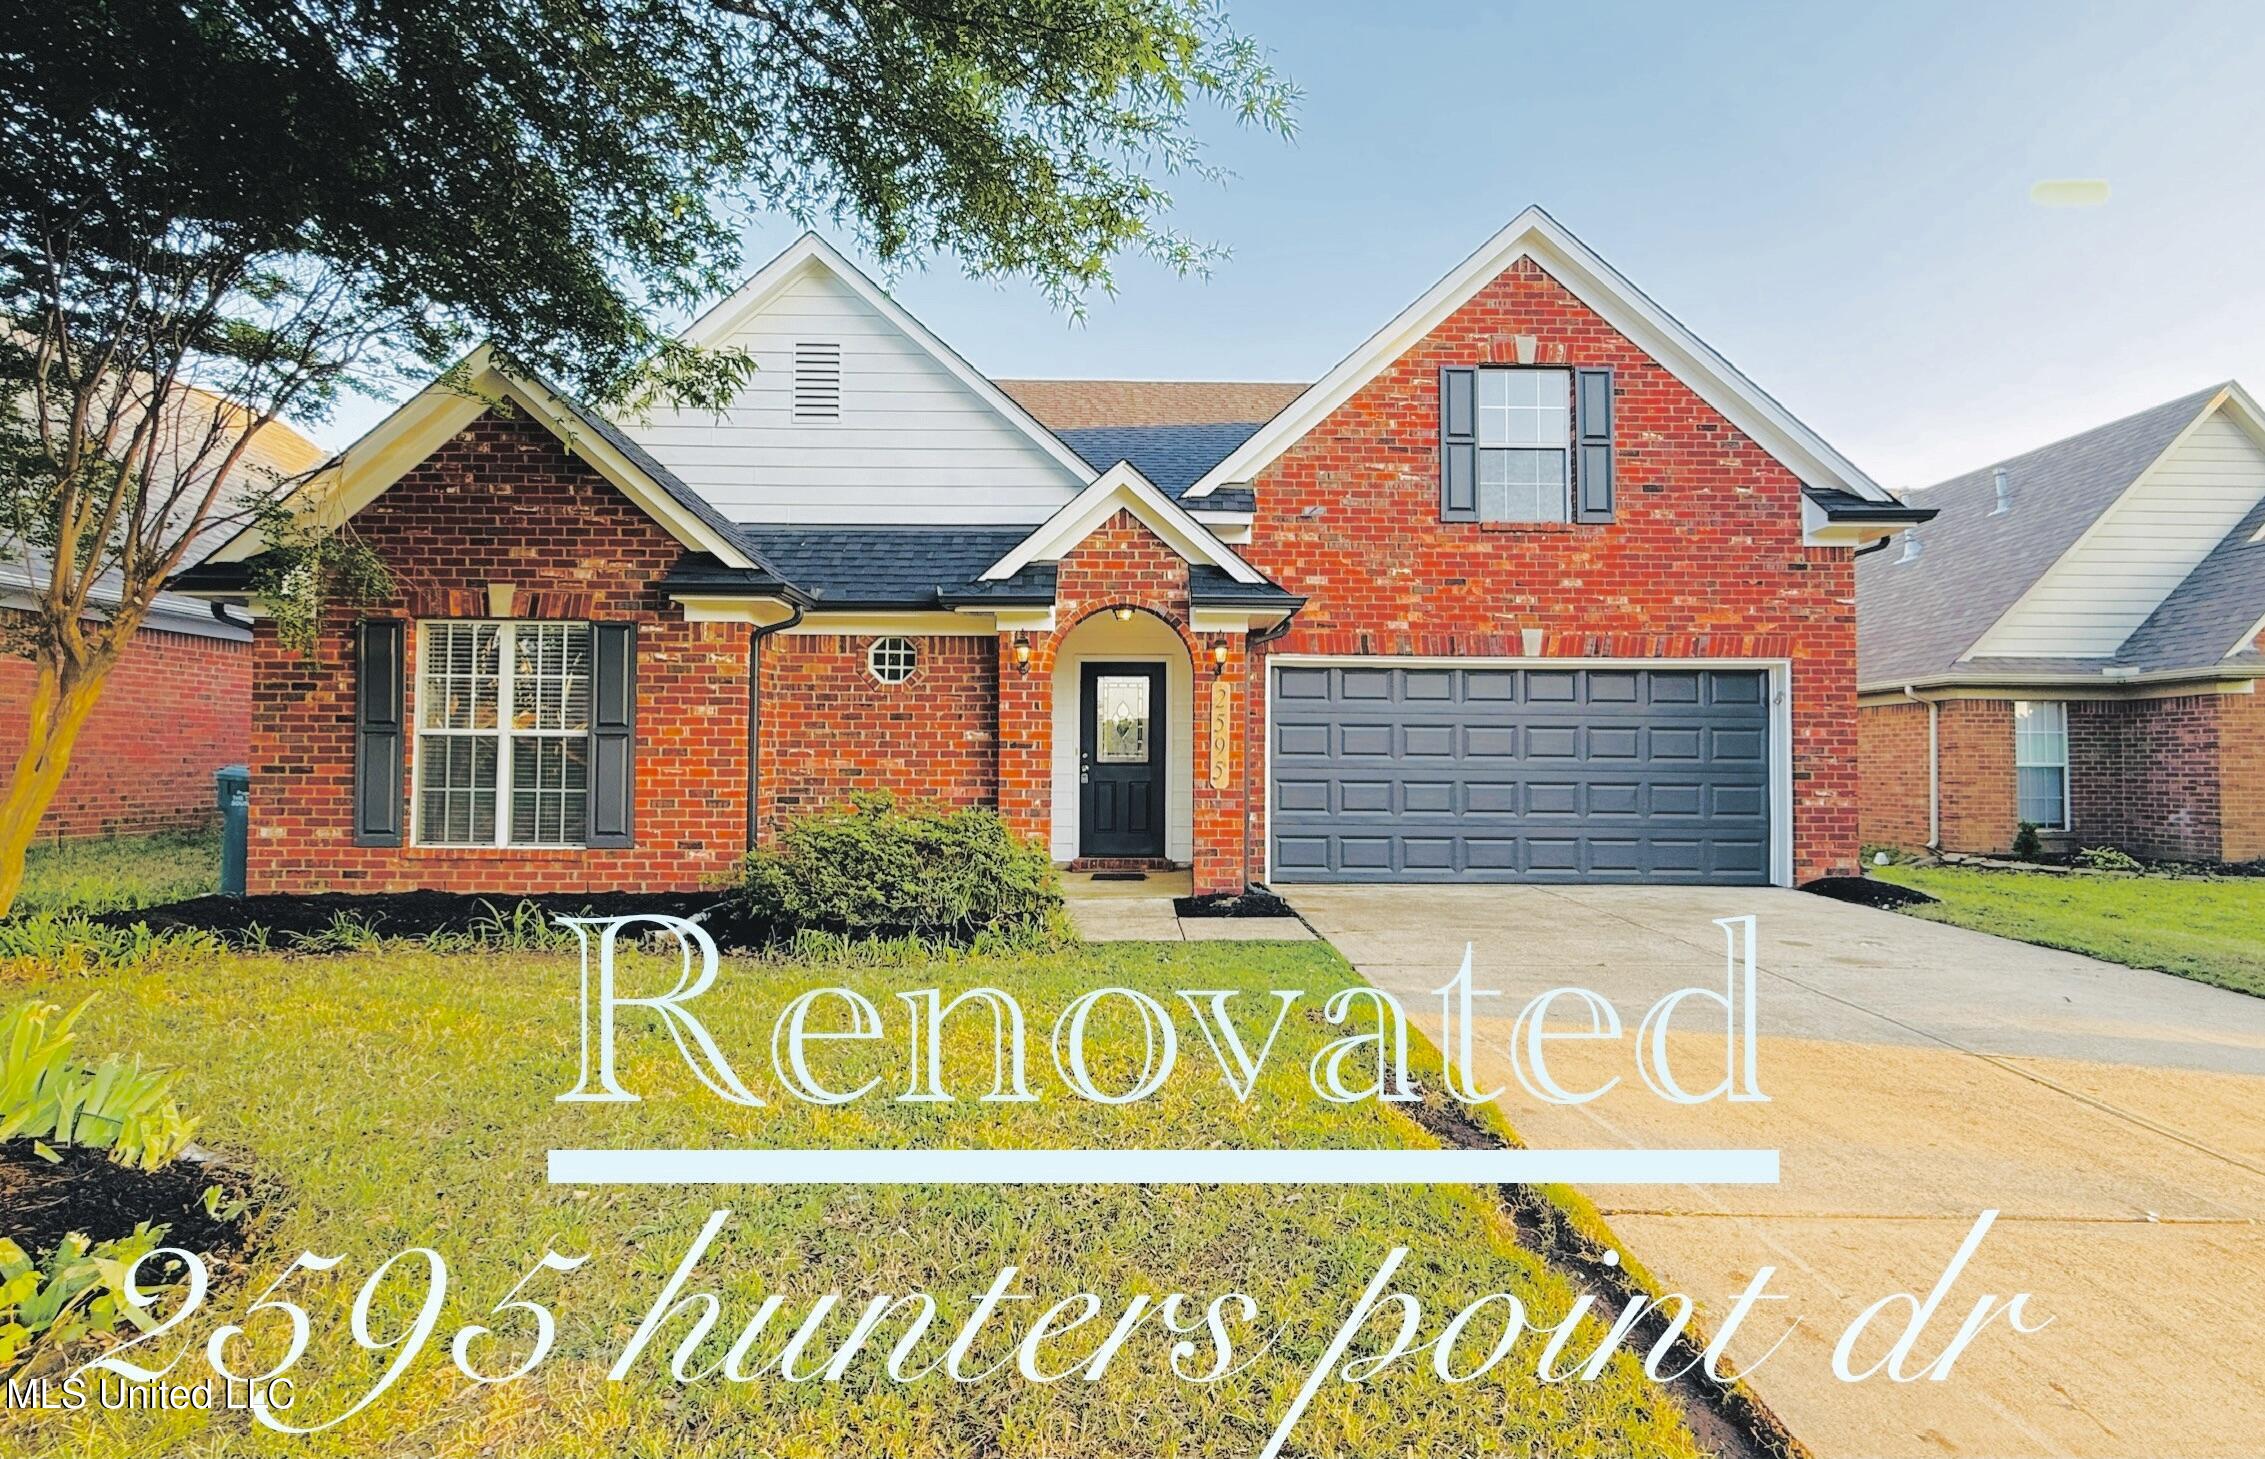
Active
$309,990
3
bds
|
2
ba
|
0
sqft
|
built
2003
2595 Hunters Pointe Dr, Southaven, MS 38672
$-18
Cash flow
-0.3%
Cash-on-Cash Return
5.6%
Cap rate
0.7%
Rent to Value Ratio
Active
$399,000
2
bds
|
3
ba
|
0
sqft
|
built
1988
107 Lakepointe Dr, Madison, MS 39110
$-424
Cash flow
-5.5%
Cash-on-Cash Return
4.4%
Cap rate
0.6%
Rent to Value Ratio

Pending
$315,000
3
bds
|
2
ba
|
0
sqft
|
built
1998
1415 Windrose Dr, Brandon, MS 39047
$-114
Cash flow
-1.9%
Cash-on-Cash Return
5.2%
Cap rate
0.7%
Rent to Value Ratio
Active
$385,000
3
bds
|
2
ba
|
0
sqft
|
built
1968
707 Holly Hills Dr, Biloxi, MS 39532
$112
Cash flow
1.5%
Cash-on-Cash Return
6.0%
Cap rate
0.8%
Rent to Value Ratio
Active
$195,000
3
bds
|
2
ba
|
0
sqft
|
built
1979
8720 Manini Way, Diamondhead, MS 39525
$227
Cash flow
6.1%
Cash-on-Cash Return
7.1%
Cap rate
0.9%
Rent to Value Ratio
Active
$234,900
4
bds
|
3
ba
|
0
sqft
|
built
1960
2548 Bryn Mawr Ave, Biloxi, MS 39531
$278
Cash flow
6.2%
Cash-on-Cash Return
7.1%
Cap rate
0.9%
Rent to Value Ratio
Active
$799,500
5
bds
|
5
ba
|
0
sqft
|
built
2002
308 Pinehurst Cir, Ridgeland, MS 39157
$-1,374
Cash flow
-9.0%
Cash-on-Cash Return
3.6%
Cap rate
0.5%
Rent to Value Ratio
Pending
$195,000
4
bds
|
2
ba
|
0
sqft
|
built
1971
4210 Evie St, Pascagoula, MS 39581
$344
Cash flow
9.2%
Cash-on-Cash Return
7.8%
Cap rate
1.0%
Rent to Value Ratio

Active
$379,000
3
bds
|
3
ba
|
0
sqft
|
built
1975
727 Laney Dr, Clinton, MS 39056
$-441
Cash flow
-6.1%
Cash-on-Cash Return
4.3%
Cap rate
0.5%
Rent to Value Ratio
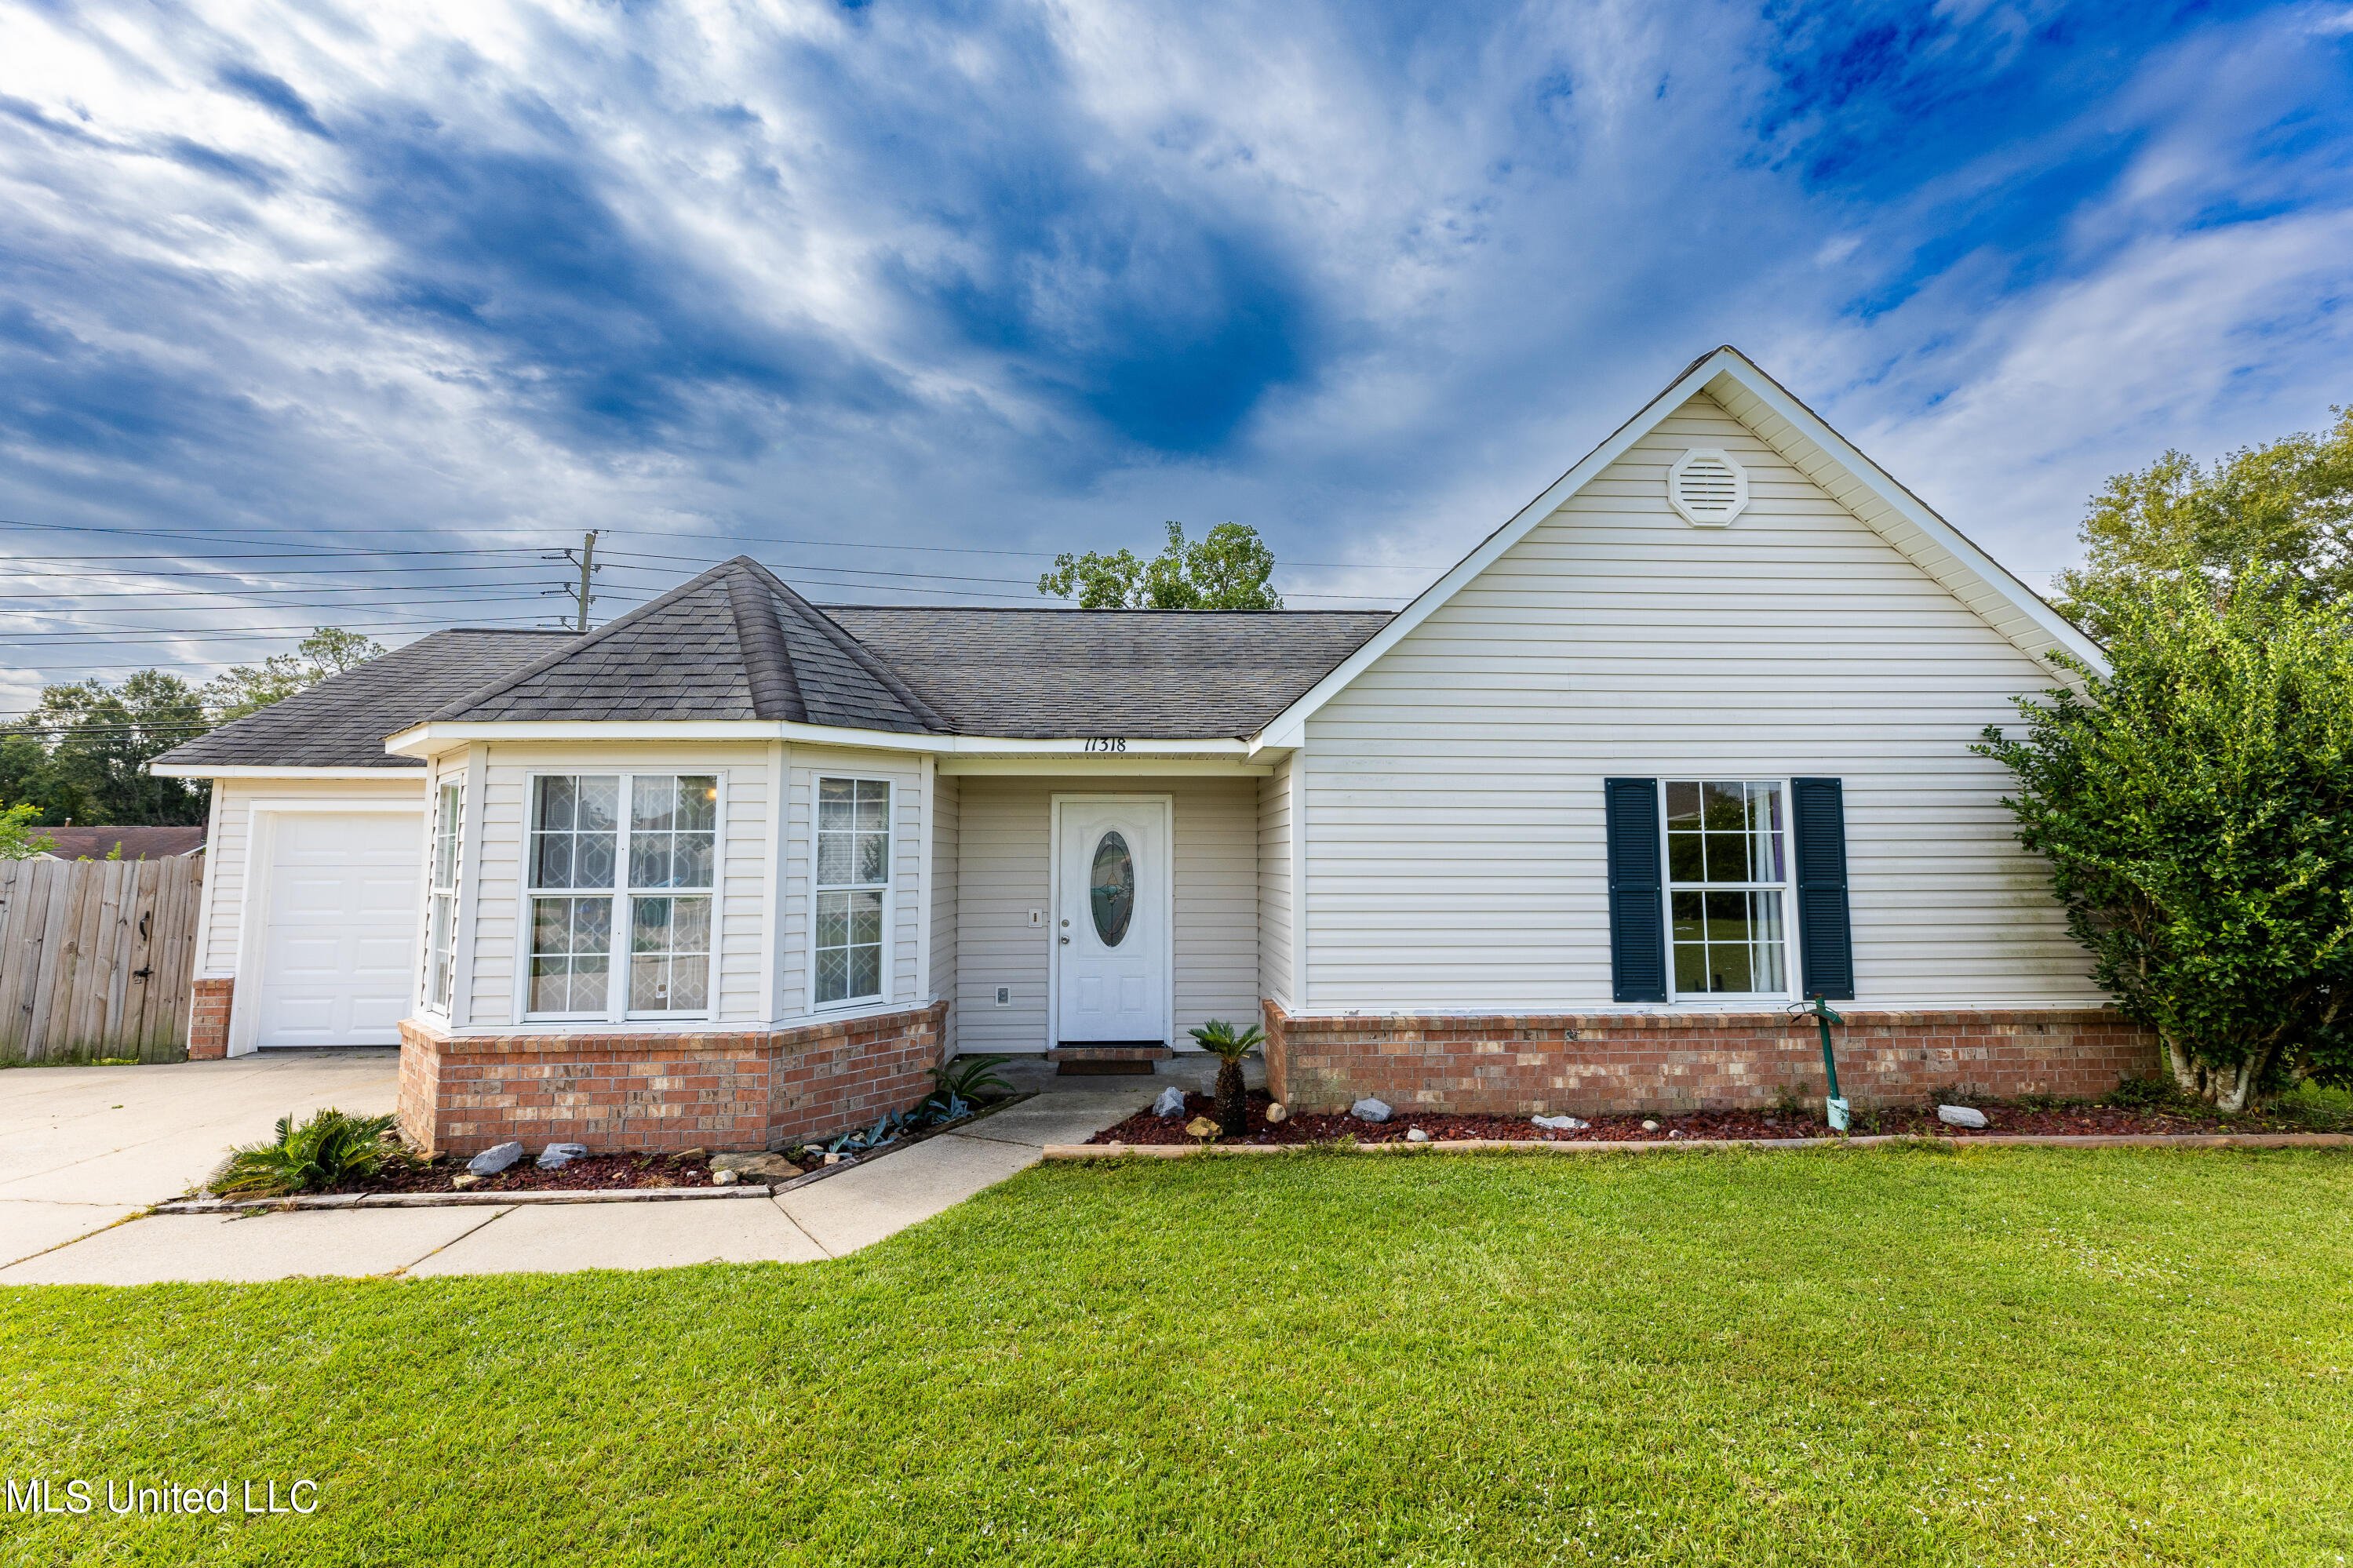
Active
$168,900
3
bds
|
2
ba
|
0
sqft
|
built
2001
11318 Fairfield Ln, Gulfport, MS 39503
$287
Cash flow
8.9%
Cash-on-Cash Return
7.7%
Cap rate
0.9%
Rent to Value Ratio

Active
$449,900
3
bds
|
3
ba
|
0
sqft
|
built
1987
164 Balmoral Ave, Biloxi, MS 39531
$-207
Cash flow
-2.4%
Cash-on-Cash Return
5.1%
Cap rate
0.7%
Rent to Value Ratio
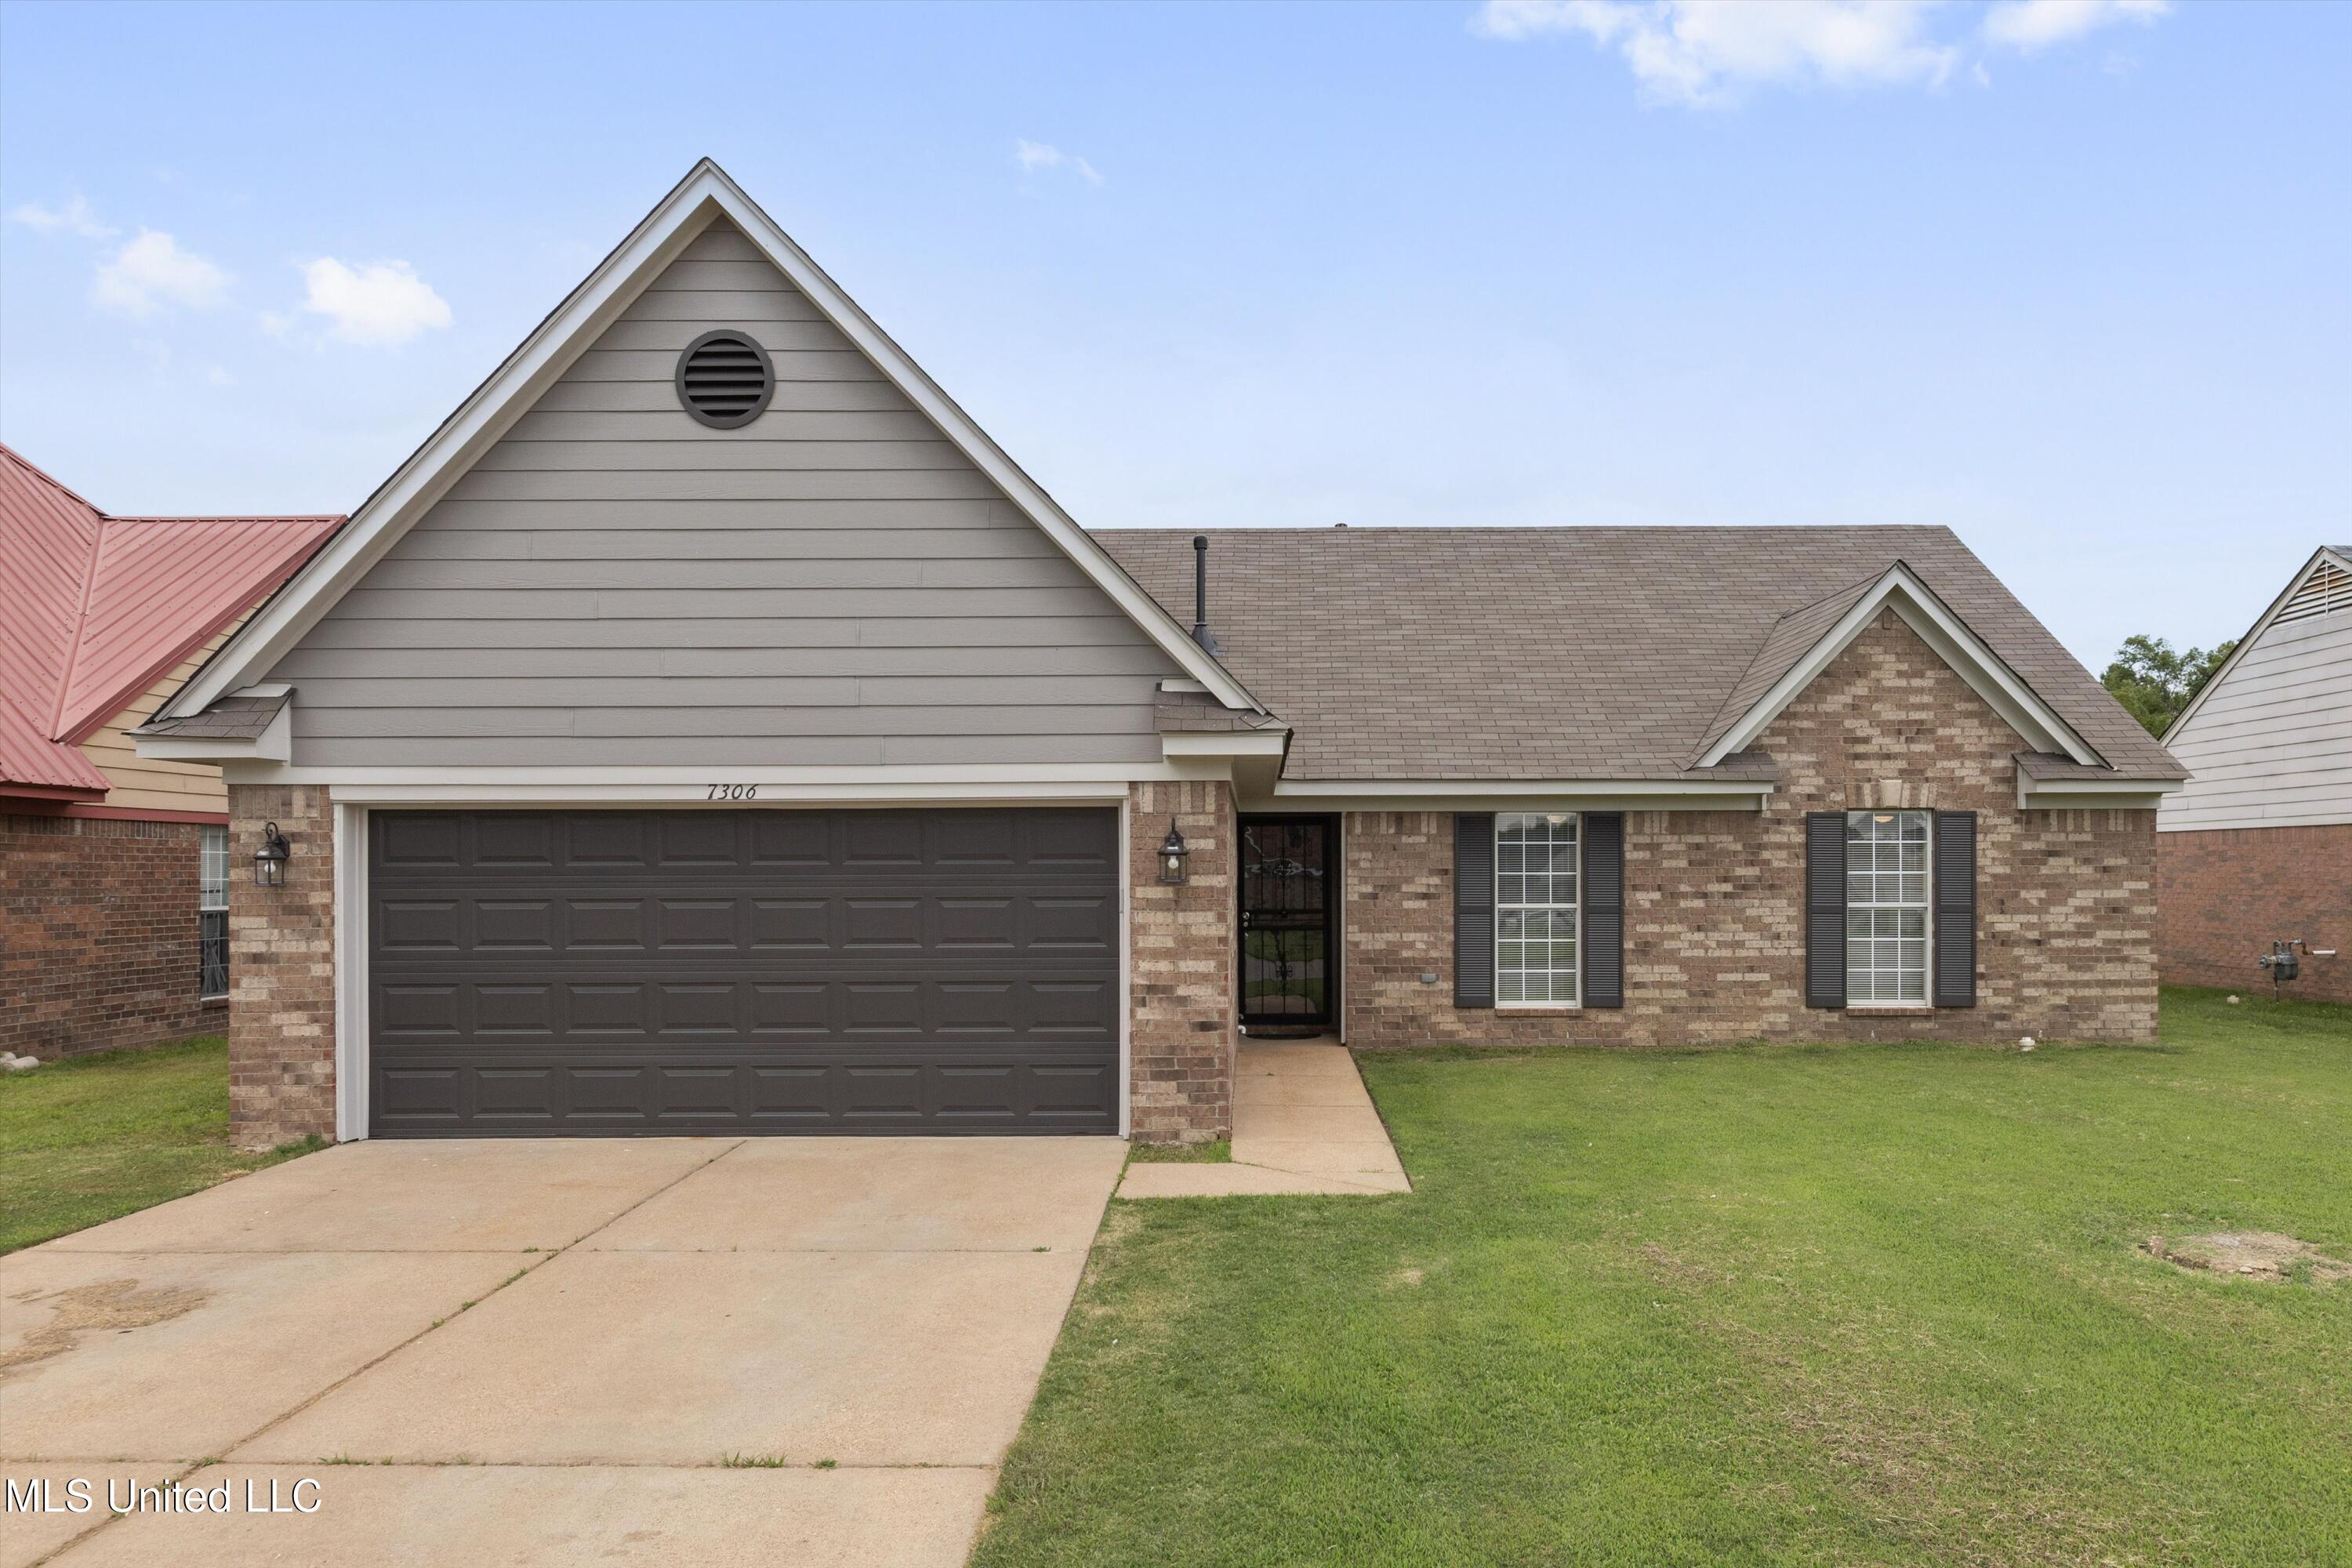
Pending
$255,000
3
bds
|
2
ba
|
0
sqft
|
built
2007
7306 George Ln, Horn Lake, MS 38637
$-70
Cash flow
-1.4%
Cash-on-Cash Return
5.4%
Cap rate
0.7%
Rent to Value Ratio

Active
$239,900
3
bds
|
2
ba
|
0
sqft
|
built
2002
1517 Porpoise Dr, Ocean Springs, MS 39564
$58
Cash flow
1.3%
Cash-on-Cash Return
6.0%
Cap rate
0.8%
Rent to Value Ratio
Pending
$345,000
4
bds
|
3
ba
|
0
sqft
|
built
2021
12411 Desoto Trails Cir, Biloxi, MS 39532
$-24
Cash flow
-0.4%
Cash-on-Cash Return
5.6%
Cap rate
0.8%
Rent to Value Ratio
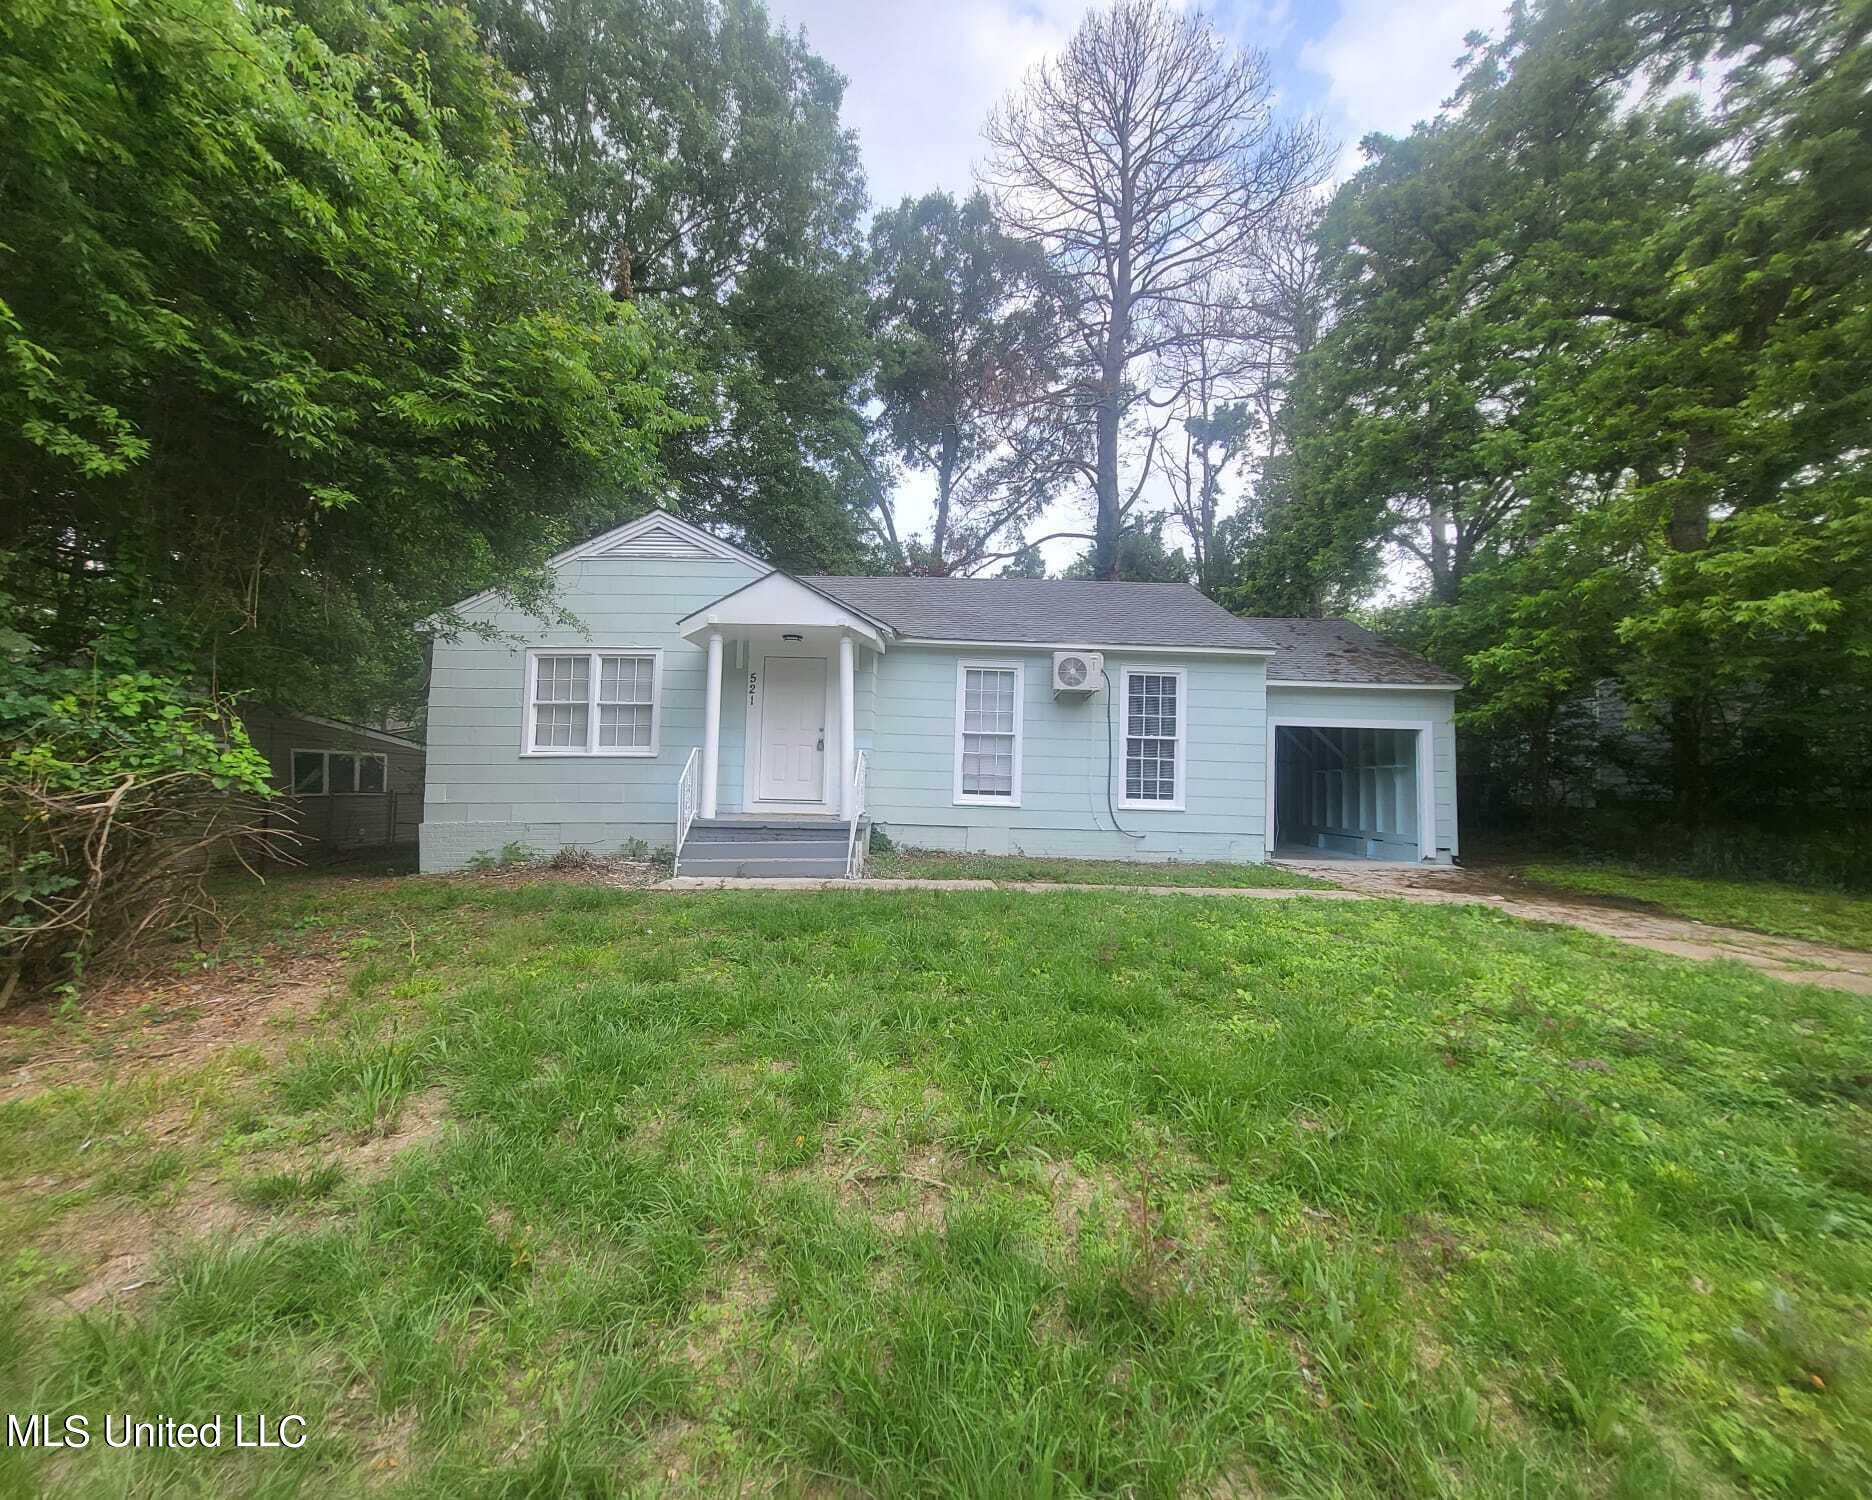
Active
$87,000
3
bds
|
2
ba
|
0
sqft
|
built
1949
521 Launcelot Rd, Jackson, MS 39206
$360
Cash flow
21.6%
Cash-on-Cash Return
10.6%
Cap rate
1.5%
Rent to Value Ratio
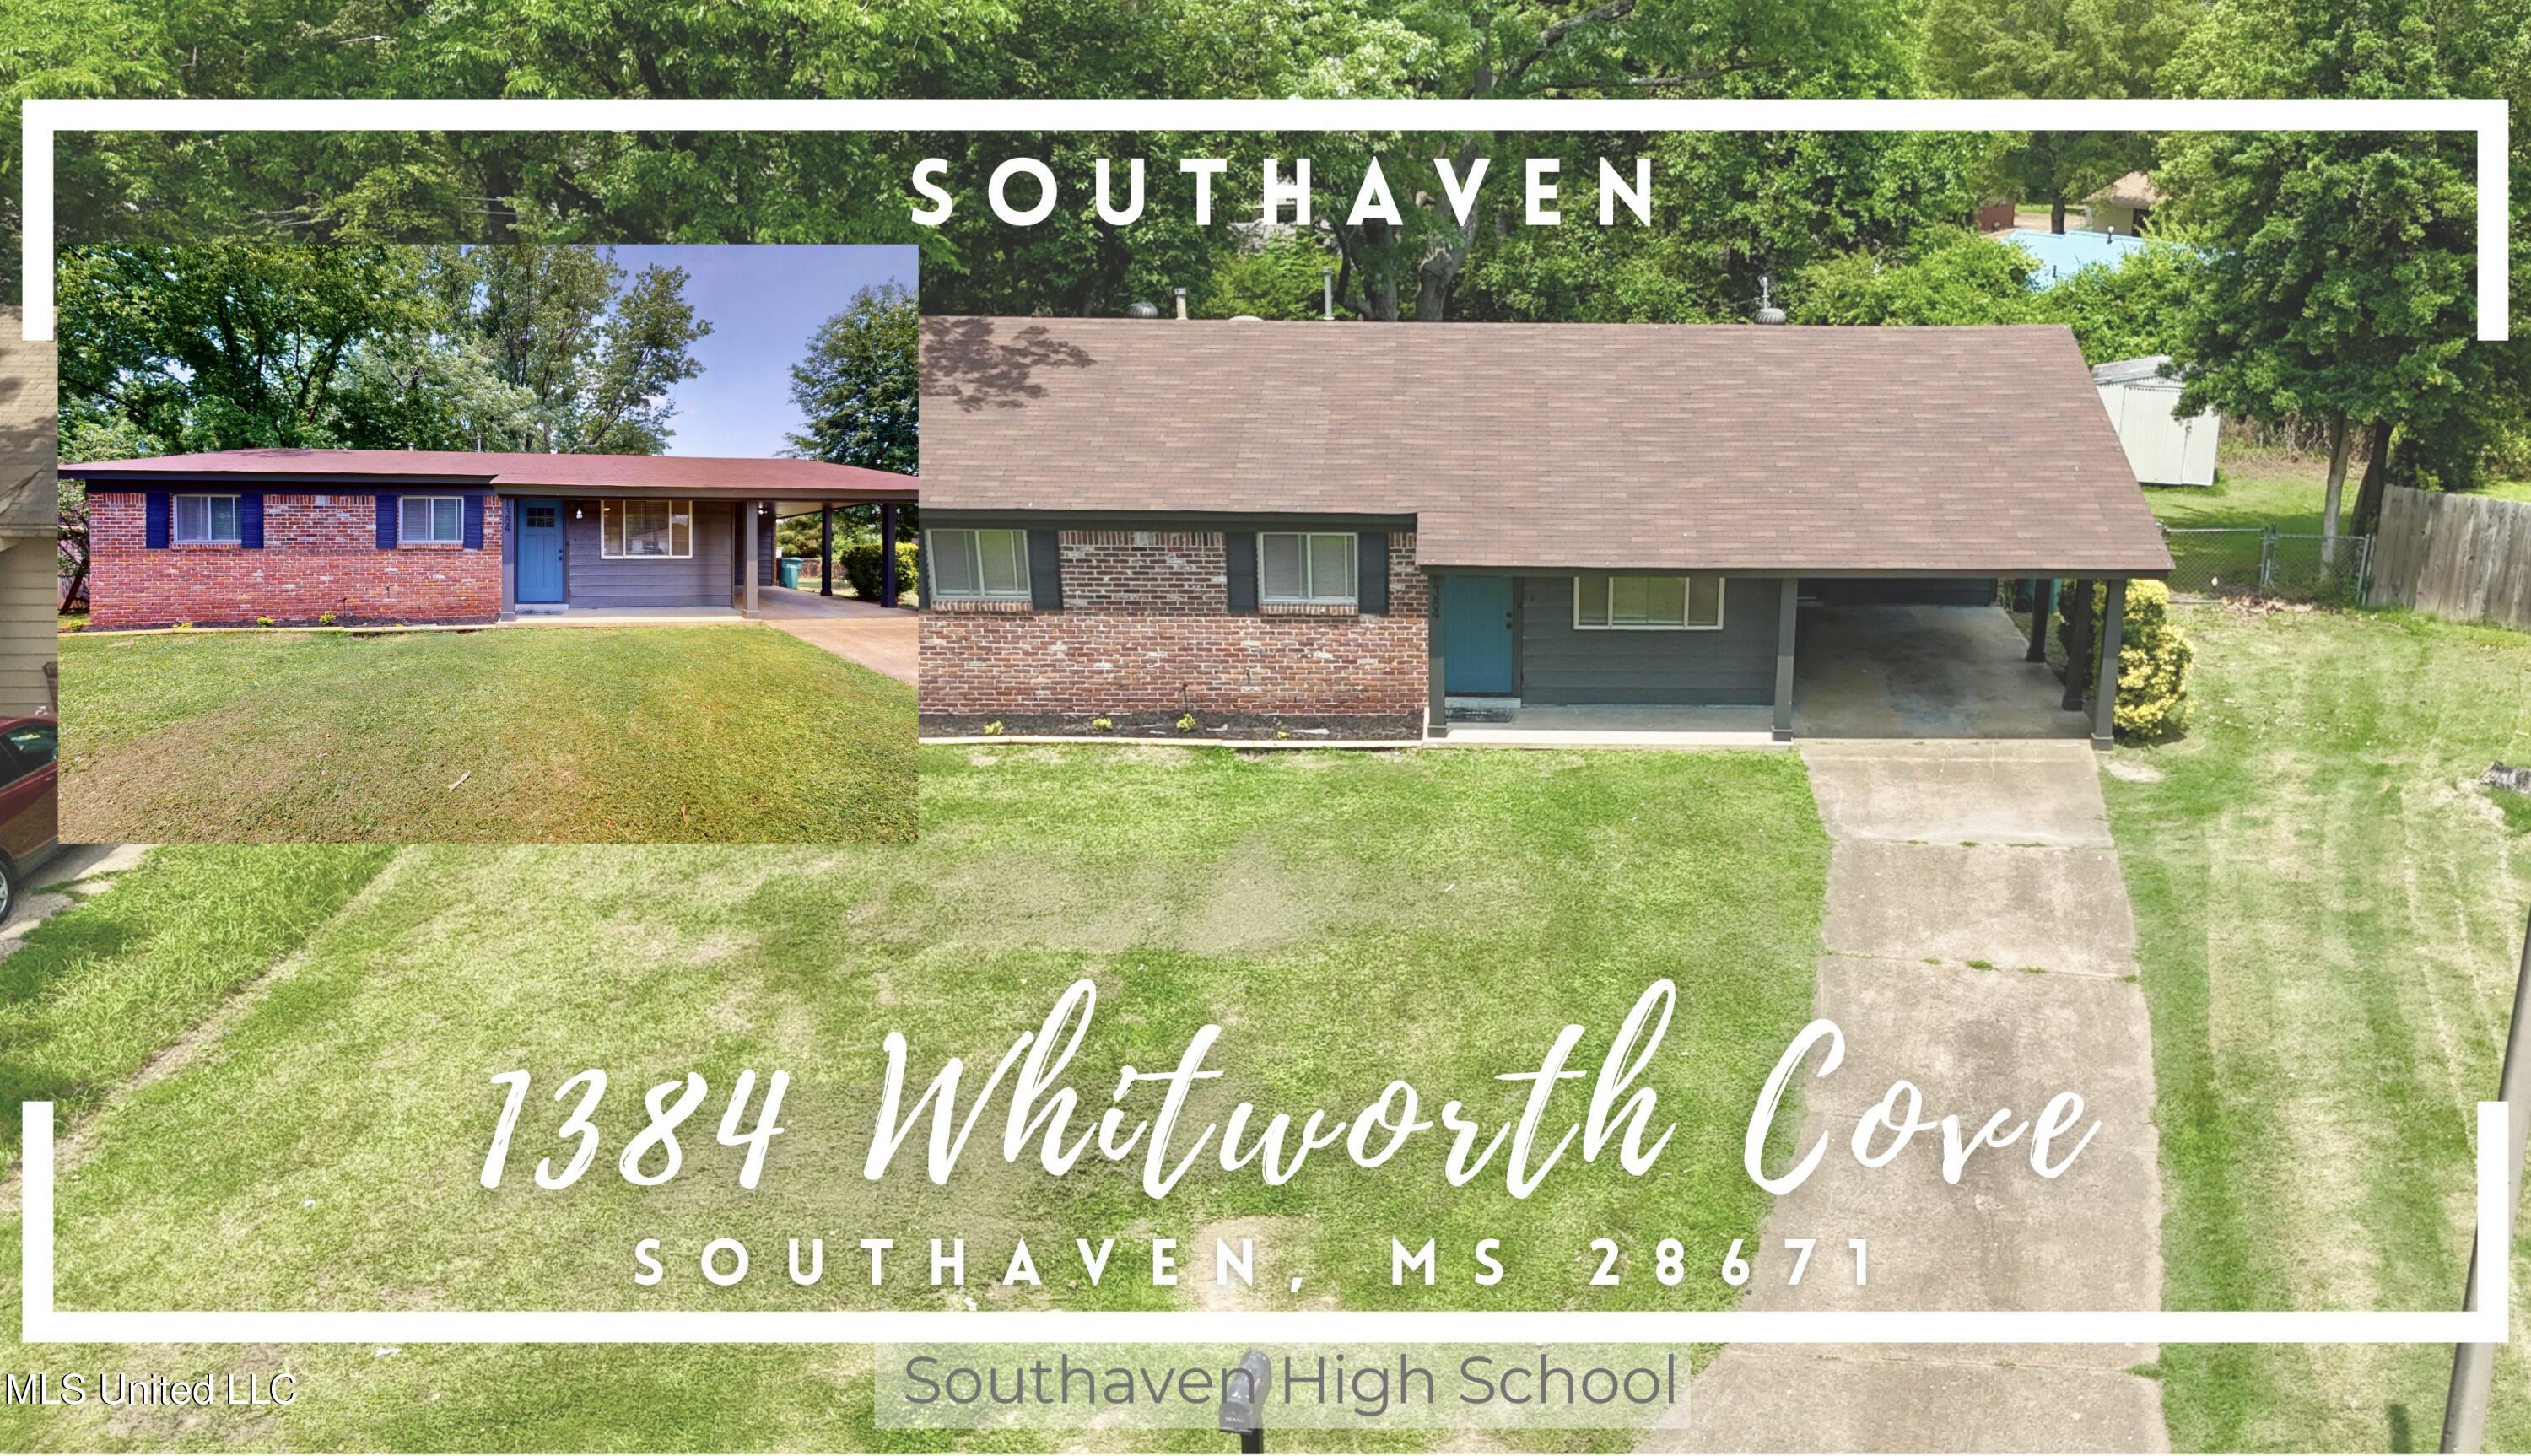
Active
$199,900
3
bds
|
2
ba
|
0
sqft
|
built
1963
1384 Whitworth Cv, Southaven, MS 38671
$88
Cash flow
2.3%
Cash-on-Cash Return
6.2%
Cap rate
0.8%
Rent to Value Ratio
Active
$724,000
4
bds
|
3
ba
|
0
sqft
|
built
1980
6085 Shawnee St, Kiln, MS 39556
$-1,404
Cash flow
-10.1%
Cash-on-Cash Return
3.4%
Cap rate
0.4%
Rent to Value Ratio
Active
$164,000
3
bds
|
2
ba
|
0
sqft
|
built
2005
11181 Vixen Loop, Gulfport, MS 39503
$137
Cash flow
4.4%
Cash-on-Cash Return
6.7%
Cap rate
0.9%
Rent to Value Ratio

Active
$299,000
3
bds
|
2
ba
|
0
sqft
|
built
1979
7572 Lone Oak Cv, Southaven, MS 38671
$-151
Cash flow
-2.6%
Cash-on-Cash Return
5.1%
Cap rate
0.7%
Rent to Value Ratio

Active
$135,000
5
bds
|
3
ba
|
0
sqft
|
built
1960
1073 Maria Dr, Jackson, MS 39204
$307
Cash flow
11.9%
Cash-on-Cash Return
8.4%
Cap rate
1.2%
Rent to Value Ratio
Active
$150,000
2
bds
|
2
ba
|
0
sqft
|
built
2001
108 Kadens Kove, Magee, MS 39111
$179
Cash flow
6.2%
Cash-on-Cash Return
7.1%
Cap rate
0.9%
Rent to Value Ratio
Active
$310,000
3
bds
|
3
ba
|
0
sqft
|
built
2001
9015 Champlain Dr, Olive Branch, MS 38654
$-95
Cash flow
-1.6%
Cash-on-Cash Return
5.3%
Cap rate
0.7%
Rent to Value Ratio
Active
$224,900
3
bds
|
2
ba
|
0
sqft
|
built
1959
1777 Brecon Dr, Jackson, MS 39211
$279
Cash flow
6.5%
Cash-on-Cash Return
7.2%
Cap rate
1.0%
Rent to Value Ratio