Muncie, IN Investment Properties for Sale
Browse homes for sale and investment properties in Muncie, IN. Refine your search by price, property type, or more.
Best cash flowing properties in Muncie, IN

Active
$42,500
2
bds
|
1
ba
|
986
sqft
|
built
1935
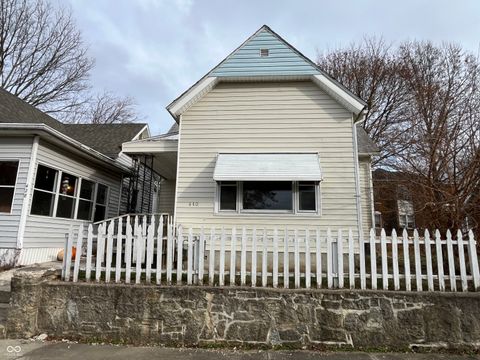
907 W 14th St, Muncie, IN 47302
$897
Cash flow
24.6%
Cash-on-Cash Return
25.3%
Cap rate
3.1%
Rent to Value Ratio

Active
$60,000
3
bds
|
2
ba
|
1,580
sqft
|
built
1900
1309 W Memorial Dr, Muncie, IN 47302
$759
Cash flow
14.7%
Cash-on-Cash Return
15.2%
Cap rate
1.8%
Rent to Value Ratio
54 out of 69 properties for sale in Muncie, IN
Limited Results Shown
Create a free account, or log in to reveal all property listings and enjoy the complete experience.
Active
$140,000
5
bds
|
0
ba
|
0
sqft
|
built
1928
800 W Lindweth Pl, Muncie, IN 47303
$97
Cash flow
3.6%
Cash-on-Cash Return
7.1%
Cap rate
0.9%
Rent to Value Ratio
Active
$364,900
4
bds
|
3
ba
|
2,072
sqft
|
built
2020
425 S Bridge Water Ln, Muncie, IN 47304
$-356
Cash flow
-5.1%
Cash-on-Cash Return
5.1%
Cap rate
0.6%
Rent to Value Ratio
Active
$37,500
bds
|
1
ba
|
720
sqft
|
built
1967
1214 N Penn St, Muncie, IN 47303
$621
Cash flow
19.3%
Cash-on-Cash Return
19.9%
Cap rate
2.4%
Rent to Value Ratio
Active
$15,000
3
bds
|
2
ba
|
0
sqft
|
built
1925
904 N Penn St, Muncie, IN 47303
$552
Cash flow
42.9%
Cash-on-Cash Return
44.2%
Cap rate
5.3%
Rent to Value Ratio
Active
$528,000
3
bds
|
2
ba
|
2,570
sqft
|
built
2003
6089 W Hellis Dr, Muncie, IN 47304
$-825
Cash flow
-8.2%
Cash-on-Cash Return
4.4%
Cap rate
0.5%
Rent to Value Ratio
Active
$299,000
2
bds
|
2
ba
|
1,949
sqft
|
built
2004
4305 W Coyote Run Ct, Muncie, IN 47304
$-519
Cash flow
-9.1%
Cash-on-Cash Return
4.2%
Cap rate
0.6%
Rent to Value Ratio

Active
$38,900
2
bds
|
1
ba
|
1,035
sqft
|
built
1944
1503 E 20th St, Muncie, IN 47302
$690
Cash flow
20.7%
Cash-on-Cash Return
21.3%
Cap rate
2.6%
Rent to Value Ratio
Active
$69,400
4
bds
|
0
ba
|
0
sqft
|
built
1890
1024 W Powers St, Muncie, IN 47305
$759
Cash flow
12.7%
Cash-on-Cash Return
13.1%
Cap rate
1.6%
Rent to Value Ratio
Active
$260,000
3
bds
|
2
ba
|
1,642
sqft
|
built
2007
2717 W Long Meadow Ln, Muncie, IN 47304
$-255
Cash flow
-5.1%
Cash-on-Cash Return
5.1%
Cap rate
0.7%
Rent to Value Ratio

Active
$85,000
3
bds
|
1
ba
|
892
sqft
|
built
1960
1303 S Shipley St, Muncie, IN 47302
$315
Cash flow
19.3%
Cash-on-Cash Return
10.7%
Cap rate
1.3%
Rent to Value Ratio
Active
$60,000
3
bds
|
2
ba
|
1,580
sqft
|
built
1900
1309 W Memorial Dr, Muncie, IN 47302
$759
Cash flow
14.7%
Cash-on-Cash Return
15.2%
Cap rate
1.8%
Rent to Value Ratio
Active
$42,500
2
bds
|
1
ba
|
986
sqft
|
built
1935
907 W 14th St, Muncie, IN 47302
$897
Cash flow
24.6%
Cash-on-Cash Return
25.3%
Cap rate
3.1%
Rent to Value Ratio
Active
$64,900
3
bds
|
1
ba
|
966
sqft
|
built
1890
430 S Proud St, Muncie, IN 47305
$690
Cash flow
12.4%
Cash-on-Cash Return
12.8%
Cap rate
1.5%
Rent to Value Ratio
Active
$142,900
3
bds
|
2
ba
|
934
sqft
|
built
1960
416 N Mulberry St, Muncie, IN 47305
$358
Cash flow
13.1%
Cash-on-Cash Return
9.3%
Cap rate
1.1%
Rent to Value Ratio