Muncie, IN Investment Properties for Sale
Browse homes for sale and investment properties in Muncie, IN. Refine your search by price, property type, or more.
Best cash flowing properties in Muncie, IN
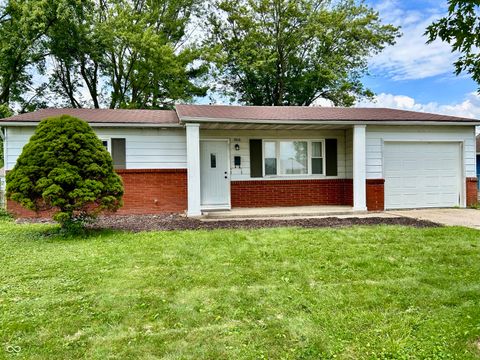
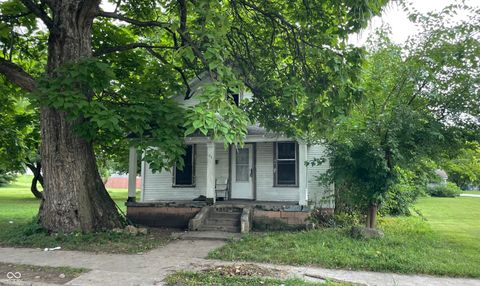
Active
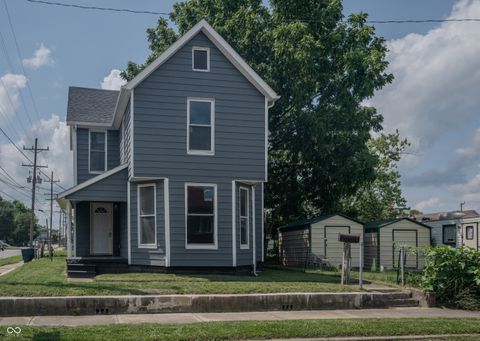
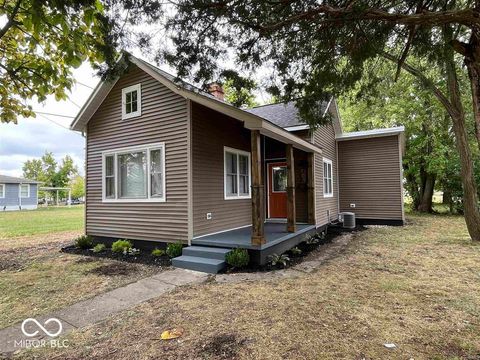
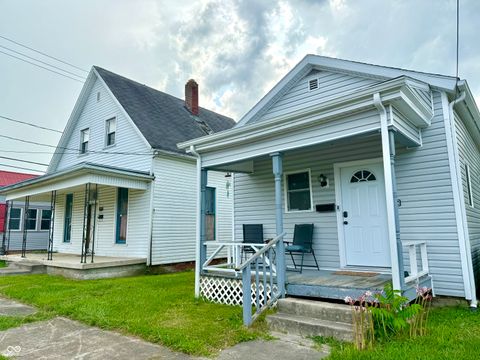
$69,000
3
bds
|
0
ba
|
0
sqft
|
built
1900
802 1/2 N Mulberry St, Muncie, IN 47305
$966
Cash flow
16.3%
Cash-on-Cash Return
16.8%
Cap rate
2.0%
Rent to Value Ratio
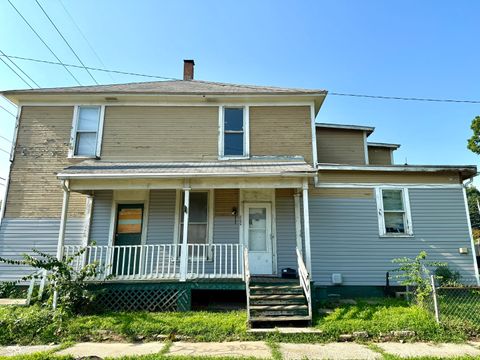
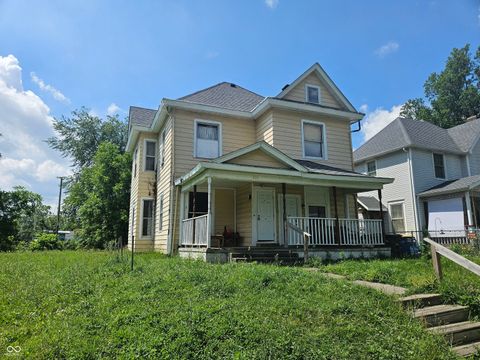
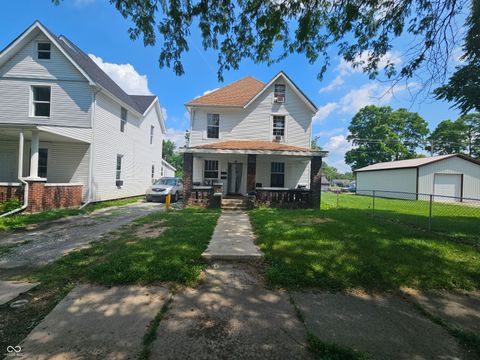
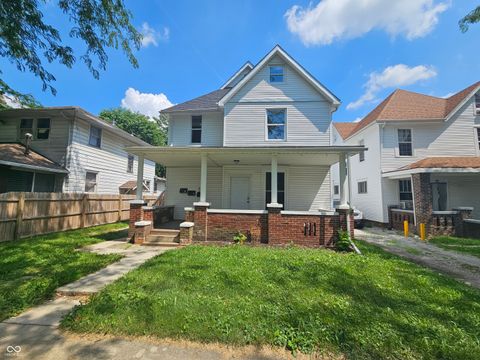
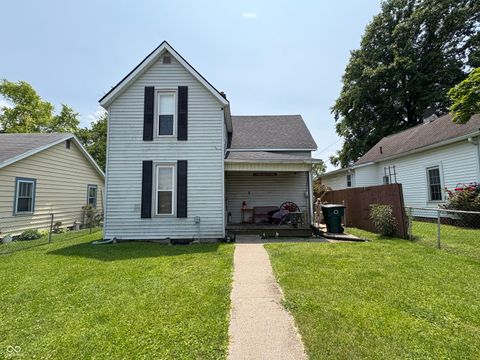
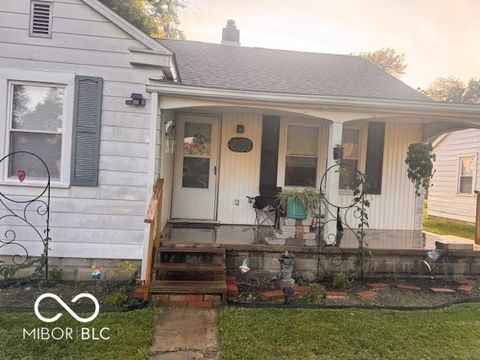
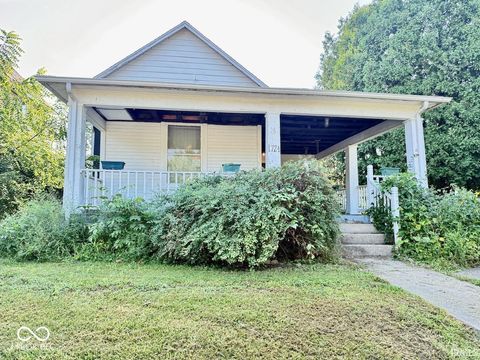
Active
$62,900
4
bds
|
1
ba
|
1,584
sqft
|
built
1895
807 N Elm St, Muncie, IN 47305
$897
Cash flow
16.6%
Cash-on-Cash Return
17.1%
Cap rate
2.1%
Rent to Value Ratio
56 out of 64 properties for sale in Muncie, IN
Limited Results Shown
Create a free account, or log in to reveal all property listings and enjoy the complete experience.
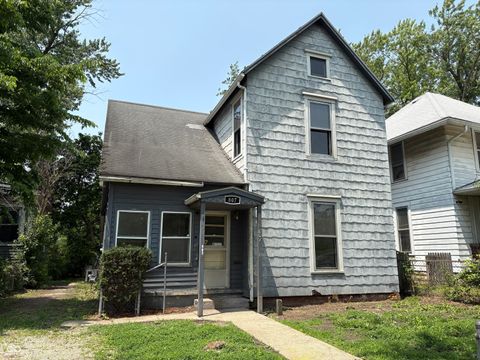
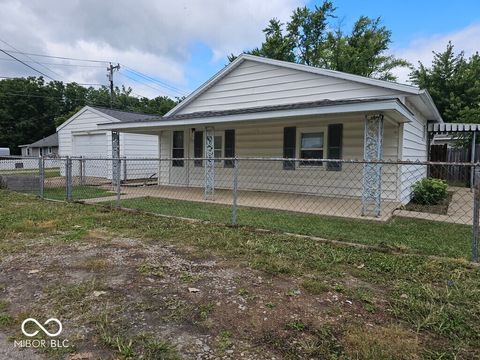
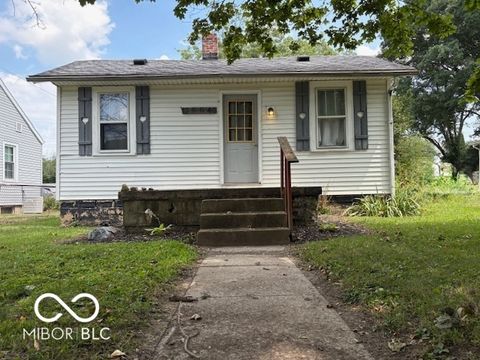
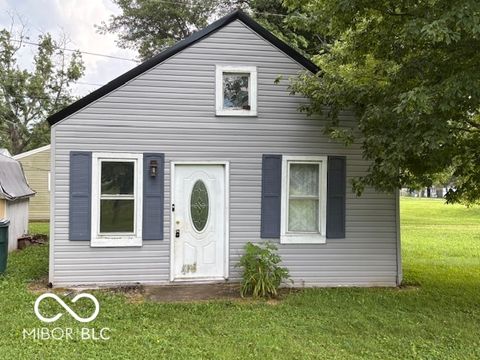
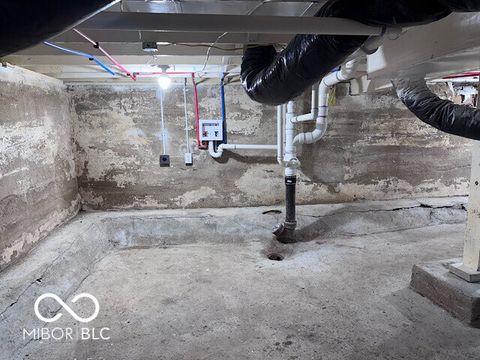
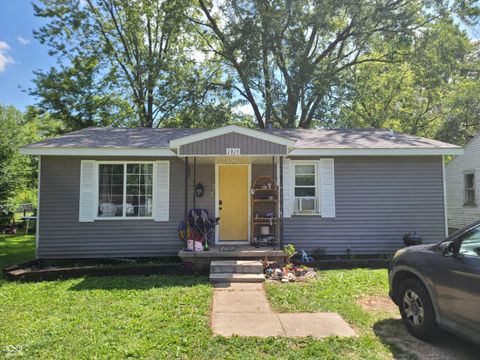
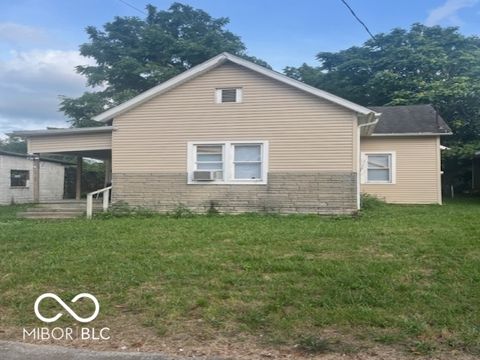
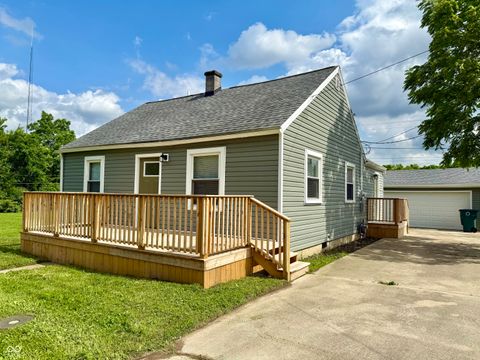
Active
$98,500
3
bds
|
1
ba
|
884
sqft
|
built
1931
1401 E 24th St, Muncie, IN 47302
$116
Cash flow
6.1%
Cash-on-Cash Return
7.6%
Cap rate
0.9%
Rent to Value Ratio
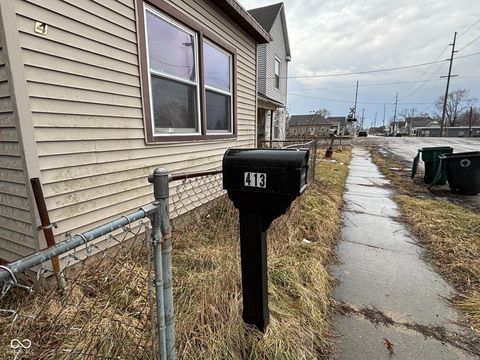
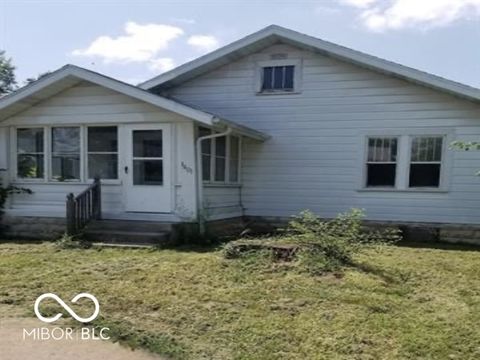
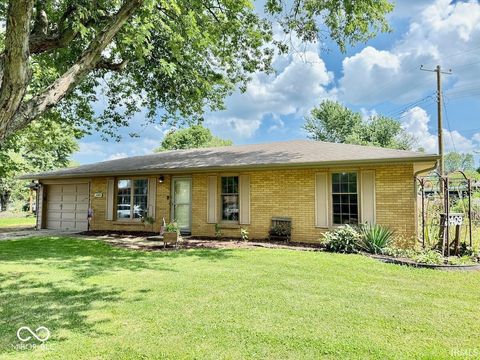
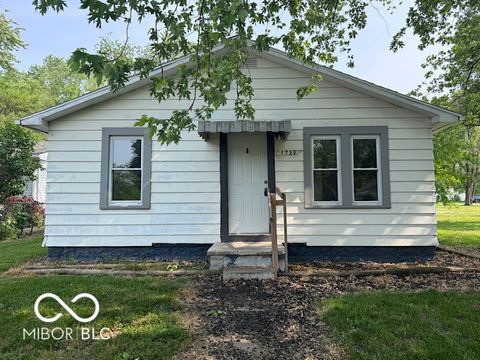
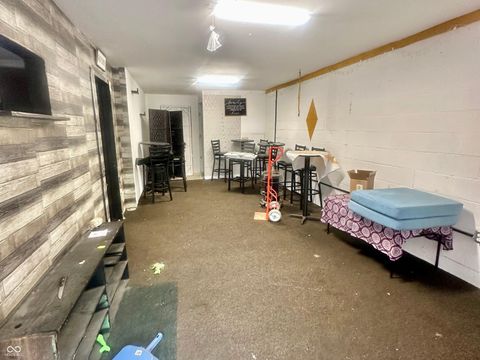
Active
$29,900
3
bds
|
2
ba
|
1,584
sqft
|
built
1895
413 W 8th St, Muncie, IN 47302
$828
Cash flow
32.3%
Cash-on-Cash Return
33.2%
Cap rate
4.0%
Rent to Value Ratio
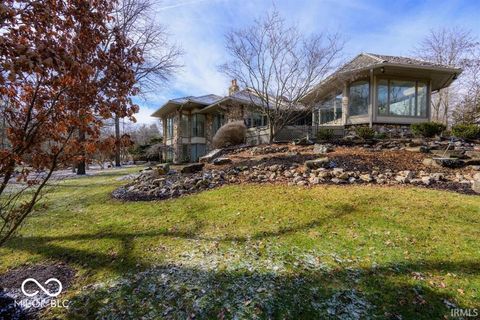
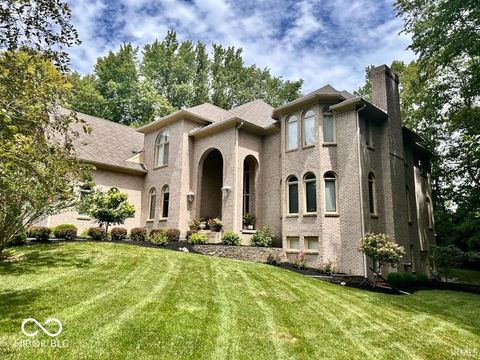
Active
$1,099,000
5
bds
|
7
ba
|
9,837
sqft
|
built
1993
5400 W Deer Run Ct, Muncie, IN 47304
$-2,636
Cash flow
-12.5%
Cash-on-Cash Return
3.3%
Cap rate
0.4%
Rent to Value Ratio
Active
$59,900
1
bds
|
1
ba
|
734
sqft
|
built
1947
310 W 22nd St, Muncie, IN 47302
$690
Cash flow
13.4%
Cash-on-Cash Return
13.8%
Cap rate
1.7%
Rent to Value Ratio
Active
$148,000
2
bds
|
0
ba
|
0
sqft
|
built
1902
221 E 6th St, Muncie, IN 47302
$1
Cash flow
0.0%
Cash-on-Cash Return
6.2%
Cap rate
0.7%
Rent to Value Ratio
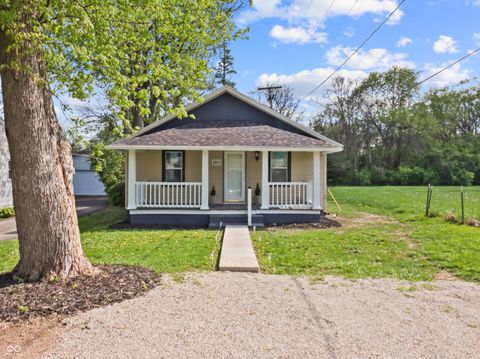
Active
$78,900
2
bds
|
1
ba
|
896
sqft
|
built
1925
1401 S Emerson Ct, Muncie, IN 47302
$217
Cash flow
14.3%
Cash-on-Cash Return
9.4%
Cap rate
1.1%
Rent to Value Ratio
Active
$88,900
3
bds
|
1
ba
|
948
sqft
|
built
1925
3111 S Pershing Dr, Muncie, IN 47302
$442
Cash flow
25.9%
Cash-on-Cash Return
12.1%
Cap rate
1.5%
Rent to Value Ratio
Active
$94,900
3
bds
|
1
ba
|
948
sqft
|
built
1954
1048 S Burlington Dr, Muncie, IN 47302
$204
Cash flow
11.2%
Cash-on-Cash Return
8.7%
Cap rate
1.1%
Rent to Value Ratio
Active
$29,900
2
bds
|
1
ba
|
1,304
sqft
|
built
1952
2420 N Macedonia Ave, Muncie, IN 47303
$759
Cash flow
29.6%
Cash-on-Cash Return
30.5%
Cap rate
3.7%
Rent to Value Ratio
Active
$125,000
2
bds
|
1
ba
|
1,168
sqft
|
built
1928
313 S Brittain Ave, Muncie, IN 47303
$257
Cash flow
10.7%
Cash-on-Cash Return
8.6%
Cap rate
1.0%
Rent to Value Ratio
Active
$115,000
3
bds
|
2
ba
|
1,185
sqft
|
built
1882
1011 S Elm St, Muncie, IN 47302
$377
Cash flow
17.1%
Cash-on-Cash Return
10.1%
Cap rate
1.2%
Rent to Value Ratio
Active
$135,000
3
bds
|
0
ba
|
0
sqft
|
built
1910
1328 E Main St, Muncie, IN 47305
$67
Cash flow
2.6%
Cash-on-Cash Return
6.7%
Cap rate
0.8%
Rent to Value Ratio
Active
$80,000
1
bds
|
1
ba
|
648
sqft
|
built
1930
1804 N Milton St, Muncie, IN 47303
$211
Cash flow
13.8%
Cash-on-Cash Return
9.3%
Cap rate
1.1%
Rent to Value Ratio
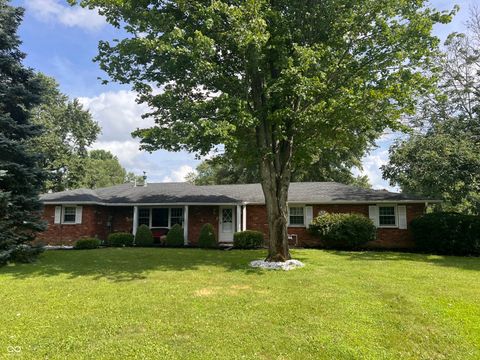
Active
$155,000
3
bds
|
2
ba
|
1,120
sqft
|
built
1959
2409 W Barcelona Dr, Muncie, IN 47304
$310
Cash flow
10.4%
Cash-on-Cash Return
8.5%
Cap rate
1.0%
Rent to Value Ratio
Active
$190,000
2
bds
|
0
ba
|
0
sqft
|
built
1965
1320 E Main St, Muncie, IN 47305
$-214
Cash flow
-5.9%
Cash-on-Cash Return
4.8%
Cap rate
0.6%
Rent to Value Ratio
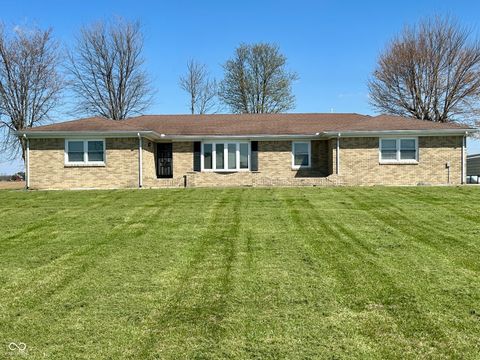
Active
$279,999
3
bds
|
3
ba
|
2,348
sqft
|
built
1974
10100 S County Road 300 W, Muncie, IN 47302
$84
Cash flow
1.6%
Cash-on-Cash Return
6.5%
Cap rate
0.8%
Rent to Value Ratio
Active
$78,900
2
bds
|
1
ba
|
620
sqft
|
built
1950
2309 E Depauw Ave, Muncie, IN 47303
$355
Cash flow
23.5%
Cash-on-Cash Return
11.5%
Cap rate
1.4%
Rent to Value Ratio
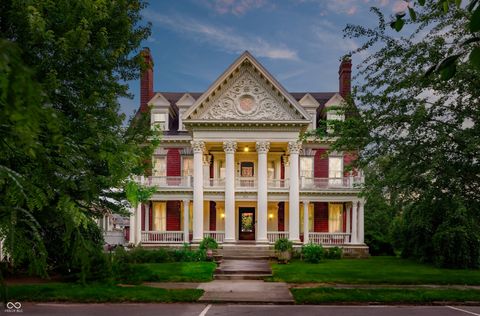
Active
$795,000
6
bds
|
4
ba
|
8,741
sqft
|
built
1902
825 E Washington St, Muncie, IN 47305
$-1,588
Cash flow
-10.4%
Cash-on-Cash Return
3.7%
Cap rate
0.5%
Rent to Value Ratio
Active
$109,900
3
bds
|
1
ba
|
961
sqft
|
built
1884
709 S Vine St, Muncie, IN 47302
$334
Cash flow
15.9%
Cash-on-Cash Return
9.8%
Cap rate
1.2%
Rent to Value Ratio
Active
$69,900
4
bds
|
2
ba
|
1,624
sqft
|
built
1890
1809 E 13th St, Muncie, IN 47302
$759
Cash flow
12.7%
Cash-on-Cash Return
13.0%
Cap rate
1.6%
Rent to Value Ratio
Active
$87,900
3
bds
|
1
ba
|
844
sqft
|
built
1920
605 W 10th St, Muncie, IN 47302
$309
Cash flow
18.3%
Cash-on-Cash Return
10.4%
Cap rate
1.3%
Rent to Value Ratio
Active
$59,900
2
bds
|
1
ba
|
796
sqft
|
built
1945
1720 E Cornell Ave, Muncie, IN 47303
$690
Cash flow
13.4%
Cash-on-Cash Return
13.8%
Cap rate
1.7%
Rent to Value Ratio
Active
$94,000
1
bds
|
1
ba
|
591
sqft
|
built
1880
303 S Proud St, Muncie, IN 47305
$208
Cash flow
11.5%
Cash-on-Cash Return
8.8%
Cap rate
1.1%
Rent to Value Ratio
Active
$90,000
2
bds
|
1
ba
|
945
sqft
|
built
1950
1915 E Purdue Rd, Muncie, IN 47303
$436
Cash flow
25.3%
Cash-on-Cash Return
12.0%
Cap rate
1.4%
Rent to Value Ratio
Active
$279,900
4
bds
|
2
ba
|
2,242
sqft
|
built
1971
600 N Fir Tree Dr, Muncie, IN 47304
$-54
Cash flow
-1.0%
Cash-on-Cash Return
5.9%
Cap rate
0.7%
Rent to Value Ratio
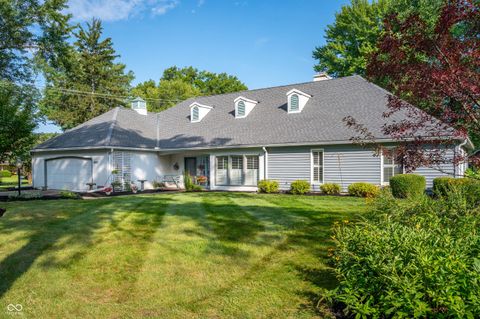
Active
$329,900
2
bds
|
2
ba
|
2,469
sqft
|
built
1989
4408 W Beechwood Ave, Muncie, IN 47304
$-103
Cash flow
-1.6%
Cash-on-Cash Return
5.8%
Cap rate
0.7%
Rent to Value Ratio
Active
$125,000
3
bds
|
2
ba
|
1,432
sqft
|
built
1967
2616 E 27th St, Muncie, IN 47302
$602
Cash flow
25.1%
Cash-on-Cash Return
11.9%
Cap rate
1.4%
Rent to Value Ratio
Active
$108,900
3
bds
|
2
ba
|
738
sqft
|
built
1938
2815 S Pershing Dr, Muncie, IN 47302
$546
Cash flow
26.2%
Cash-on-Cash Return
12.2%
Cap rate
1.5%
Rent to Value Ratio
Active
$78,900
3
bds
|
1
ba
|
1,238
sqft
|
built
1890
1157 W Kilgore Ave, Muncie, IN 47305
$355
Cash flow
23.5%
Cash-on-Cash Return
11.5%
Cap rate
1.4%
Rent to Value Ratio
Active
$875,000
7
bds
|
8
ba
|
7,967
sqft
|
built
1999
5300 W Autumn Springs Ct, Muncie, IN 47304
$-2,040
Cash flow
-12.2%
Cash-on-Cash Return
3.3%
Cap rate
0.4%
Rent to Value Ratio
Active
$160,000
3
bds
|
1
ba
|
1,492
sqft
|
built
1915
1401 N Walnut St, Muncie, IN 47303
$284
Cash flow
9.3%
Cash-on-Cash Return
8.3%
Cap rate
1.0%
Rent to Value Ratio
Active
$394,900
5
bds
|
3
ba
|
2,706
sqft
|
built
2006
7900 W Tipperary Dr, Muncie, IN 47304
$-298
Cash flow
-3.9%
Cash-on-Cash Return
5.2%
Cap rate
0.6%
Rent to Value Ratio
Active
$285,000
5
bds
|
3
ba
|
2,709
sqft
|
built
1967
2213 W Audubon Dr, Muncie, IN 47304
$58
Cash flow
1.1%
Cash-on-Cash Return
6.4%
Cap rate
0.8%
Rent to Value Ratio
Active
$78,900
2
bds
|
1
ba
|
840
sqft
|
built
1950
2101 N Macedonia Ave, Muncie, IN 47303
$286
Cash flow
18.9%
Cash-on-Cash Return
10.5%
Cap rate
1.3%
Rent to Value Ratio
Active
$32,000
3
bds
|
2
ba
|
980
sqft
|
built
1925
904 N Penn St, Muncie, IN 47303
$552
Cash flow
20.1%
Cash-on-Cash Return
20.7%
Cap rate
2.5%
Rent to Value Ratio
Active
$159,900
2
bds
|
1
ba
|
792
sqft
|
built
1951
405 E Cowing Dr, Muncie, IN 47303
$147
Cash flow
4.8%
Cash-on-Cash Return
7.2%
Cap rate
0.9%
Rent to Value Ratio
Active
$37,500
bds
|
1
ba
|
720
sqft
|
built
1967
1214 N Penn St, Muncie, IN 47303
$621
Cash flow
19.3%
Cash-on-Cash Return
19.9%
Cap rate
2.4%
Rent to Value Ratio
Active
$70,000
2
bds
|
1
ba
|
1,134
sqft
|
built
1910
1724 S Elm St, Muncie, IN 47302
$690
Cash flow
11.5%
Cash-on-Cash Return
11.8%
Cap rate
1.4%
Rent to Value Ratio