Wake County Investment Properties for Sale
Browse homes for sale and investment properties in Wake County. Refine your search by price, property type, or more.
Best cash flowing properties in Wake County
Active
$269,900
3
bds
|
2
ba
|
1,214
sqft
|
built
1965
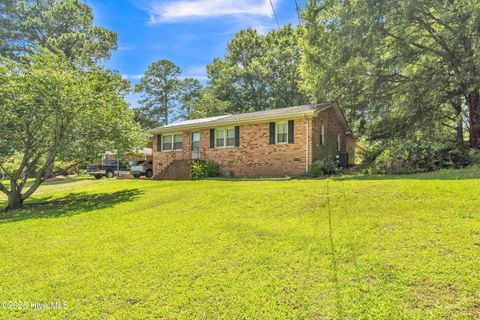
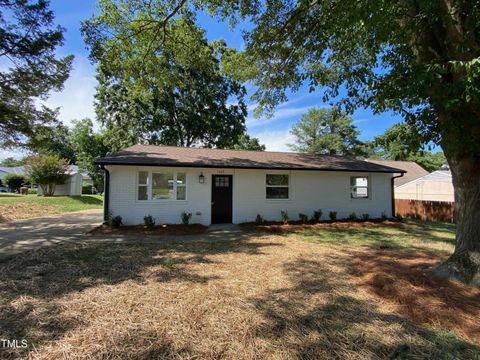
5716 Spring Rd, Raleigh, NC 27603
$-35
Cash flow
-0.7%
Cash-on-Cash Return
5.5%
Cap rate
0.7%
Rent to Value Ratio
Active
$200,000
3
bds
|
3
ba
|
1,319
sqft
|
built
1978
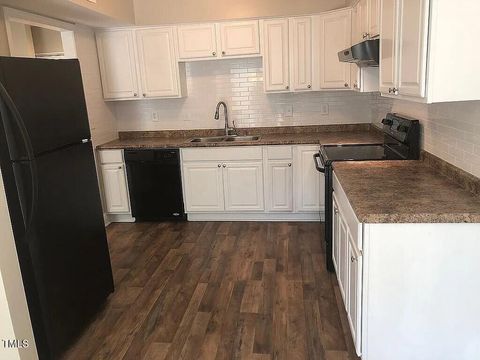
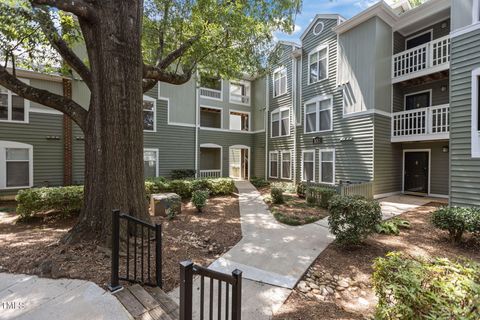
4600 Millstone Dr, Raleigh, NC 27604
$-173
Cash flow
-4.5%
Cash-on-Cash Return
4.6%
Cap rate
0.9%
Rent to Value Ratio
85 out of 1,975 properties for sale in Wake County
Limited Results Shown
Create a free account, or log in to reveal all property listings and enjoy the complete experience.
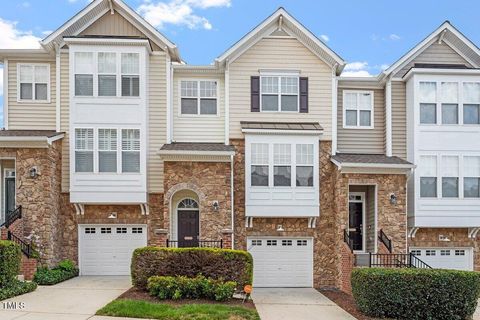
Active
$439,000
2
bds
|
3
ba
|
1,457
sqft
|
built
2006
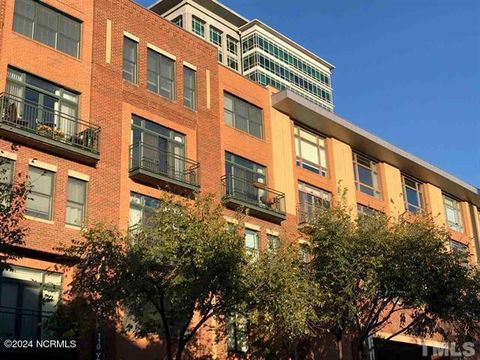
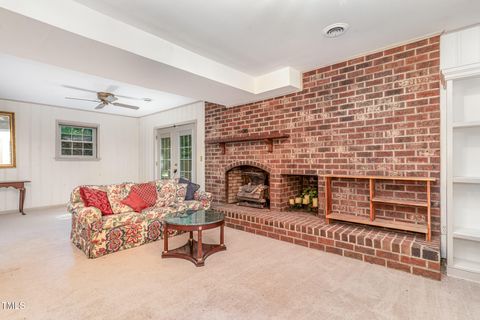
444 S Blount St, Raleigh, NC 27601
$-1,489
Cash flow
-17.7%
Cash-on-Cash Return
1.6%
Cap rate
0.5%
Rent to Value Ratio
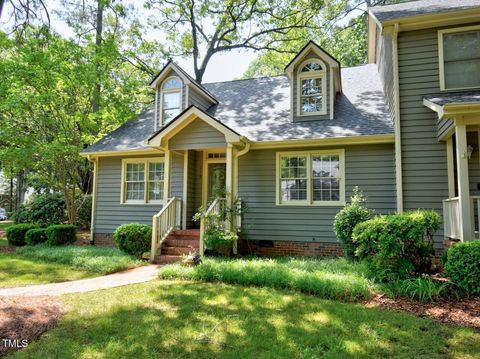
Active
$325,000
2
bds
|
3
ba
|
876
sqft
|
built
1854
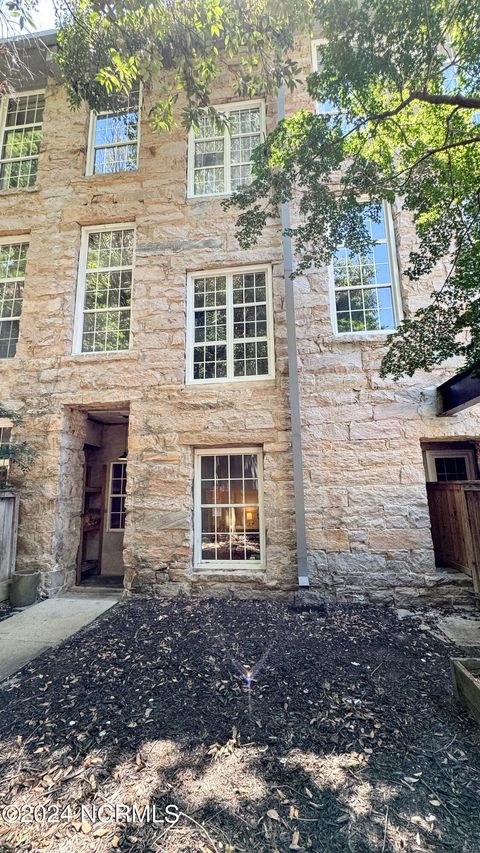
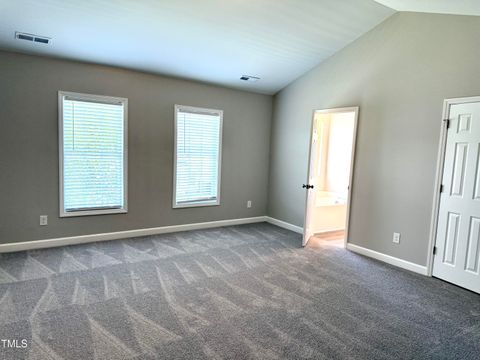
1500 River Mill Dr, Wake Forest, NC 27587
$-709
Cash flow
-11.4%
Cash-on-Cash Return
3.1%
Cap rate
0.6%
Rent to Value Ratio
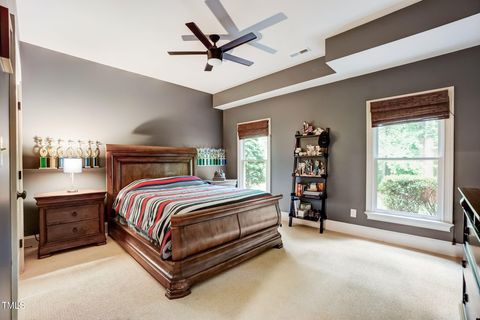
Active
$375,000
2
bds
|
3
ba
|
1,472
sqft
|
built
2010
408 Panorama View Loop, Cary, NC 27519
$-694
Cash flow
-9.7%
Cash-on-Cash Return
3.5%
Cap rate
0.5%
Rent to Value Ratio
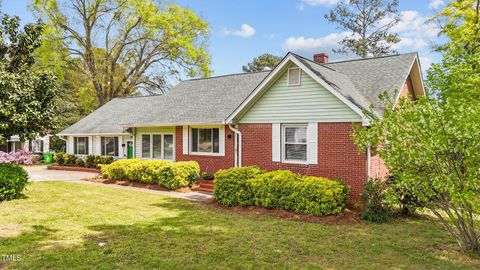
Active
$270,000
3
bds
|
2
ba
|
1,456
sqft
|
built
1972
1255 Donaldson Ct, Cary, NC 27511
$-385
Cash flow
-7.4%
Cash-on-Cash Return
4.0%
Cap rate
0.6%
Rent to Value Ratio
Active
$1,350,000
11
bds
|
10
ba
|
7,809
sqft
|
built
1901
238 N Main St, Wake Forest, NC 27587
$-4,494
Cash flow
-17.4%
Cash-on-Cash Return
1.7%
Cap rate
0.3%
Rent to Value Ratio
Active
$358,900
3
bds
|
4
ba
|
1,571
sqft
|
built
2009
8016 Sycamore Hill Ln, Raleigh, NC 27612
$-875
Cash flow
-12.7%
Cash-on-Cash Return
2.8%
Cap rate
0.5%
Rent to Value Ratio
Active
$295,000
3
bds
|
1
ba
|
1,118
sqft
|
built
1963
1003 Hadley Rd, Raleigh, NC 27610
$-212
Cash flow
-3.7%
Cash-on-Cash Return
4.8%
Cap rate
0.7%
Rent to Value Ratio

Active
$399,999
3
bds
|
3
ba
|
1,795
sqft
|
built
2002
8310 Chimneycap Dr, Raleigh, NC 27613
$-946
Cash flow
-12.3%
Cash-on-Cash Return
2.8%
Cap rate
0.5%
Rent to Value Ratio
Active
$320,000
1
bds
|
1
ba
|
739
sqft
|
built
1986
1011 Nicholwood Dr, Raleigh, NC 27605
$-874
Cash flow
-14.2%
Cash-on-Cash Return
2.4%
Cap rate
0.5%
Rent to Value Ratio

Active
$425,000
3
bds
|
3
ba
|
1,468
sqft
|
built
1997
1913 Kelly Glen Dr, Apex, NC 27502
$-950
Cash flow
-11.7%
Cash-on-Cash Return
3.0%
Cap rate
0.5%
Rent to Value Ratio
Active
$1,075,000
4
bds
|
4
ba
|
3,911
sqft
|
built
2004
3728 Westbury Lake Dr, Raleigh, NC 27603
$-3,119
Cash flow
-15.1%
Cash-on-Cash Return
2.2%
Cap rate
0.3%
Rent to Value Ratio
Active
$325,000
3
bds
|
3
ba
|
1,927
sqft
|
built
1964
612 Locust Ln, Raleigh, NC 27603
$-324
Cash flow
-5.2%
Cash-on-Cash Return
4.5%
Cap rate
0.6%
Rent to Value Ratio
Active
$380,000
4
bds
|
3
ba
|
1,991
sqft
|
built
2006
1618 Brownairs Ln, Raleigh, NC 27610
$-677
Cash flow
-9.3%
Cash-on-Cash Return
3.5%
Cap rate
0.5%
Rent to Value Ratio
Active
$449,998
4
bds
|
4
ba
|
2,258
sqft
|
built
2006
5003 Celtic Ct, Raleigh, NC 27612
$-906
Cash flow
-10.5%
Cash-on-Cash Return
3.3%
Cap rate
0.6%
Rent to Value Ratio
Active
$349,000
2
bds
|
2
ba
|
1,316
sqft
|
built
1984
119 Long Shadow Ln, Cary, NC 27518
$-969
Cash flow
-14.5%
Cash-on-Cash Return
2.3%
Cap rate
0.5%
Rent to Value Ratio
Active
$1,475,000
4
bds
|
5
ba
|
5,718
sqft
|
built
2005
1300 Caistor Ln, Raleigh, NC 27614
$-3,835
Cash flow
-13.6%
Cash-on-Cash Return
2.6%
Cap rate
0.4%
Rent to Value Ratio
Active
$424,900
3
bds
|
3
ba
|
2,360
sqft
|
built
1948
1410 Cross Link Rd, Raleigh, NC 27610
$-839
Cash flow
-10.3%
Cash-on-Cash Return
3.3%
Cap rate
0.5%
Rent to Value Ratio
Active
$1,295,000
4
bds
|
3
ba
|
3,773
sqft
|
built
2013
3908 Chaumont Dr, Apex, NC 27539
$-1,967
Cash flow
-7.9%
Cash-on-Cash Return
3.9%
Cap rate
0.5%
Rent to Value Ratio

Active
$1,595,000
4
bds
|
6
ba
|
4,280
sqft
|
built
2021
2321 Toll Mill Ct, Raleigh, NC 27606
$-5,485
Cash flow
-17.9%
Cash-on-Cash Return
1.6%
Cap rate
0.3%
Rent to Value Ratio
Active
$1,025,000
3
bds
|
3
ba
|
2,613
sqft
|
built
1950
1312 Dixie Trl, Raleigh, NC 27607
$-2,357
Cash flow
-12.0%
Cash-on-Cash Return
2.9%
Cap rate
0.4%
Rent to Value Ratio

Active
$300,000
2
bds
|
2
ba
|
1,411
sqft
|
built
2006
3811 Lunceston Way, Raleigh, NC 27613
$-650
Cash flow
-11.3%
Cash-on-Cash Return
3.1%
Cap rate
0.7%
Rent to Value Ratio
Active
$310,000
3
bds
|
3
ba
|
1,538
sqft
|
built
1984
7412 Penny Hill Ln, Raleigh, NC 27615
$-692
Cash flow
-11.6%
Cash-on-Cash Return
3.0%
Cap rate
0.6%
Rent to Value Ratio
Active
$344,900
3
bds
|
3
ba
|
1,380
sqft
|
built
2001
7528 Argent Valley Dr, Raleigh, NC 27616
$-618
Cash flow
-9.3%
Cash-on-Cash Return
3.5%
Cap rate
0.5%
Rent to Value Ratio
Active
$624,900
3
bds
|
3
ba
|
1,810
sqft
|
built
1966
2309 Bertie Dr, Raleigh, NC 27610
$-1,981
Cash flow
-16.5%
Cash-on-Cash Return
1.9%
Cap rate
0.3%
Rent to Value Ratio
Active
$550,000
4
bds
|
3
ba
|
2,504
sqft
|
built
1978
11637 Appaloosa Run W, Raleigh, NC 27613
$-1,044
Cash flow
-9.9%
Cash-on-Cash Return
3.4%
Cap rate
0.5%
Rent to Value Ratio
Active
$231,900
2
bds
|
1
ba
|
1,085
sqft
|
built
1984
104 Oak Hollow Ct, Raleigh, NC 27613
$-626
Cash flow
-14.1%
Cash-on-Cash Return
2.4%
Cap rate
0.6%
Rent to Value Ratio
Active
$279,900
2
bds
|
2
ba
|
1,326
sqft
|
built
1999
1911 Falls Landing Dr, Raleigh, NC 27614
$-349
Cash flow
-6.5%
Cash-on-Cash Return
4.2%
Cap rate
0.6%
Rent to Value Ratio
Active
$305,000
3
bds
|
3
ba
|
1,582
sqft
|
built
1995
6036 Epping Forest Dr, Raleigh, NC 27613
$-753
Cash flow
-12.9%
Cash-on-Cash Return
2.7%
Cap rate
0.6%
Rent to Value Ratio
Active
$1,949,000
5
bds
|
8
ba
|
6,897
sqft
|
built
2004
5768 Cavanaugh Dr, Raleigh, NC 27614
$-5,583
Cash flow
-14.9%
Cash-on-Cash Return
2.2%
Cap rate
0.4%
Rent to Value Ratio
Active
$428,000
4
bds
|
4
ba
|
2,217
sqft
|
built
2008
9206 Wooden Rd, Raleigh, NC 27617
$-879
Cash flow
-10.7%
Cash-on-Cash Return
3.2%
Cap rate
0.6%
Rent to Value Ratio
Active
$549,900
4
bds
|
3
ba
|
2,700
sqft
|
built
2001
4211 Norman Ridge Ln, Raleigh, NC 27613
$-1,371
Cash flow
-13.0%
Cash-on-Cash Return
2.7%
Cap rate
0.5%
Rent to Value Ratio
Active
$519,000
3
bds
|
2
ba
|
1,612
sqft
|
built
1963
1014 E Jones St, Raleigh, NC 27601
$-786
Cash flow
-7.9%
Cash-on-Cash Return
3.9%
Cap rate
0.5%
Rent to Value Ratio
Active
$284,900
3
bds
|
2
ba
|
1,462
sqft
|
built
1993
1210 Shadowbark Ct, Raleigh, NC 27603
$-644
Cash flow
-11.8%
Cash-on-Cash Return
3.0%
Cap rate
0.6%
Rent to Value Ratio
Active
$405,000
2
bds
|
2
ba
|
1,615
sqft
|
built
1984
1221 Moultrie Ct, Raleigh, NC 27615
$-548
Cash flow
-7.1%
Cash-on-Cash Return
4.1%
Cap rate
0.5%
Rent to Value Ratio
Active
$869,900
3
bds
|
3
ba
|
3,221
sqft
|
built
2006
6801 Valley Lake Dr, Raleigh, NC 27612
$-2,146
Cash flow
-12.9%
Cash-on-Cash Return
2.7%
Cap rate
0.4%
Rent to Value Ratio

Active
$325,000
3
bds
|
3
ba
|
1,410
sqft
|
built
1997
102 Climbing Ivy Ct, Cary, NC 27511
$-630
Cash flow
-10.1%
Cash-on-Cash Return
3.4%
Cap rate
0.6%
Rent to Value Ratio
Active
$339,900
3
bds
|
3
ba
|
1,741
sqft
|
built
2022
152 Woodford Reserve Ct, Garner, NC 27529
$-762
Cash flow
-11.7%
Cash-on-Cash Return
3.0%
Cap rate
0.5%
Rent to Value Ratio
Active
$445,000
3
bds
|
2
ba
|
1,827
sqft
|
built
2021
233 Stone River Dr, Wendell, NC 27591
$-1,083
Cash flow
-12.7%
Cash-on-Cash Return
2.8%
Cap rate
0.5%
Rent to Value Ratio