Needham, MA Investment Properties for Sale
Browse homes for sale and investment properties in Needham, MA. Refine your search by price, property type, or more.
Best cash flowing properties in Needham, MA
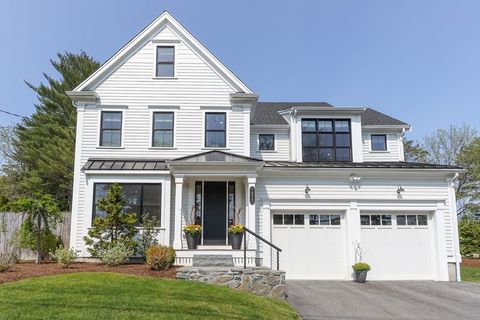
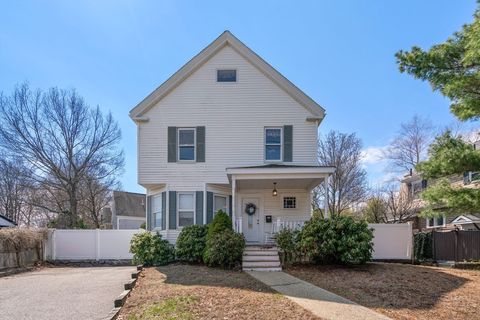
Active
$335,000
0
bds
|
1
ba
|
358
sqft
|
built
1968
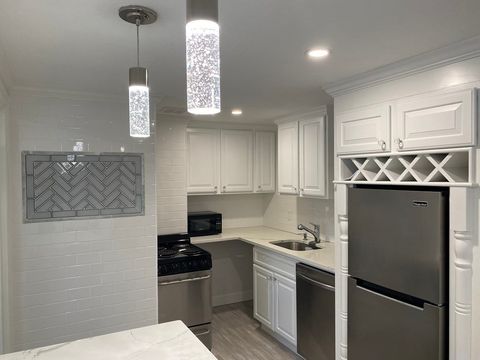
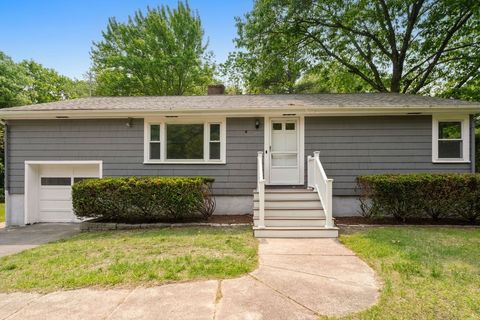
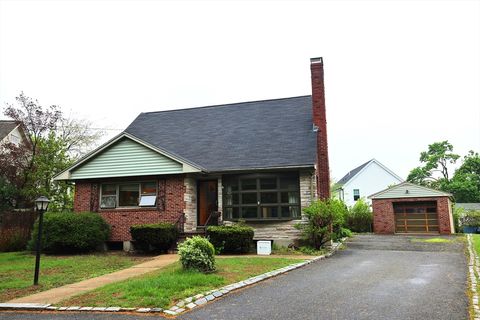
210 Hillside Ave, Needham, MA 02494
$-840
Cash flow
-13.1%
Cash-on-Cash Return
3.2%
Cap rate
0.6%
Rent to Value Ratio
Active
$499,000
2
bds
|
2
ba
|
1,350
sqft
|
built
1968
1204 Greendale Ave, Needham, MA 02492
$-1,102
Cash flow
-11.5%
Cash-on-Cash Return
3.0%
Cap rate
0.7%
Rent to Value Ratio
38 out of 52 properties for sale in Needham, MA
Limited Results Shown
Create a free account, or log in to reveal all property listings and enjoy the complete experience.
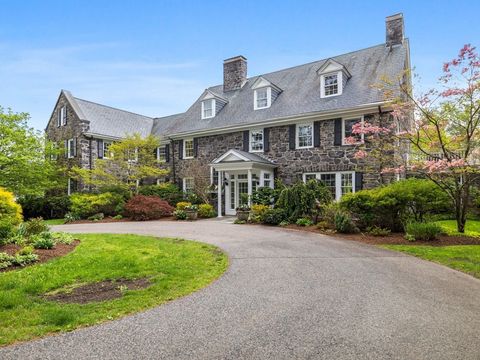
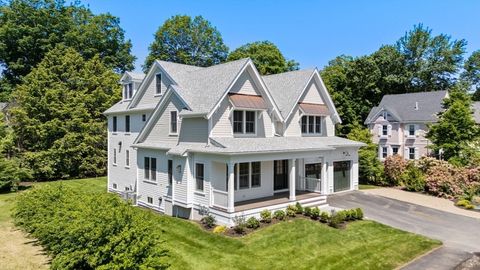
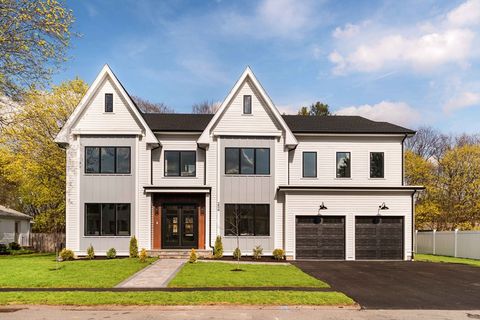
Active
$2,350,000
6
bds
|
5
ba
|
3,698
sqft
|
built
2005
263 Hunnewell St, Needham, MA 02494
$-8,156
Cash flow
-18.1%
Cash-on-Cash Return
2.1%
Cap rate
0.3%
Rent to Value Ratio
Active
$749,900
3
bds
|
2
ba
|
1,232
sqft
|
built
1955
258 Kendrick St, Needham, MA 02494
$-1,931
Cash flow
-13.4%
Cash-on-Cash Return
3.2%
Cap rate
0.5%
Rent to Value Ratio
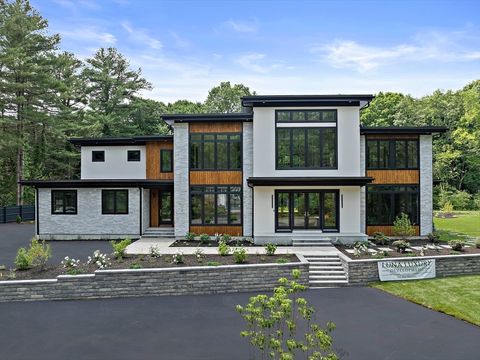
Active
$2,195,000
6
bds
|
5
ba
|
4,410
sqft
|
built
2020
1473 Great Plain Ave, Needham, MA 02492
$-5,272
Cash flow
-12.5%
Cash-on-Cash Return
2.8%
Cap rate
0.5%
Rent to Value Ratio
Active
$4,395,000
5
bds
|
6
ba
|
8,100
sqft
|
built
1913
90 Burr Dr, Needham, MA 02492
$-21,932
Cash flow
-26.0%
Cash-on-Cash Return
0.3%
Cap rate
0.1%
Rent to Value Ratio
Active
$5,875,000
6
bds
|
8
ba
|
9,825
sqft
|
built
2025
60 Locust Ln, Needham, MA 02492
$-23,055
Cash flow
-20.5%
Cash-on-Cash Return
1.0%
Cap rate
0.1%
Rent to Value Ratio
Active
$2,475,000
6
bds
|
5
ba
|
6,752
sqft
|
built
1997
828 South St, Needham, MA 02492
$-10,401
Cash flow
-21.9%
Cash-on-Cash Return
1.2%
Cap rate
0.3%
Rent to Value Ratio

Active
$1,199,000
3
bds
|
3
ba
|
2,158
sqft
|
built
1968
23 Harvard Cir, Needham, MA 02494
$-3,742
Cash flow
-16.3%
Cash-on-Cash Return
2.5%
Cap rate
0.4%
Rent to Value Ratio
Active
$2,550,000
5
bds
|
5
ba
|
5,500
sqft
|
built
2016
50 Sterling Rd, Needham, MA 02492
$-9,418
Cash flow
-19.3%
Cash-on-Cash Return
1.8%
Cap rate
0.3%
Rent to Value Ratio

Active
$1,300,000
3
bds
|
2
ba
|
1,760
sqft
|
built
1957
36 Yale Rd, Needham, MA 02494
$-4,518
Cash flow
-18.1%
Cash-on-Cash Return
2.1%
Cap rate
0.4%
Rent to Value Ratio

Active
$2,500,000
9
bds
|
6
ba
|
4,156
sqft
|
built
2018
379 Hunnewell St, Needham, MA 02494
$-11,616
Cash flow
-24.2%
Cash-on-Cash Return
0.7%
Cap rate
0.2%
Rent to Value Ratio
Active
$895,000
3
bds
|
2
ba
|
2,008
sqft
|
built
1957
379 Dedham Ave, Needham, MA 02492
$-3,154
Cash flow
-18.4%
Cash-on-Cash Return
2.0%
Cap rate
0.3%
Rent to Value Ratio

Active
$975,000
4
bds
|
3
ba
|
1,856
sqft
|
built
1920
781 Highland Ave, Needham, MA 02494
$-2,412
Cash flow
-12.9%
Cash-on-Cash Return
3.3%
Cap rate
0.5%
Rent to Value Ratio
Active
$3,475,000
5
bds
|
6
ba
|
6,300
sqft
|
built
2025
233 Warren St, Needham, MA 02492
$-17,790
Cash flow
-26.7%
Cash-on-Cash Return
0.1%
Cap rate
0.1%
Rent to Value Ratio

Active
$1,220,000
3
bds
|
2
ba
|
1,920
sqft
|
built
1961
41 Lee Rd, Needham, MA 02494
$-4,120
Cash flow
-17.6%
Cash-on-Cash Return
2.2%
Cap rate
0.4%
Rent to Value Ratio
Active
$399,900
1
bds
|
1
ba
|
896
sqft
|
built
1968
1202 Greendale Ave, Needham, MA 02492
$-1,178
Cash flow
-15.4%
Cash-on-Cash Return
2.7%
Cap rate
0.6%
Rent to Value Ratio
Active
$2,490,000
4
bds
|
5
ba
|
5,400
sqft
|
built
1977
51 Canterbury Ln, Needham, MA 02492
$-9,507
Cash flow
-19.9%
Cash-on-Cash Return
1.7%
Cap rate
0.3%
Rent to Value Ratio
Active
$3,395,000
4
bds
|
7
ba
|
8,118
sqft
|
built
1995
130 Bridle Trail Rd, Needham, MA 02492
$-14,458
Cash flow
-22.2%
Cash-on-Cash Return
1.2%
Cap rate
0.2%
Rent to Value Ratio
Active
$2,700,000
5
bds
|
7
ba
|
6,943
sqft
|
built
2017
159 Marked Tree Rd, Needham, MA 02492
$-10,596
Cash flow
-20.5%
Cash-on-Cash Return
1.6%
Cap rate
0.3%
Rent to Value Ratio
Active
$2,195,000
4
bds
|
4
ba
|
5,565
sqft
|
built
1929
617 South St, Needham, MA 02492
$-7,724
Cash flow
-18.4%
Cash-on-Cash Return
2.0%
Cap rate
0.4%
Rent to Value Ratio
Active
$1,749,000
4
bds
|
3
ba
|
4,196
sqft
|
built
2012
343 High Rock St, Needham, MA 02492
$-6,122
Cash flow
-18.3%
Cash-on-Cash Return
2.1%
Cap rate
0.4%
Rent to Value Ratio

Active
$1,550,000
5
bds
|
5
ba
|
3,600
sqft
|
built
2020
218 Hillside Ave, Needham, MA 02494
$-4,542
Cash flow
-15.3%
Cash-on-Cash Return
2.7%
Cap rate
0.5%
Rent to Value Ratio
Active
$2,749,000
6
bds
|
7
ba
|
6,500
sqft
|
built
2025
66 Oakcrest Rd, Needham, MA 02492
$-11,316
Cash flow
-21.5%
Cash-on-Cash Return
1.3%
Cap rate
0.2%
Rent to Value Ratio
Active
$1,085,000
3
bds
|
3
ba
|
2,633
sqft
|
built
1961
36 Davenport Rd, Needham, MA 02494
$-2,798
Cash flow
-13.5%
Cash-on-Cash Return
3.2%
Cap rate
0.5%
Rent to Value Ratio
Active
$2,995,000
5
bds
|
5
ba
|
6,151
sqft
|
built
2024
18 Ina Rd, Needham, MA 02492
$-8,598
Cash flow
-15.0%
Cash-on-Cash Return
2.8%
Cap rate
0.3%
Rent to Value Ratio
Active
$2,650,000
6
bds
|
6
ba
|
6,153
sqft
|
built
2022
90 Norfolk St, Needham, MA 02492
$-8,125
Cash flow
-16.0%
Cash-on-Cash Return
2.6%
Cap rate
0.4%
Rent to Value Ratio
Active
$899,900
3
bds
|
2
ba
|
1,585
sqft
|
built
1896
181 Dedham Ave, Needham, MA 02492
$-2,344
Cash flow
-13.6%
Cash-on-Cash Return
3.1%
Cap rate
0.5%
Rent to Value Ratio

Active
$2,910,000
7
bds
|
7
ba
|
6,600
sqft
|
built
2025
443 Central Ave, Needham, MA 02494
$-12,467
Cash flow
-22.4%
Cash-on-Cash Return
1.1%
Cap rate
0.2%
Rent to Value Ratio
Active
$2,950,000
6
bds
|
9
ba
|
7,735
sqft
|
built
2025
234 Valley Rd, Needham, MA 02492
$-14,473
Cash flow
-25.6%
Cash-on-Cash Return
0.4%
Cap rate
0.1%
Rent to Value Ratio

Active
$2,699,999
5
bds
|
5
ba
|
5,300
sqft
|
built
2022
39 Donna Rd, Needham, MA 02494
$-10,797
Cash flow
-20.9%
Cash-on-Cash Return
1.5%
Cap rate
0.3%
Rent to Value Ratio
Active
$2,800,000
6
bds
|
8
ba
|
6,516
sqft
|
built
2025
118 Grosvenor Rd, Needham, MA 02492
$-9,453
Cash flow
-17.6%
Cash-on-Cash Return
2.2%
Cap rate
0.3%
Rent to Value Ratio
Active
$2,749,000
6
bds
|
7
ba
|
5,400
sqft
|
built
2025
66 Bess Rd, Needham, MA 02492
$-11,592
Cash flow
-22.0%
Cash-on-Cash Return
1.2%
Cap rate
0.1%
Rent to Value Ratio

Active
$2,200,000
5
bds
|
4
ba
|
5,232
sqft
|
built
1776
178 South St, Needham, MA 02492
$-8,976
Cash flow
-21.3%
Cash-on-Cash Return
1.4%
Cap rate
0.3%
Rent to Value Ratio

Active
$2,249,000
5
bds
|
4
ba
|
4,368
sqft
|
built
1869
758 South St, Needham, MA 02492
$-7,624
Cash flow
-17.7%
Cash-on-Cash Return
2.2%
Cap rate
0.4%
Rent to Value Ratio

Active
$2,749,000
6
bds
|
7
ba
|
5,826
sqft
|
built
2022
547 Webster St, Needham, MA 02494
$-7,181
Cash flow
-13.6%
Cash-on-Cash Return
3.1%
Cap rate
0.4%
Rent to Value Ratio

Active
$4,588,000
6
bds
|
7
ba
|
6,300
sqft
|
built
2018
53 Heather Ln, Needham, MA 02492
$-18,955
Cash flow
-21.6%
Cash-on-Cash Return
1.3%
Cap rate
0.2%
Rent to Value Ratio

Active
$2,850,000
5
bds
|
7
ba
|
9,466
sqft
|
built
2024
59 Yale Rd, Needham, MA 02494
$-10,061
Cash flow
-18.4%
Cash-on-Cash Return
2.0%
Cap rate
0.3%
Rent to Value Ratio