Needham, MA Investment Properties for Sale
Browse homes for sale and investment properties in Needham, MA. Refine your search by price, property type, or more.
Best cash flowing properties in Needham, MA
Active
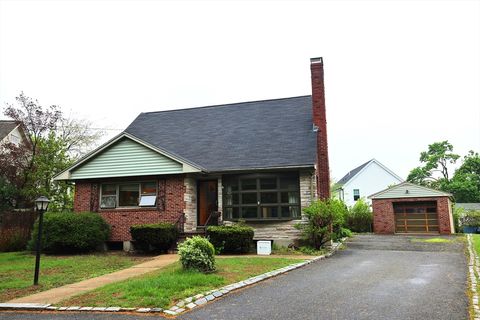
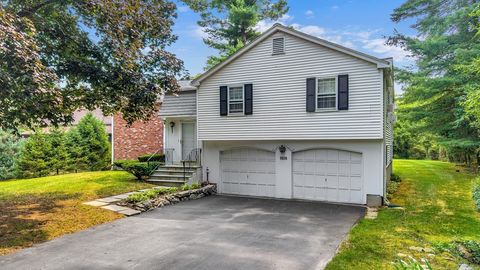
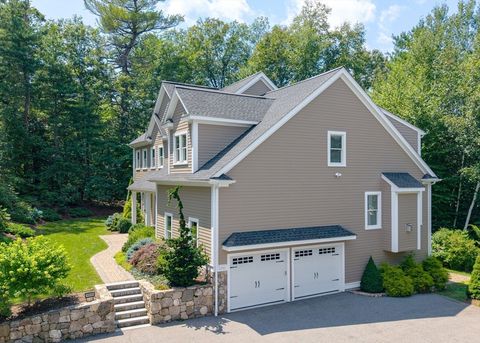
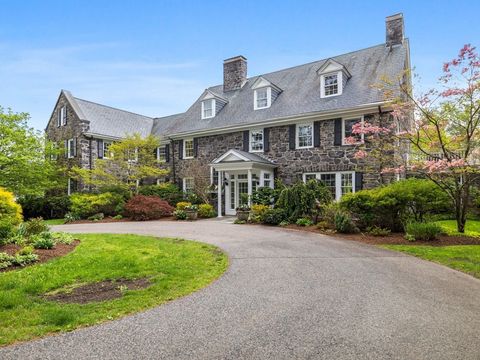
$999,900
3
bds
|
3
ba
|
2,633
sqft
|
built
1961
36 Davenport Rd, Needham, MA 02494
$-1,866
Cash flow
-9.7%
Cash-on-Cash Return
3.4%
Cap rate
0.6%
Rent to Value Ratio
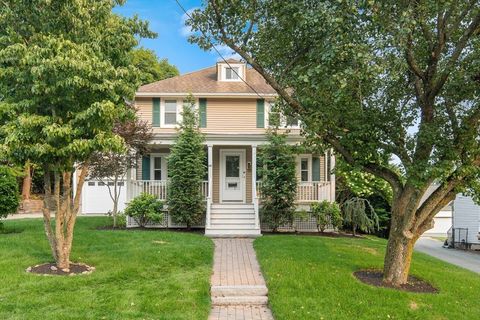
Active
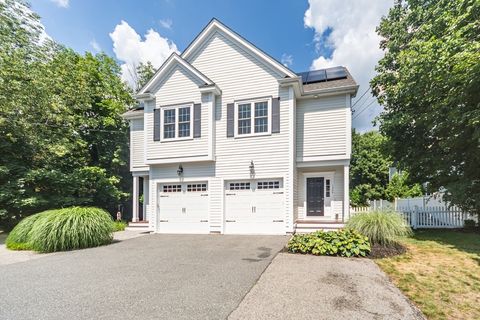
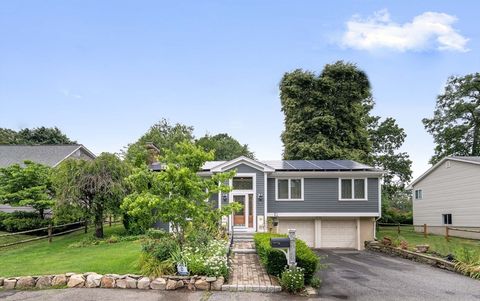
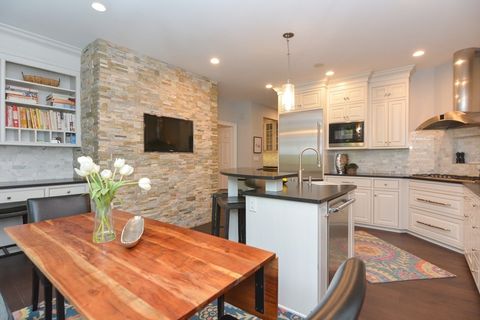
$1,199,900
3
bds
|
4
ba
|
2,073
sqft
|
built
2012
1345 South St, Needham, MA 02492
$-3,220
Cash flow
-14.0%
Cash-on-Cash Return
2.5%
Cap rate
0.4%
Rent to Value Ratio
18 out of 26 properties for sale in Needham, MA
Limited Results Shown
Create a free account, or log in to reveal all property listings and enjoy the complete experience.
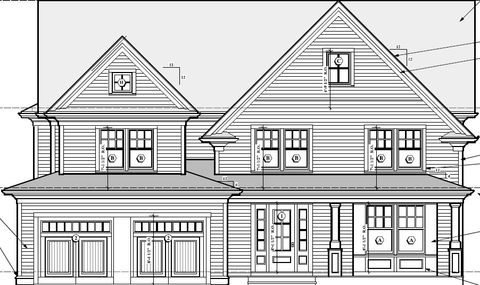
Active
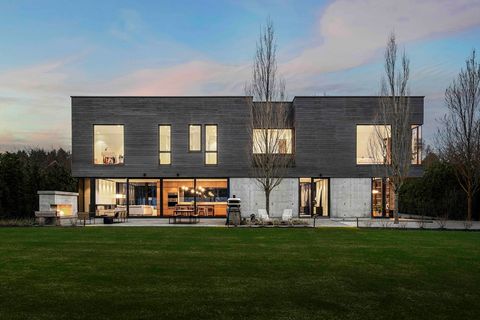
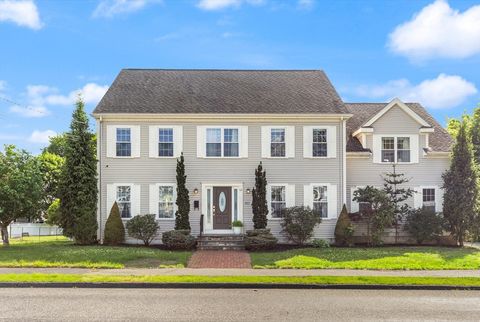
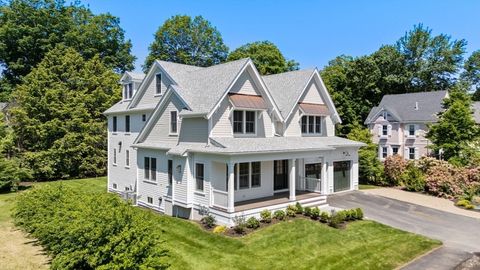
$4,299,000
4
bds
|
5
ba
|
4,420
sqft
|
built
2020
37 Carleton Dr, Needham, MA 02492
$-17,046
Cash flow
-20.7%
Cash-on-Cash Return
0.9%
Cap rate
0.2%
Rent to Value Ratio
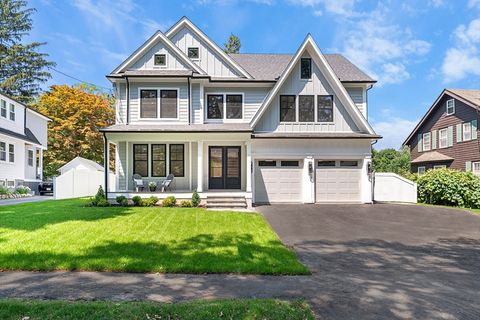
Active
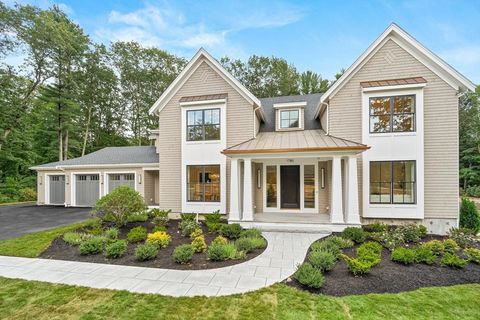
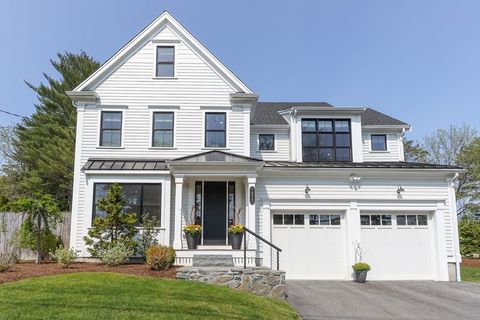
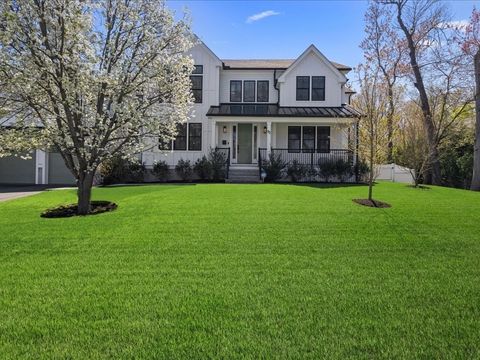
$4,495,000
6
bds
|
7
ba
|
7,867
sqft
|
built
2025
1780 Central Ave, Needham, MA 02492
$-101,086
Cash flow
-117.3%
Cash-on-Cash Return
-21.3%
Cap rate
0.1%
Rent to Value Ratio
Active
$1,495,000
3
bds
|
3
ba
|
2,603
sqft
|
built
1971
1574 Central Ave, Needham, MA 02492
$-4,085
Cash flow
-14.3%
Cash-on-Cash Return
2.4%
Cap rate
0.4%
Rent to Value Ratio
Active
$1,950,000
5
bds
|
5
ba
|
3,620
sqft
|
built
1915
60 Rosemary St, Needham, MA 02494
$-5,564
Cash flow
-14.9%
Cash-on-Cash Return
2.3%
Cap rate
0.4%
Rent to Value Ratio
Active
$2,890,000
6
bds
|
6
ba
|
6,735
sqft
|
built
2025
201 Valley Rd, Needham, MA 02492
$-11,319
Cash flow
-20.4%
Cash-on-Cash Return
1.0%
Cap rate
0.2%
Rent to Value Ratio
Active
$2,999,000
6
bds
|
6
ba
|
6,482
sqft
|
built
2025
59 Henderson St, Needham, MA 02492
$-11,851
Cash flow
-20.6%
Cash-on-Cash Return
0.9%
Cap rate
0.2%
Rent to Value Ratio
Active
$2,499,000
4
bds
|
4
ba
|
4,621
sqft
|
built
2016
1332 Great Plain Ave, Needham, MA 02492
$-7,959
Cash flow
-16.6%
Cash-on-Cash Return
1.9%
Cap rate
0.3%
Rent to Value Ratio
Active
$1,899,000
4
bds
|
3
ba
|
3,596
sqft
|
built
1957
156 Woodbine Cir, Needham, MA 02494
$-6,295
Cash flow
-17.3%
Cash-on-Cash Return
1.7%
Cap rate
0.3%
Rent to Value Ratio
Active
$2,350,000
6
bds
|
5
ba
|
3,698
sqft
|
built
2005
263 Hunnewell St, Needham, MA 02494
$-7,058
Cash flow
-15.7%
Cash-on-Cash Return
2.1%
Cap rate
0.3%
Rent to Value Ratio
Active
$2,195,000
6
bds
|
5
ba
|
4,410
sqft
|
built
2020
1473 Great Plain Ave, Needham, MA 02492
$-5,272
Cash flow
-12.5%
Cash-on-Cash Return
2.8%
Cap rate
0.5%
Rent to Value Ratio
Active
$4,395,000
5
bds
|
6
ba
|
8,100
sqft
|
built
1913
90 Burr Dr, Needham, MA 02492
$-19,879
Cash flow
-23.6%
Cash-on-Cash Return
0.3%
Cap rate
0.1%
Rent to Value Ratio
Active
$2,475,000
6
bds
|
5
ba
|
6,752
sqft
|
built
1997
828 South St, Needham, MA 02492
$-9,192
Cash flow
-19.4%
Cash-on-Cash Return
1.2%
Cap rate
0.3%
Rent to Value Ratio
Active
$2,395,000
5
bds
|
5
ba
|
5,500
sqft
|
built
2016
50 Sterling Rd, Needham, MA 02492
$-7,439
Cash flow
-16.2%
Cash-on-Cash Return
2.0%
Cap rate
0.3%
Rent to Value Ratio
Active
$3,475,000
5
bds
|
6
ba
|
6,300
sqft
|
built
2025
233 Warren St, Needham, MA 02492
$-16,093
Cash flow
-24.2%
Cash-on-Cash Return
0.1%
Cap rate
0.1%
Rent to Value Ratio
Active
$2,599,000
6
bds
|
6
ba
|
6,153
sqft
|
built
2022
90 Norfolk St, Needham, MA 02492
$-6,589
Cash flow
-13.2%
Cash-on-Cash Return
2.6%
Cap rate
0.4%
Rent to Value Ratio
Active
$2,175,000
5
bds
|
4
ba
|
4,368
sqft
|
built
1869
758 South St, Needham, MA 02492
$-6,176
Cash flow
-14.8%
Cash-on-Cash Return
2.3%
Cap rate
0.4%
Rent to Value Ratio