New Bedford, MA Investment Properties for Sale
Browse homes for sale and investment properties in New Bedford, MA. Refine your search by price, property type, or more.
Best cash flowing properties in New Bedford, MA
Active
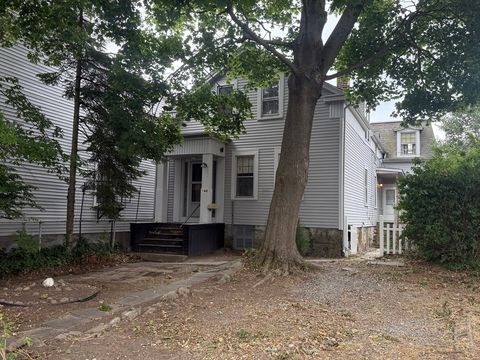
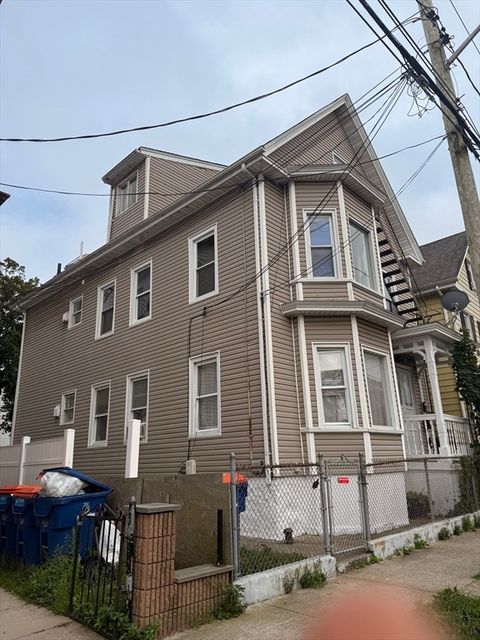
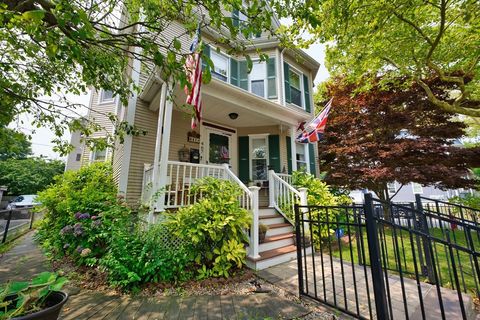
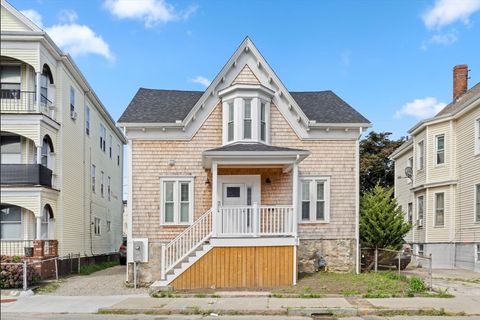
$325,000
4
bds
|
2
ba
|
2,058
sqft
|
built
1855
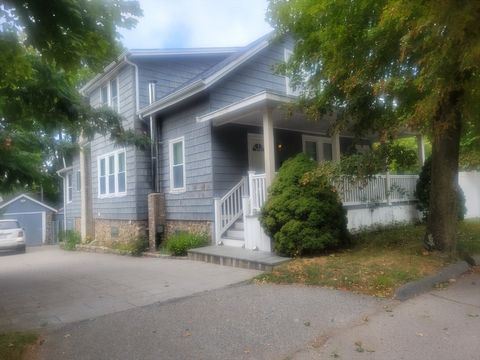
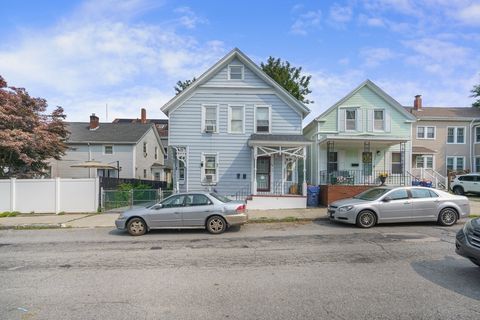
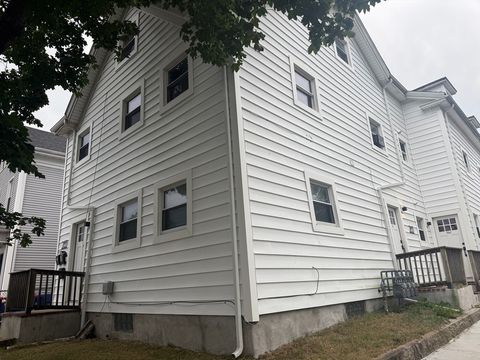
162 Elm St, New Bedford, MA 02740
$308
Cash flow
4.9%
Cash-on-Cash Return
6.8%
Cap rate
1.0%
Rent to Value Ratio
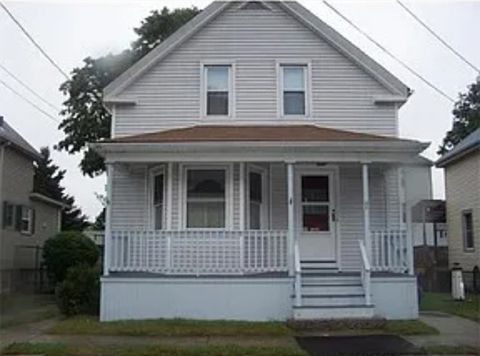
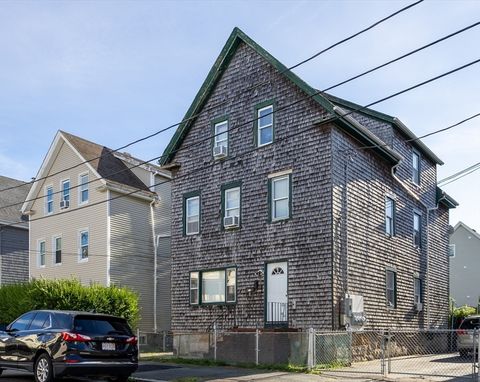
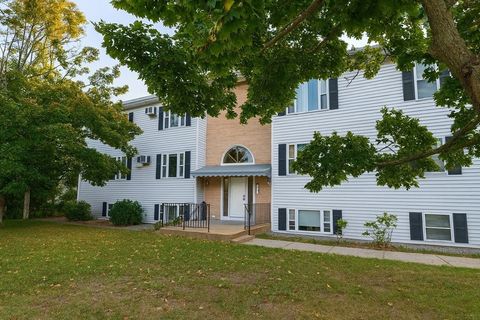
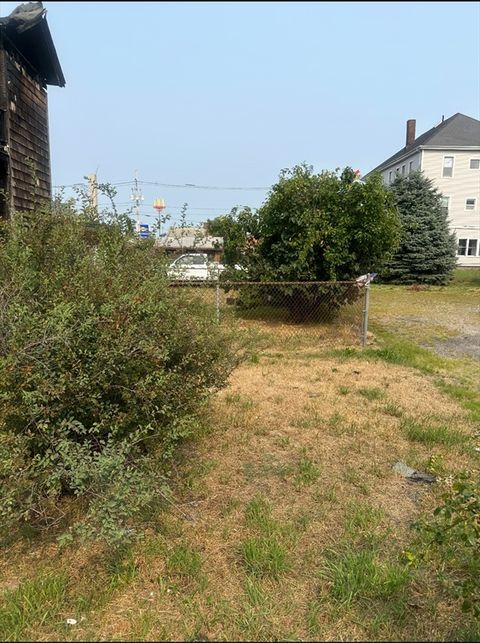
Active
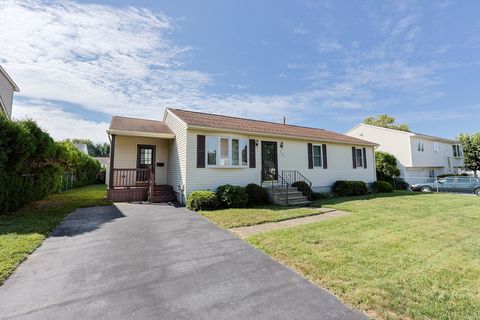
$330,000
3
bds
|
2
ba
|
1,247
sqft
|
built
1897
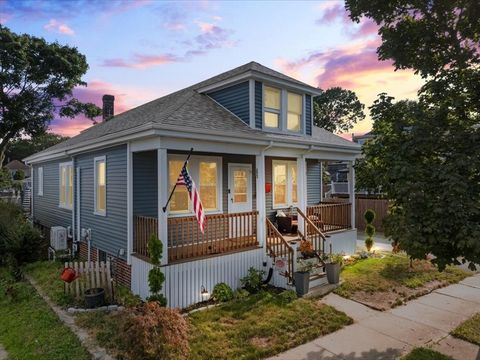
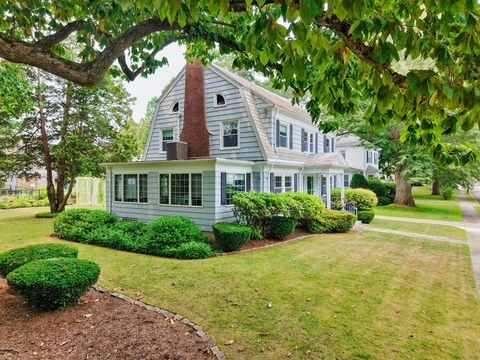
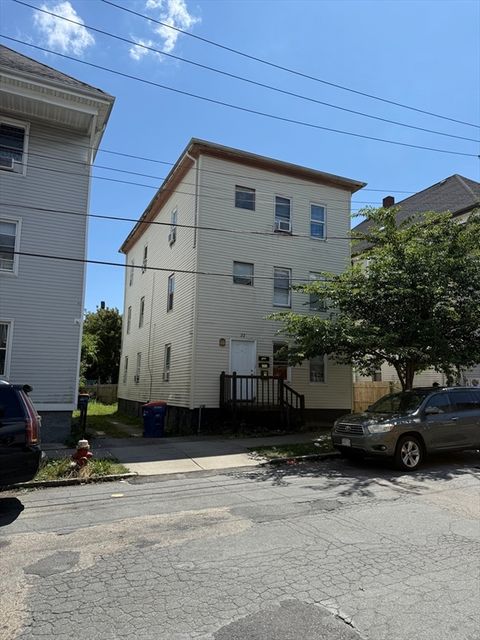
45 Vine St, New Bedford, MA 02740
$-115
Cash flow
-1.8%
Cash-on-Cash Return
5.3%
Cap rate
0.8%
Rent to Value Ratio
70 out of 86 properties for sale in New Bedford, MA
Limited Results Shown
Create a free account, or log in to reveal all property listings and enjoy the complete experience.
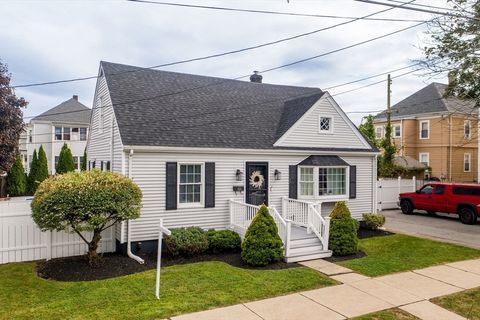
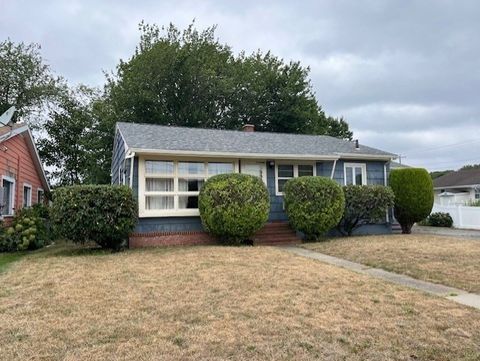
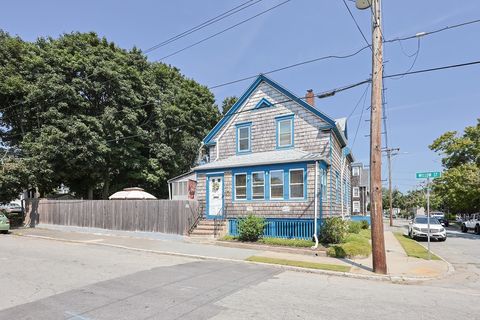
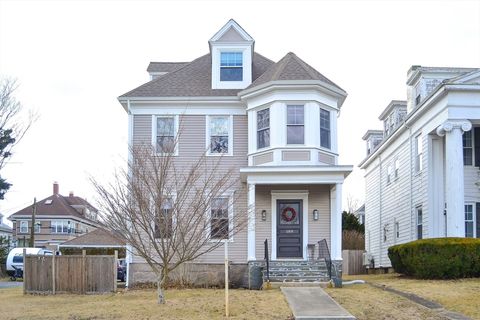
Active
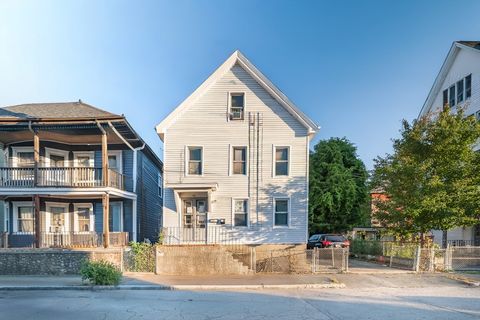
$598,900
3
bds
|
2
ba
|
1,444
sqft
|
built
1950
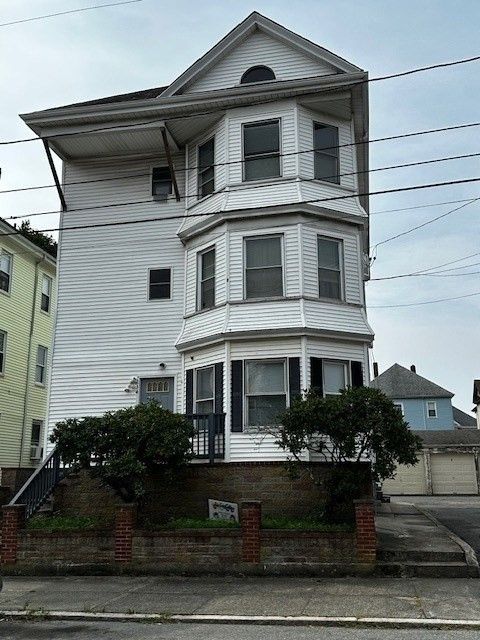
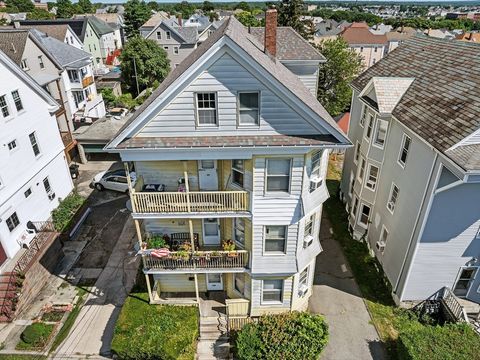
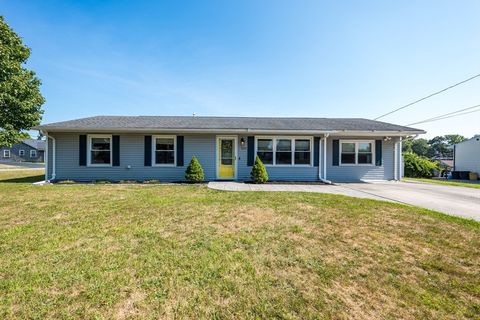
166 Charles St, New Bedford, MA 02744
$-1,105
Cash flow
-9.6%
Cash-on-Cash Return
3.5%
Cap rate
0.5%
Rent to Value Ratio
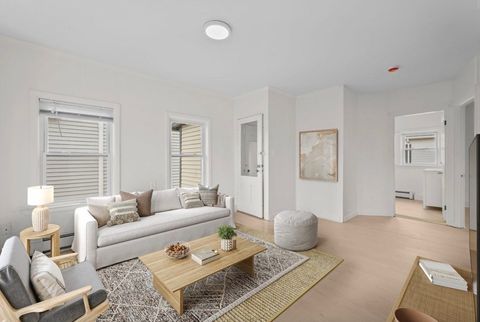
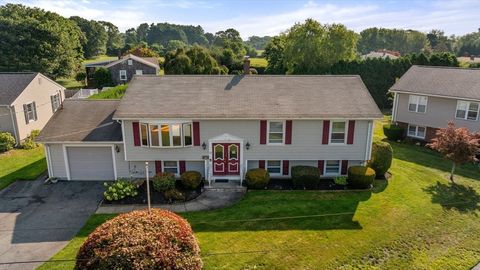
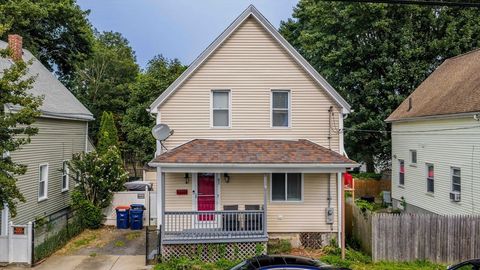
Active
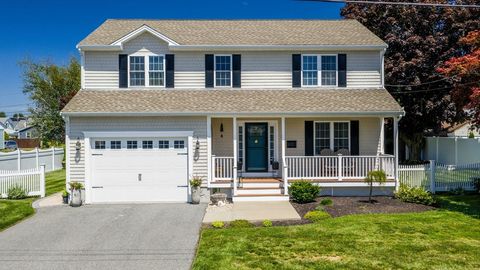
$375,000
3
bds
|
2
ba
|
1,128
sqft
|
built
1897
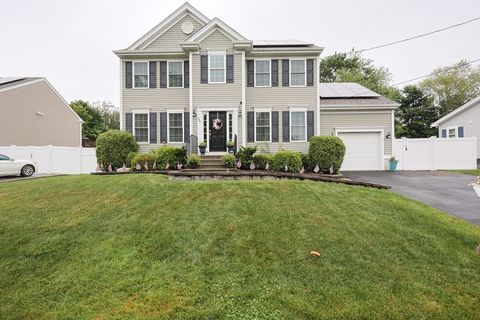
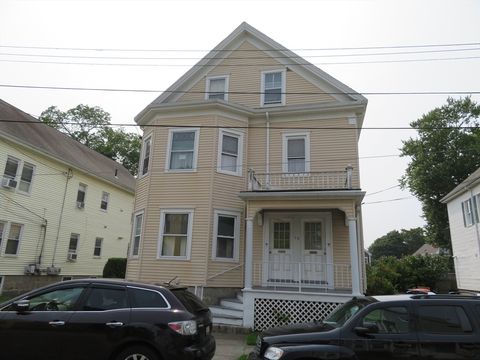
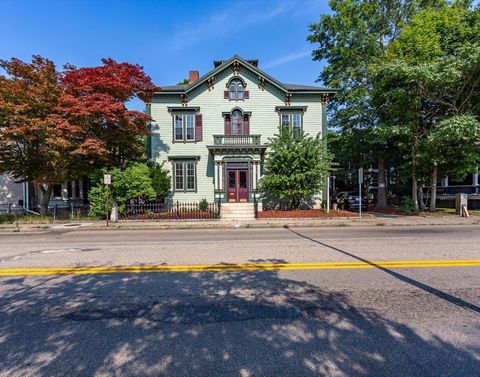
6 Coffin Avenue Ct, New Bedford, MA 02746
$-628
Cash flow
-8.7%
Cash-on-Cash Return
3.7%
Cap rate
0.5%
Rent to Value Ratio
Active
$489,000
3
bds
|
2
ba
|
1,044
sqft
|
built
1988
3 Canterberry St, New Bedford, MA 02746
$-932
Cash flow
-9.9%
Cash-on-Cash Return
3.4%
Cap rate
0.5%
Rent to Value Ratio
Active
$489,000
3
bds
|
2
ba
|
1,530
sqft
|
built
1940
17 Grove St, New Bedford, MA 02740
$-894
Cash flow
-9.5%
Cash-on-Cash Return
3.5%
Cap rate
0.5%
Rent to Value Ratio
Active
$459,000
4
bds
|
2
ba
|
1,456
sqft
|
built
1915
122 Armour St, New Bedford, MA 02740
$-405
Cash flow
-4.6%
Cash-on-Cash Return
4.6%
Cap rate
0.7%
Rent to Value Ratio
Active
$570,000
5
bds
|
3
ba
|
2,160
sqft
|
built
1892
518 Cottage St, New Bedford, MA 02740
$-1,571
Cash flow
-14.4%
Cash-on-Cash Return
2.4%
Cap rate
0.4%
Rent to Value Ratio
Active
$499,000
6
bds
|
3
ba
|
2,417
sqft
|
built
1896
9 Abbott St, New Bedford, MA 02744
$-1,373
Cash flow
-14.4%
Cash-on-Cash Return
2.4%
Cap rate
0.4%
Rent to Value Ratio
Active
$819,900
4
bds
|
5
ba
|
3,419
sqft
|
built
1875
97 Madison St, New Bedford, MA 02740
$-2,355
Cash flow
-15.0%
Cash-on-Cash Return
2.2%
Cap rate
0.4%
Rent to Value Ratio
Active
$389,900
3
bds
|
1
ba
|
980
sqft
|
built
1957
161 Portland St, New Bedford, MA 02744
$-790
Cash flow
-10.6%
Cash-on-Cash Return
3.2%
Cap rate
0.5%
Rent to Value Ratio
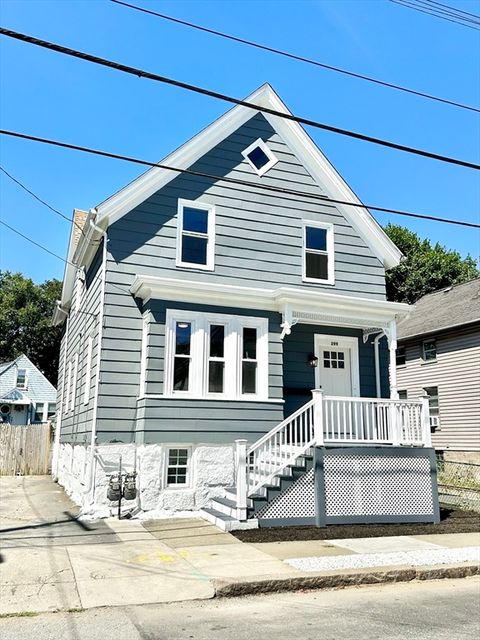
Active
$489,900
3
bds
|
2
ba
|
1,762
sqft
|
built
1893
299 Cedar St, New Bedford, MA 02740
$-1,086
Cash flow
-11.6%
Cash-on-Cash Return
3.0%
Cap rate
0.4%
Rent to Value Ratio
Active
$689,000
5
bds
|
3
ba
|
2,800
sqft
|
built
1920
683 Church St, New Bedford, MA 02745
$-1,901
Cash flow
-14.4%
Cash-on-Cash Return
2.4%
Cap rate
0.4%
Rent to Value Ratio

Active
$675,000
9
bds
|
3
ba
|
3,321
sqft
|
built
1908
212 Weld St, New Bedford, MA 02740
$-2,416
Cash flow
-18.7%
Cash-on-Cash Return
1.4%
Cap rate
0.3%
Rent to Value Ratio
Active
$449,000
3
bds
|
1
ba
|
1,292
sqft
|
built
1927
370 Wood St, New Bedford, MA 02745
$-689
Cash flow
-8.0%
Cash-on-Cash Return
3.8%
Cap rate
0.6%
Rent to Value Ratio
Active
$730,000
9
bds
|
3
ba
|
3,774
sqft
|
built
1911
234 Phillips Ave, New Bedford, MA 02746
$-2,634
Cash flow
-18.8%
Cash-on-Cash Return
1.3%
Cap rate
0.3%
Rent to Value Ratio
Active
$599,900
3
bds
|
3
ba
|
2,430
sqft
|
built
2015
957 Glen St, New Bedford, MA 02745
$-1,170
Cash flow
-10.2%
Cash-on-Cash Return
3.3%
Cap rate
0.5%
Rent to Value Ratio
Active
$535,000
6
bds
|
3
ba
|
2,159
sqft
|
built
1900
160 Purchase St, New Bedford, MA 02740
$-1,528
Cash flow
-14.9%
Cash-on-Cash Return
2.3%
Cap rate
0.4%
Rent to Value Ratio
Active
$289,900
2
bds
|
1
ba
|
800
sqft
|
built
1988
3289 Acushnet Ave, New Bedford, MA 02745
$-482
Cash flow
-8.7%
Cash-on-Cash Return
3.7%
Cap rate
0.7%
Rent to Value Ratio
Active
$499,900
3
bds
|
2
ba
|
1,214
sqft
|
built
1900
101 Willow St, New Bedford, MA 02740
$-852
Cash flow
-8.9%
Cash-on-Cash Return
3.6%
Cap rate
0.5%
Rent to Value Ratio
Active
$550,000
3
bds
|
3
ba
|
2,017
sqft
|
built
1985
26 Rounseville St, New Bedford, MA 02745
$-1,008
Cash flow
-9.6%
Cash-on-Cash Return
3.5%
Cap rate
0.5%
Rent to Value Ratio
Active
$549,900
3
bds
|
2
ba
|
1,823
sqft
|
built
1900
467 Brock Ave, New Bedford, MA 02744
$-1,051
Cash flow
-10.0%
Cash-on-Cash Return
3.4%
Cap rate
0.5%
Rent to Value Ratio
Active
$500,000
3
bds
|
2
ba
|
1,288
sqft
|
built
1993
868 Phillips Rd, New Bedford, MA 02745
$-870
Cash flow
-9.1%
Cash-on-Cash Return
3.6%
Cap rate
0.6%
Rent to Value Ratio
Active
$489,900
6
bds
|
3
ba
|
1,817
sqft
|
built
1884
42 Division St, New Bedford, MA 02744
$-1,295
Cash flow
-13.8%
Cash-on-Cash Return
2.5%
Cap rate
0.4%
Rent to Value Ratio
Active
$599,900
3
bds
|
3
ba
|
1,512
sqft
|
built
2012
37 Luke St, New Bedford, MA 02740
$-1,366
Cash flow
-11.9%
Cash-on-Cash Return
2.9%
Cap rate
0.5%
Rent to Value Ratio
Active
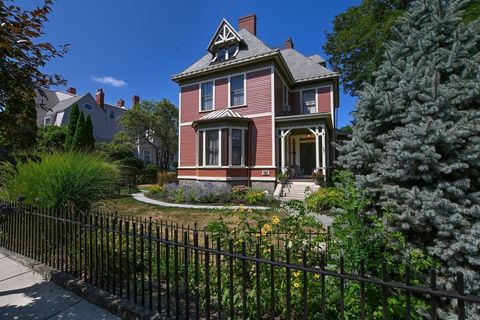
$475,000
4
bds
|
2
ba
|
1,493
sqft
|
built
1877
197 County St, New Bedford, MA 02740
$-239
Cash flow
-2.6%
Cash-on-Cash Return
5.1%
Cap rate
0.7%
Rent to Value Ratio
Active
$475,000
6
bds
|
2
ba
|
1,524
sqft
|
built
1926
24 Cotter St, New Bedford, MA 02746
$-1,031
Cash flow
-11.3%
Cash-on-Cash Return
3.1%
Cap rate
0.5%
Rent to Value Ratio
Active
$699,000
7
bds
|
4
ba
|
3,009
sqft
|
built
1897
189 Orchard St, New Bedford, MA 02740
$-1,172
Cash flow
-8.7%
Cash-on-Cash Return
3.7%
Cap rate
0.6%
Rent to Value Ratio
Active
$389,900
3
bds
|
2
ba
|
1,016
sqft
|
built
1896
82 Pierce St, New Bedford, MA 02740
$-432
Cash flow
-5.8%
Cash-on-Cash Return
4.3%
Cap rate
0.6%
Rent to Value Ratio
Active
$450,000
4
bds
|
2
ba
|
1,596
sqft
|
built
1886
135 Arnold St, New Bedford, MA 02740
$-1,069
Cash flow
-12.4%
Cash-on-Cash Return
2.8%
Cap rate
0.4%
Rent to Value Ratio
Active
$849,000
3
bds
|
3
ba
|
3,869
sqft
|
built
1927
27 Meriam St, New Bedford, MA 02740
$-1,081
Cash flow
-6.6%
Cash-on-Cash Return
4.2%
Cap rate
0.6%
Rent to Value Ratio
Active
$605,000
9
bds
|
4
ba
|
3,798
sqft
|
built
1915
141 Peckham St, New Bedford, MA 02746
$-1,833
Cash flow
-15.8%
Cash-on-Cash Return
2.0%
Cap rate
0.4%
Rent to Value Ratio
Active
$549,000
6
bds
|
2
ba
|
2,728
sqft
|
built
1903
15 Richmond St, New Bedford, MA 02740
$-1,433
Cash flow
-13.6%
Cash-on-Cash Return
2.5%
Cap rate
0.4%
Rent to Value Ratio
Active
$770,000
11
bds
|
4
ba
|
3,802
sqft
|
built
1870
263 Acushnet Ave, New Bedford, MA 02740
$-2,201
Cash flow
-14.9%
Cash-on-Cash Return
2.2%
Cap rate
0.4%
Rent to Value Ratio
Active
$474,900
3
bds
|
2
ba
|
1,316
sqft
|
built
1973
150 Townsend St, New Bedford, MA 02746
$-930
Cash flow
-10.2%
Cash-on-Cash Return
3.3%
Cap rate
0.5%
Rent to Value Ratio
Active
$499,000
4
bds
|
3
ba
|
3,394
sqft
|
built
1855
546 County St, New Bedford, MA 02740
$-752
Cash flow
-7.9%
Cash-on-Cash Return
3.9%
Cap rate
0.6%
Rent to Value Ratio
Active
$479,999
6
bds
|
3
ba
|
2,769
sqft
|
built
1897
22 Holly St, New Bedford, MA 02746
$-1,250
Cash flow
-13.6%
Cash-on-Cash Return
2.6%
Cap rate
0.4%
Rent to Value Ratio
Active
$565,000
3
bds
|
2
ba
|
1,912
sqft
|
built
2014
2992 Acushnet Ave, New Bedford, MA 02745
$-1,120
Cash flow
-10.3%
Cash-on-Cash Return
3.3%
Cap rate
0.6%
Rent to Value Ratio
Active
$469,900
3
bds
|
3
ba
|
1,414
sqft
|
built
1926
896 Rockdale Ave, New Bedford, MA 02740
$-629
Cash flow
-7.0%
Cash-on-Cash Return
4.1%
Cap rate
0.6%
Rent to Value Ratio
Active
$459,000
4
bds
|
2
ba
|
2,003
sqft
|
built
1906
18 Edison St, New Bedford, MA 02745
$-972
Cash flow
-11.0%
Cash-on-Cash Return
3.1%
Cap rate
0.5%
Rent to Value Ratio