New Buffalo, MI Investment Properties for Sale
Browse homes for sale and investment properties in New Buffalo, MI. Refine your search by price, property type, or more.
Best cash flowing properties in New Buffalo, MI
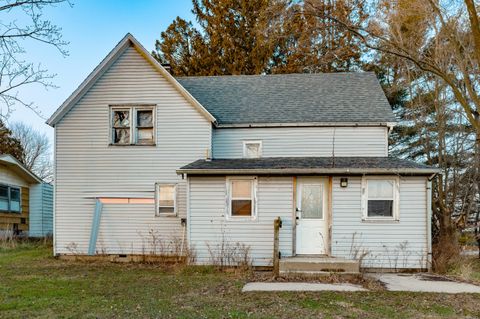
Active
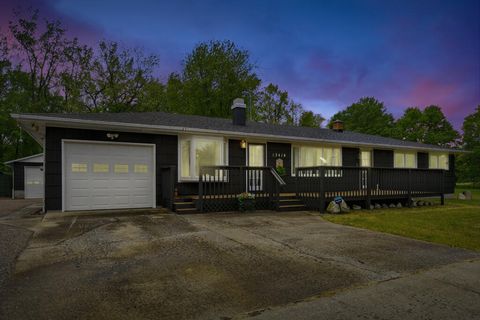
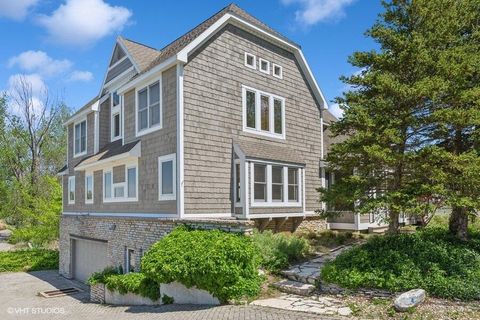
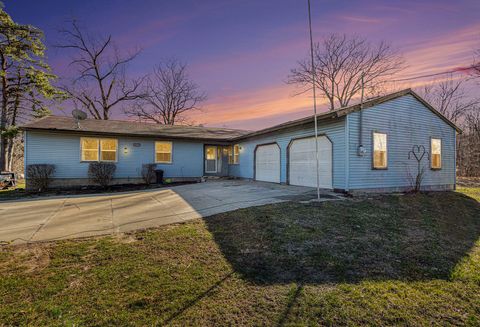
$639,000
3
bds
|
3
ba
|
3,170
sqft
|
built
1960
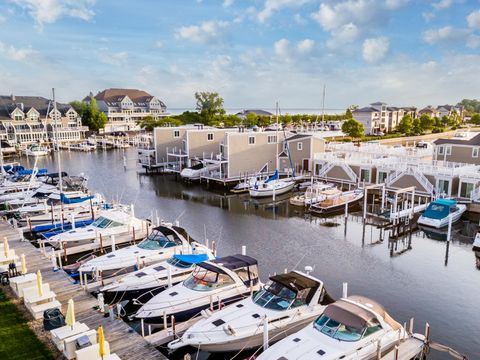
13414 Wilson Rd, New Buffalo, MI 49117
$-1,384
Cash flow
-11.3%
Cash-on-Cash Return
3.5%
Cap rate
0.4%
Rent to Value Ratio
Active
$590,000
bds
|
0
ba
|
0
sqft
|
built
1960
121 E Michigan St, New Buffalo, MI 49117
$-1,501
Cash flow
-13.3%
Cash-on-Cash Return
3.1%
Cap rate
0.5%
Rent to Value Ratio
29 out of 35 properties for sale in New Buffalo, MI
Limited Results Shown
Create a free account, or log in to reveal all property listings and enjoy the complete experience.

Active
$699,000
3
bds
|
3
ba
|
2,188
sqft
|
built
1988
4160 Creek Dr, New Buffalo, MI 49117
$-1,799
Cash flow
-13.4%
Cash-on-Cash Return
3.1%
Cap rate
0.5%
Rent to Value Ratio
Active
$1,200,000
3
bds
|
3
ba
|
2,516
sqft
|
built
1996
19745 S Lakeside Rd, New Buffalo, MI 49117
$-4,824
Cash flow
-21.0%
Cash-on-Cash Return
1.3%
Cap rate
0.3%
Rent to Value Ratio
Active
$630,000
3
bds
|
3
ba
|
2,284
sqft
|
built
1983
1501 W Water St, New Buffalo, MI 49117
$-3,837
Cash flow
-31.8%
Cash-on-Cash Return
-1.2%
Cap rate
0.3%
Rent to Value Ratio

Active
$875,000
4
bds
|
5
ba
|
5,032
sqft
|
built
1968
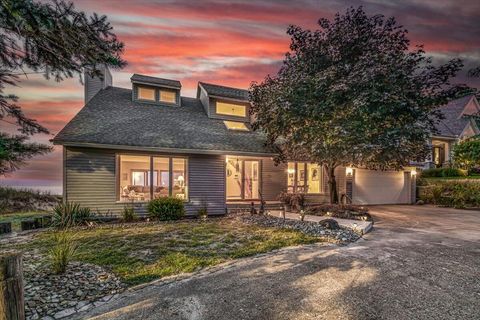
1321 Shore Dr, New Buffalo, MI 49117
$-2,082
Cash flow
-12.4%
Cash-on-Cash Return
3.3%
Cap rate
0.5%
Rent to Value Ratio

Active
$1,249,000
5
bds
|
4
ba
|
1,640
sqft
|
built
2001
16888 Basswood Dr, New Buffalo, MI 49117
$-4,914
Cash flow
-20.5%
Cash-on-Cash Return
1.4%
Cap rate
0.2%
Rent to Value Ratio
Active
$995,000
3
bds
|
3
ba
|
2,107
sqft
|
built
1989
18 Harbor Isle Dr, New Buffalo, MI 49117
$-3,769
Cash flow
-19.8%
Cash-on-Cash Return
1.6%
Cap rate
0.3%
Rent to Value Ratio
Active
$2,750,000
6
bds
|
5
ba
|
3,000
sqft
|
built
1862
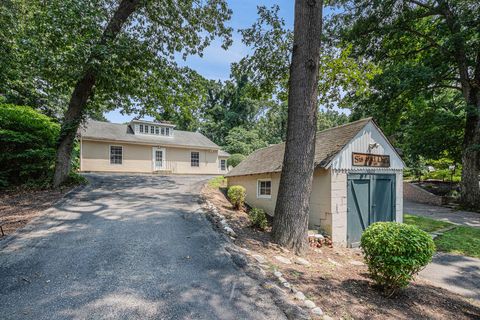
116 N Smith St, New Buffalo, MI 49117
$-13,595
Cash flow
-25.8%
Cash-on-Cash Return
0.2%
Cap rate
0.1%
Rent to Value Ratio
Active
$4,150,000
4
bds
|
3
ba
|
1,560
sqft
|
built
1986
300 Marquette Dr, New Buffalo, MI 49117
$-18,086
Cash flow
-22.7%
Cash-on-Cash Return
0.9%
Cap rate
0.1%
Rent to Value Ratio

Active
$1,899,000
4
bds
|
4
ba
|
4,877
sqft
|
built
2011
52300 E Arnold Dr, New Buffalo, MI 49117
$-8,466
Cash flow
-23.3%
Cash-on-Cash Return
0.8%
Cap rate
0.2%
Rent to Value Ratio

Active
$1,599,999
5
bds
|
4
ba
|
4,968
sqft
|
built
2008
13077 Wilson Rd, New Buffalo, MI 49117
$-5,708
Cash flow
-18.6%
Cash-on-Cash Return
1.9%
Cap rate
0.3%
Rent to Value Ratio
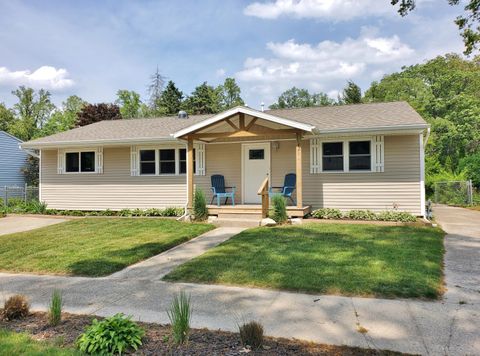
Active
$599,000
4
bds
|
2
ba
|
1,603
sqft
|
built
1950
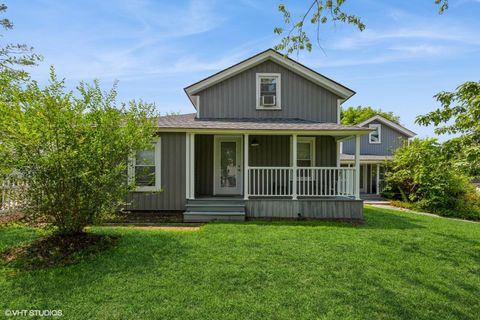
49209 Howard Ave, New Buffalo, MI 49117
$-1,785
Cash flow
-15.5%
Cash-on-Cash Return
2.6%
Cap rate
0.4%
Rent to Value Ratio
Active
$899,000
6
bds
|
1
ba
|
1,866
sqft
|
built
1920
11412 Wilson Rd, New Buffalo, MI 49117
$-3,204
Cash flow
-18.6%
Cash-on-Cash Return
1.9%
Cap rate
0.3%
Rent to Value Ratio
Active
$564,000
3
bds
|
2
ba
|
1,476
sqft
|
built
1964
121 S Marshall St, New Buffalo, MI 49117
$-2,146
Cash flow
-19.9%
Cash-on-Cash Return
1.6%
Cap rate
0.3%
Rent to Value Ratio

Active
$1,700,000
3
bds
|
2
ba
|
1,850
sqft
|
built
1950
1414 Shore Dr, New Buffalo, MI 49117
$-7,658
Cash flow
-23.5%
Cash-on-Cash Return
0.7%
Cap rate
0.2%
Rent to Value Ratio
Active
$949,000
5
bds
|
4
ba
|
3,273
sqft
|
built
1970
1501 Shore Dr, New Buffalo, MI 49117
$-3,233
Cash flow
-17.8%
Cash-on-Cash Return
2.1%
Cap rate
0.3%
Rent to Value Ratio

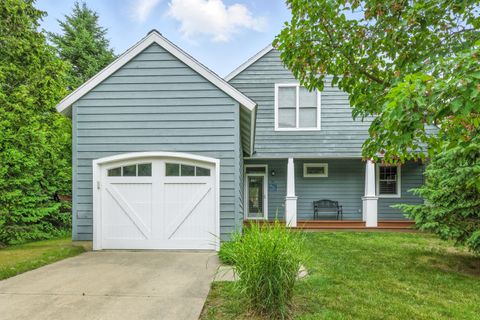
Active
$995,000
4
bds
|
4
ba
|
3,356
sqft
|
built
2021
18734 Leonard Ct, New Buffalo, MI 49117
$-3,374
Cash flow
-17.7%
Cash-on-Cash Return
2.1%
Cap rate
0.4%
Rent to Value Ratio
Active
$739,900
3
bds
|
4
ba
|
1,800
sqft
|
built
2003
10 Pond Path, New Buffalo, MI 49117
$-2,758
Cash flow
-19.4%
Cash-on-Cash Return
1.7%
Cap rate
0.4%
Rent to Value Ratio

Active
$599,999
3
bds
|
2
ba
|
1,609
sqft
|
built
1915
121 S Barker St, New Buffalo, MI 49117
$-1,609
Cash flow
-14.0%
Cash-on-Cash Return
2.9%
Cap rate
0.5%
Rent to Value Ratio

Active
$550,000
4
bds
|
2
ba
|
1,636
sqft
|
built
1925
22 S Smith St, New Buffalo, MI 49117
$-1,674
Cash flow
-15.9%
Cash-on-Cash Return
2.5%
Cap rate
0.4%
Rent to Value Ratio
Active
$2,250,000
4
bds
|
5
ba
|
3,902
sqft
|
built
2002
210 E Water St, New Buffalo, MI 49117
$-9,497
Cash flow
-22.0%
Cash-on-Cash Return
1.1%
Cap rate
0.2%
Rent to Value Ratio

Active
$695,000
4
bds
|
2
ba
|
1,904
sqft
|
built
1963
819 W Michigan St, New Buffalo, MI 49117
$-1,696
Cash flow
-12.7%
Cash-on-Cash Return
3.2%
Cap rate
0.5%
Rent to Value Ratio

Active
$784,900
4
bds
|
3
ba
|
2,550
sqft
|
built
2022
508 S Jameson St, New Buffalo, MI 49117
$-1,649
Cash flow
-11.0%
Cash-on-Cash Return
3.6%
Cap rate
0.5%
Rent to Value Ratio
Active
$1,099,000
2
bds
|
2
ba
|
1,164
sqft
|
built
1987
409 Lake Dr, New Buffalo, MI 49117
$-4,472
Cash flow
-21.2%
Cash-on-Cash Return
1.3%
Cap rate
0.3%
Rent to Value Ratio
Active
$675,000
3
bds
|
2
ba
|
1,350
sqft
|
built
1950
1359 Bell Ave, New Buffalo, MI 49117
$-2,533
Cash flow
-19.6%
Cash-on-Cash Return
1.6%
Cap rate
0.4%
Rent to Value Ratio
Active
$1,199,000
4
bds
|
3
ba
|
3,084
sqft
|
built
1930
312 S Whittaker St, New Buffalo, MI 49117
$-4,479
Cash flow
-19.5%
Cash-on-Cash Return
1.7%
Cap rate
0.2%
Rent to Value Ratio
Active
$1,399,000
4
bds
|
3
ba
|
1,738
sqft
|
built
1984
10172 US Highway 12, New Buffalo, MI 49117
$-3,834
Cash flow
-14.3%
Cash-on-Cash Return
2.9%
Cap rate
0.4%
Rent to Value Ratio
Active
$4,895,000
7
bds
|
8
ba
|
10,167
sqft
|
built
2009
49106 Sun Valley Falls Blvd, New Buffalo, MI 49117
$-22,974
Cash flow
-24.5%
Cash-on-Cash Return
0.5%
Cap rate
0.1%
Rent to Value Ratio