New Buffalo, MI Investment Properties for Sale
Browse homes for sale and investment properties in New Buffalo, MI. Refine your search by price, property type, or more.
Best cash flowing properties in New Buffalo, MI

Active under contract
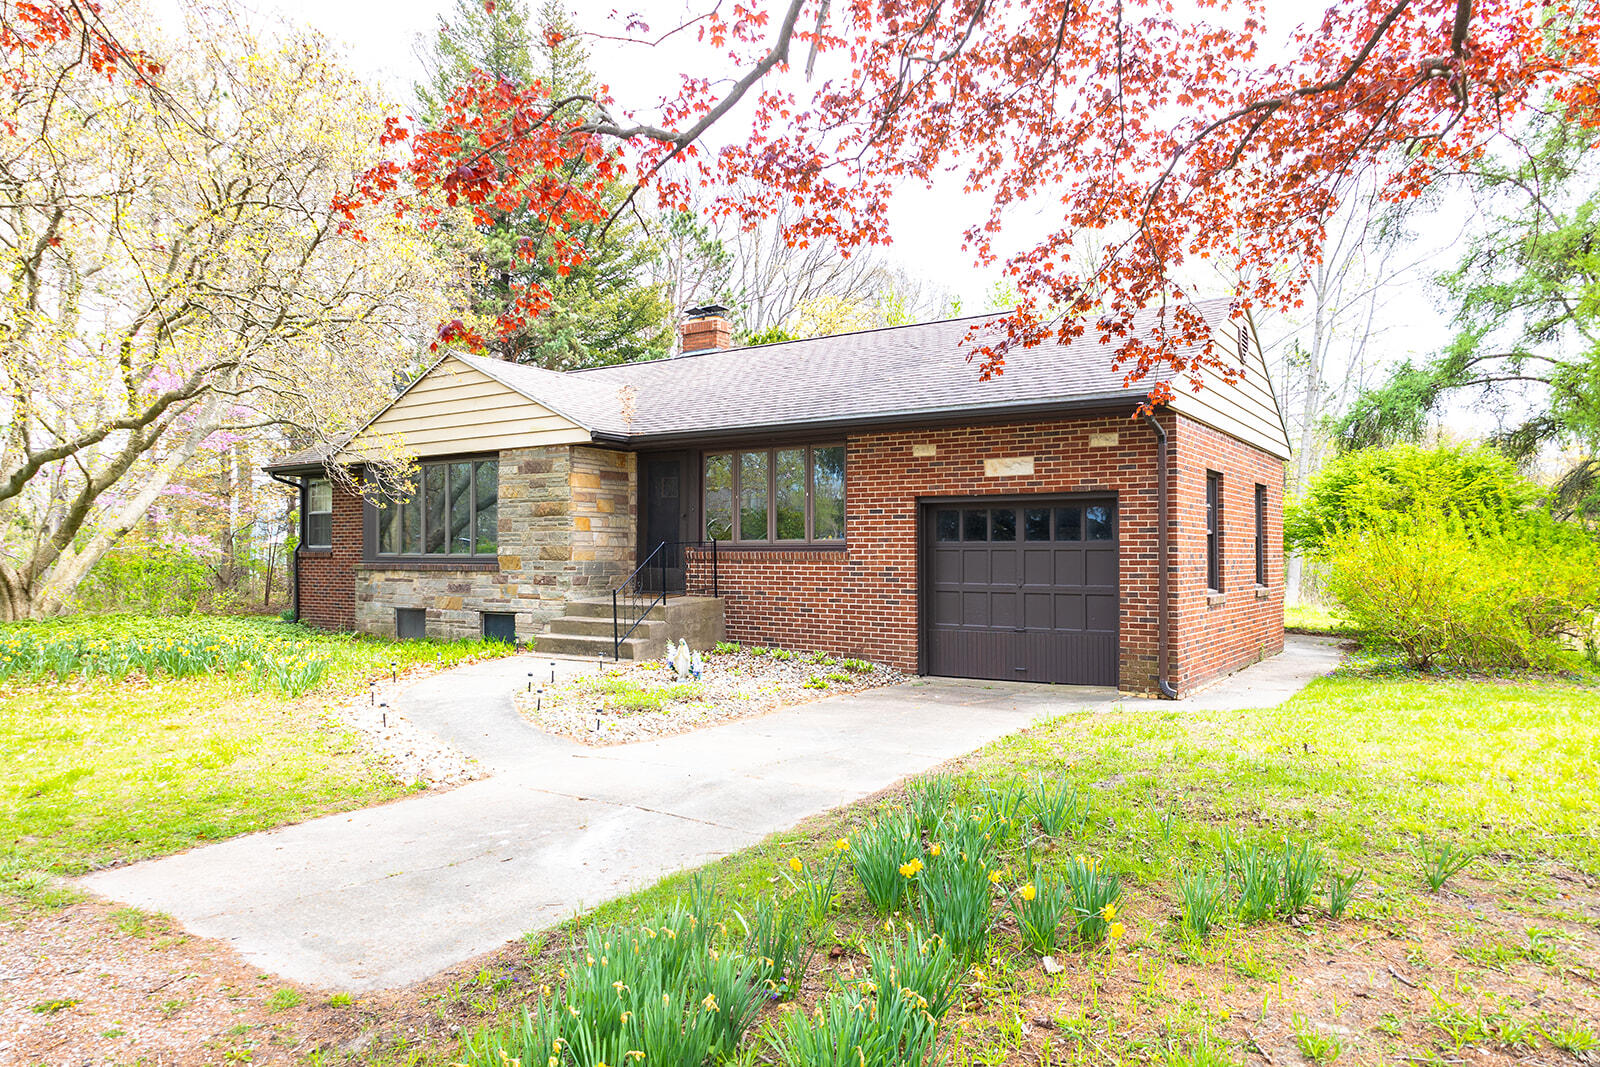
$315,000
3
bds
|
1
ba
|
1,138
sqft
|
built
1922
220 S Berrien St, New Buffalo, MI 49117
$-565
Cash flow
-9.4%
Cash-on-Cash Return
4.1%
Cap rate
0.6%
Rent to Value Ratio

Active
$399,900
2
bds
|
1
ba
|
990
sqft
|
built
1936
18335 Oakland Dr, New Buffalo, MI 49117
$-1,082
Cash flow
-14.1%
Cash-on-Cash Return
3.0%
Cap rate
0.5%
Rent to Value Ratio
41 out of 53 properties for sale in New Buffalo, MI
Limited Results Shown
Create a free account, or log in to reveal all property listings and enjoy the complete experience.

Active
$999,000
4
bds
|
4
ba
|
2,993
sqft
|
built
1993
18418 Dunecrest Dr, New Buffalo, MI 49117
$-4,830
Cash flow
-25.2%
Cash-on-Cash Return
0.5%
Cap rate
0.3%
Rent to Value Ratio

Active
$1,200,000
4
bds
|
3
ba
|
2,349
sqft
|
built
1957
340 N Berrien St, New Buffalo, MI 49117
$-5,429
Cash flow
-23.6%
Cash-on-Cash Return
0.9%
Cap rate
0.2%
Rent to Value Ratio

Active
$789,000
4
bds
|
4
ba
|
4,533
sqft
|
built
2005
224 S Jameson St, New Buffalo, MI 49117
$-1,997
Cash flow
-13.2%
Cash-on-Cash Return
3.2%
Cap rate
0.5%
Rent to Value Ratio
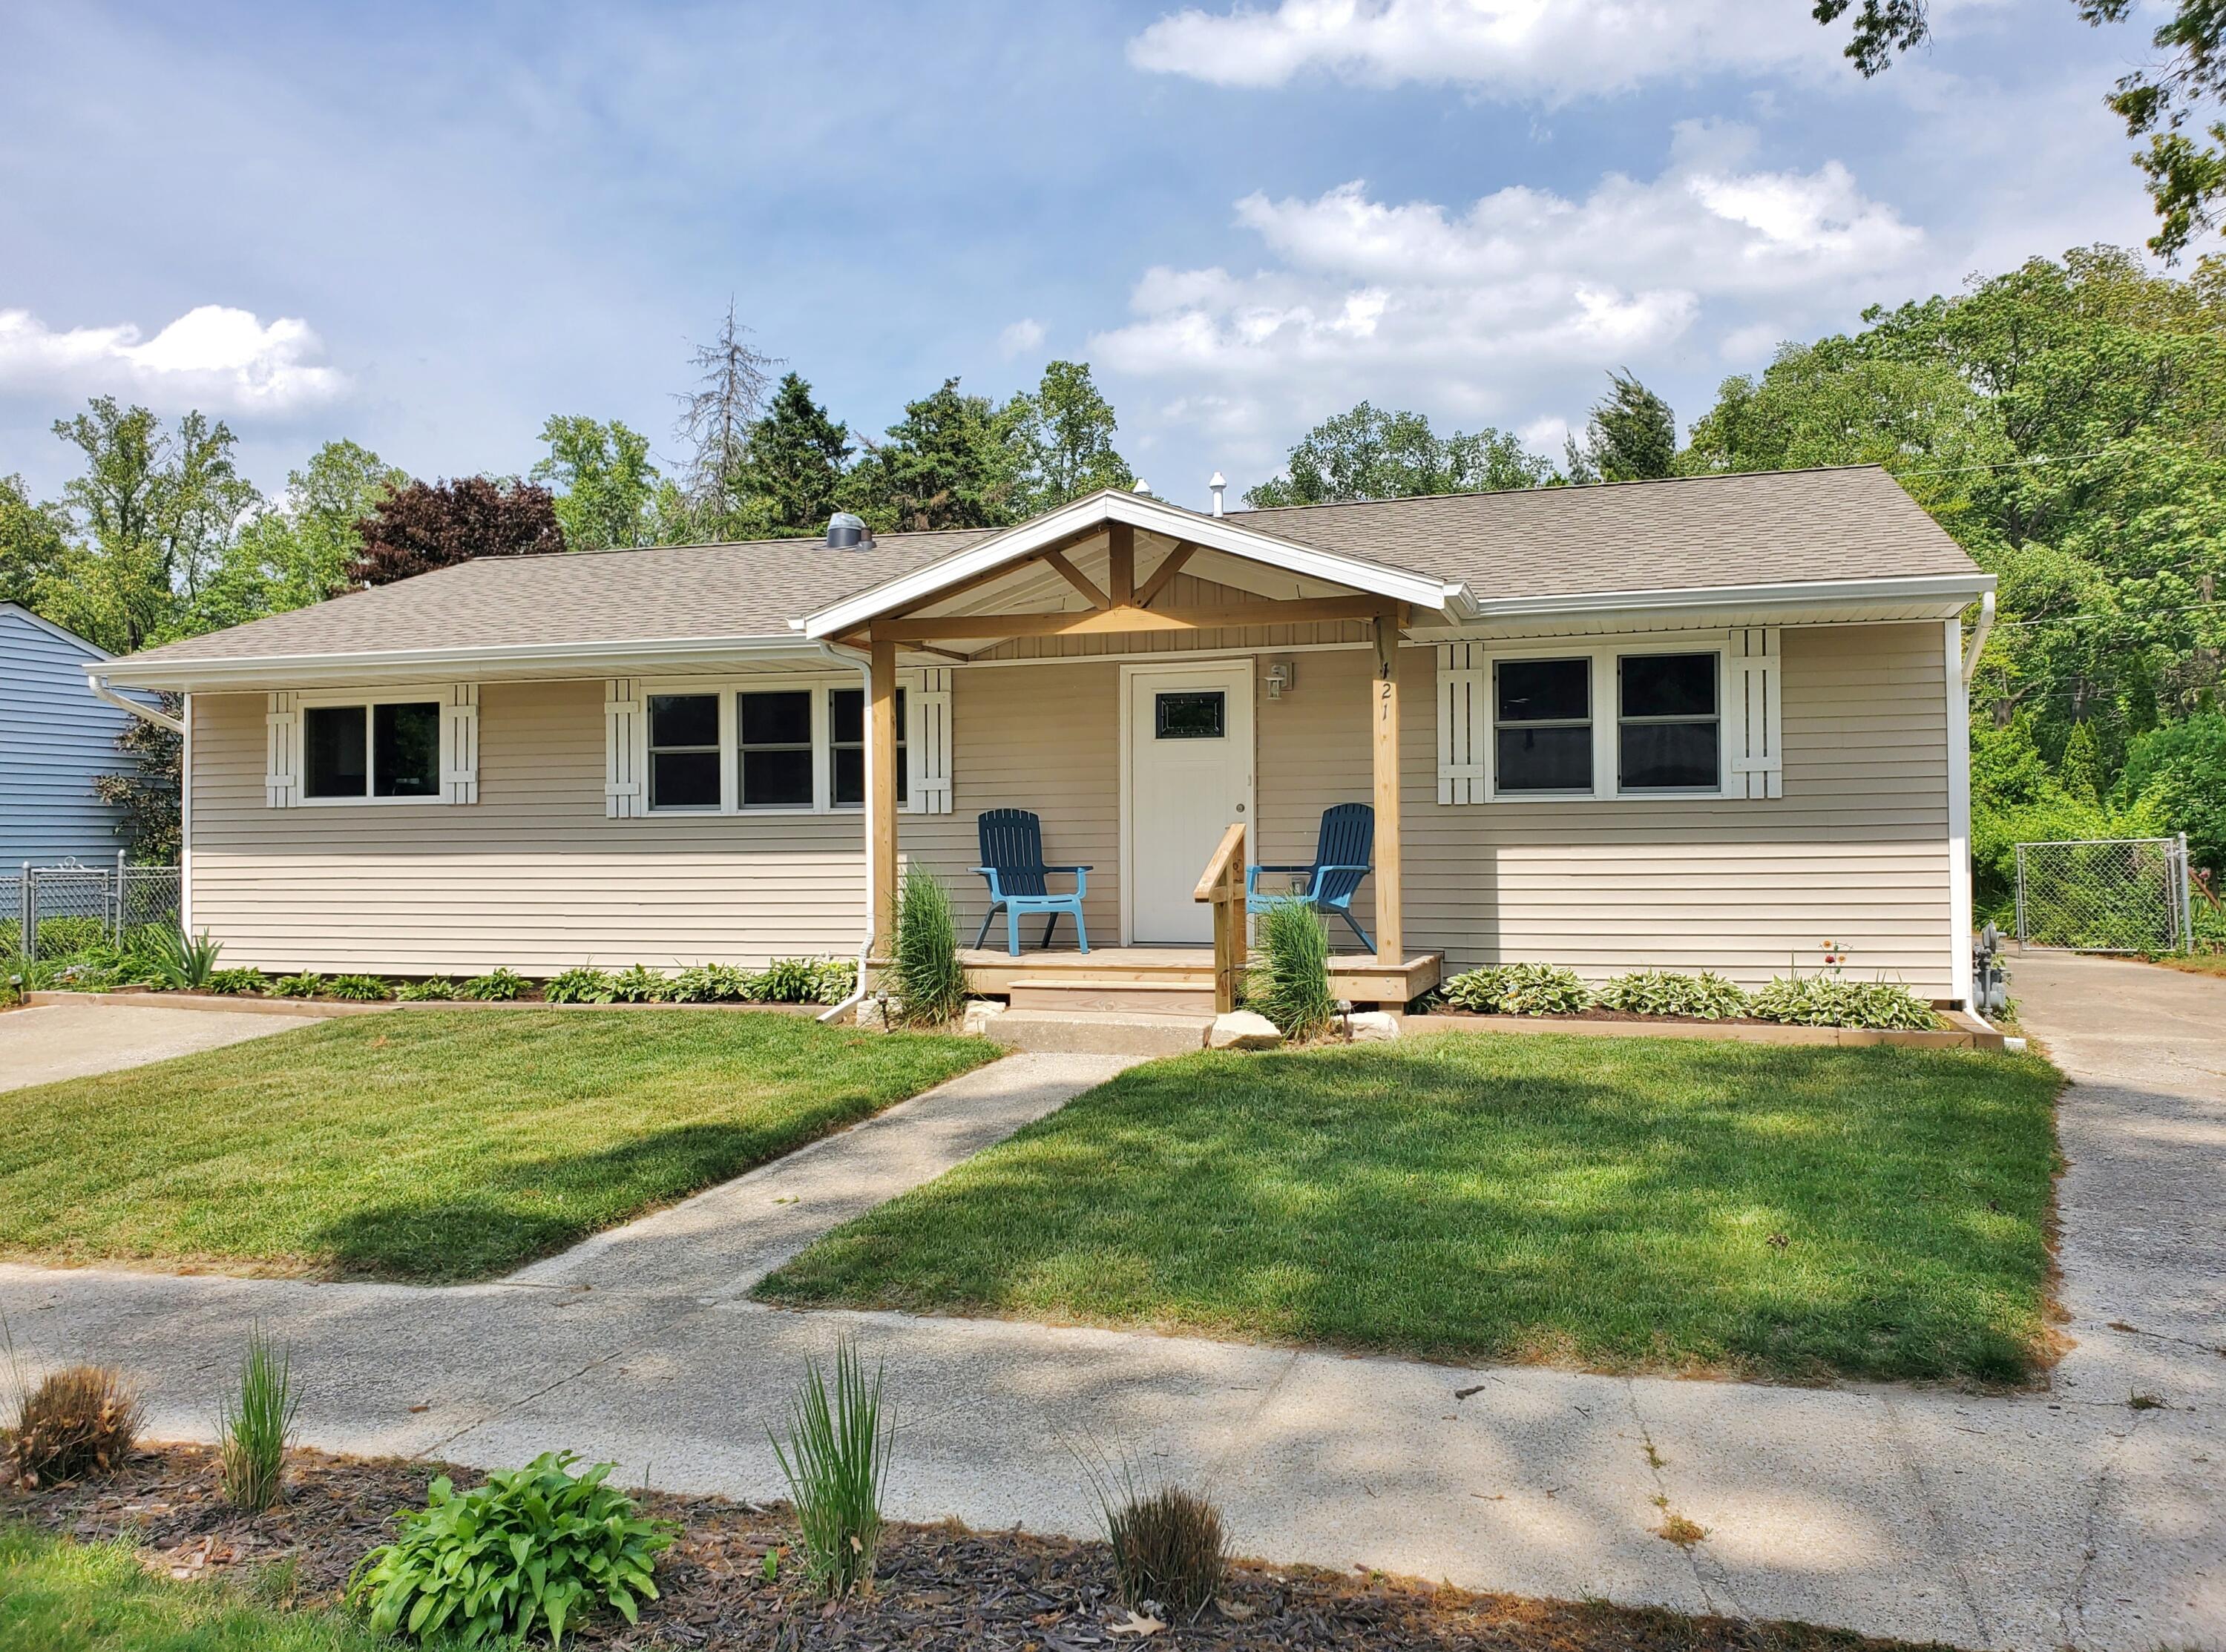
Active
$599,000
3
bds
|
2
ba
|
1,476
sqft
|
built
1964
121 S Marshall St, New Buffalo, MI 49117
$-2,394
Cash flow
-20.9%
Cash-on-Cash Return
1.5%
Cap rate
0.3%
Rent to Value Ratio
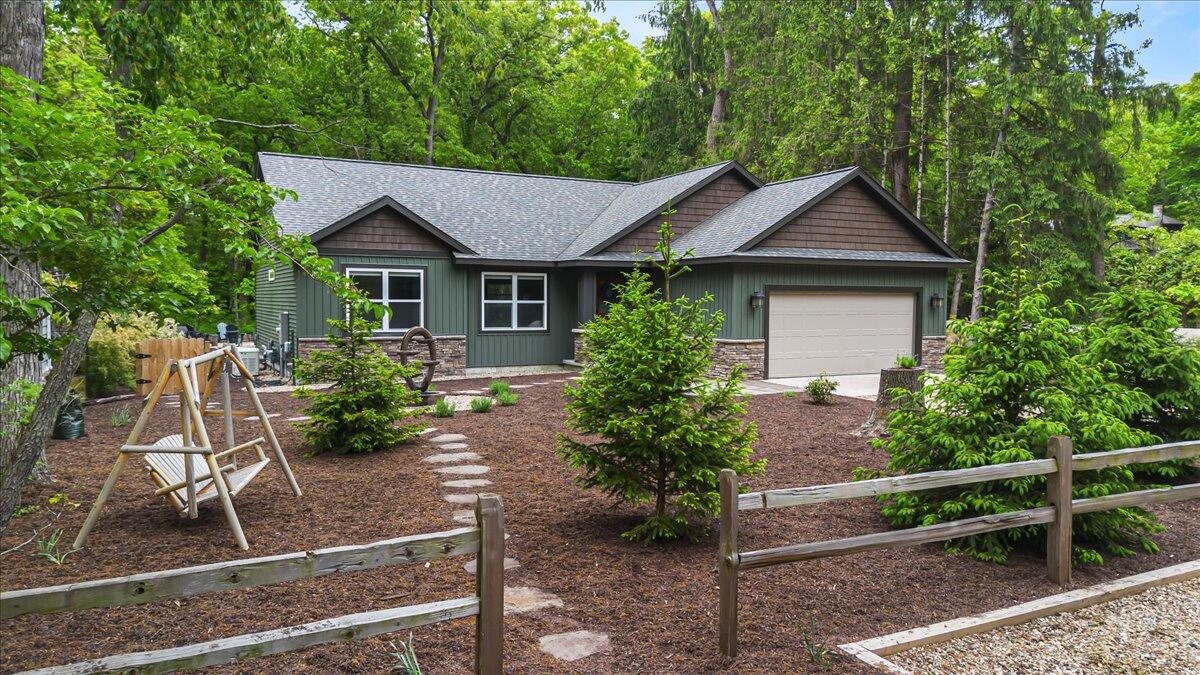
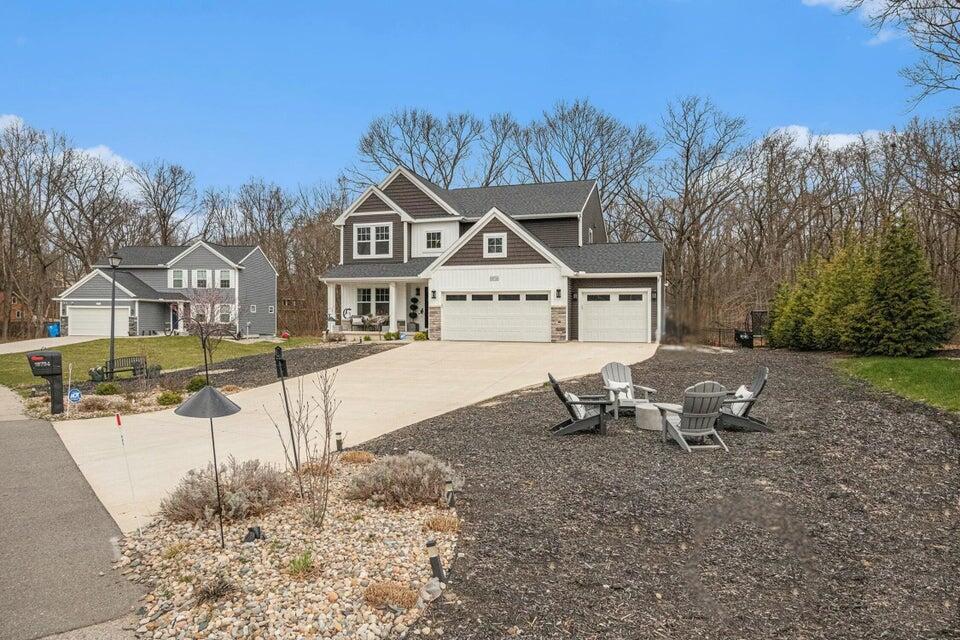
Active
$1,195,000
3
bds
|
3
ba
|
2,788
sqft
|
built
2022
4067 Hillside Trl, New Buffalo, MI 49117
$-5,414
Cash flow
-23.6%
Cash-on-Cash Return
0.8%
Cap rate
0.2%
Rent to Value Ratio

Active
$689,000
3
bds
|
2
ba
|
1,609
sqft
|
built
1915
121 S Barker St, New Buffalo, MI 49117
$-2,144
Cash flow
-16.2%
Cash-on-Cash Return
2.5%
Cap rate
0.4%
Rent to Value Ratio
Active under contract
$315,000
3
bds
|
1
ba
|
1,138
sqft
|
built
1922
220 S Berrien St, New Buffalo, MI 49117
$-565
Cash flow
-9.4%
Cash-on-Cash Return
4.1%
Cap rate
0.6%
Rent to Value Ratio

Active
$635,000
4
bds
|
2
ba
|
1,636
sqft
|
built
1925
22 S Smith St, New Buffalo, MI 49117
$-2,182
Cash flow
-17.9%
Cash-on-Cash Return
2.2%
Cap rate
0.3%
Rent to Value Ratio
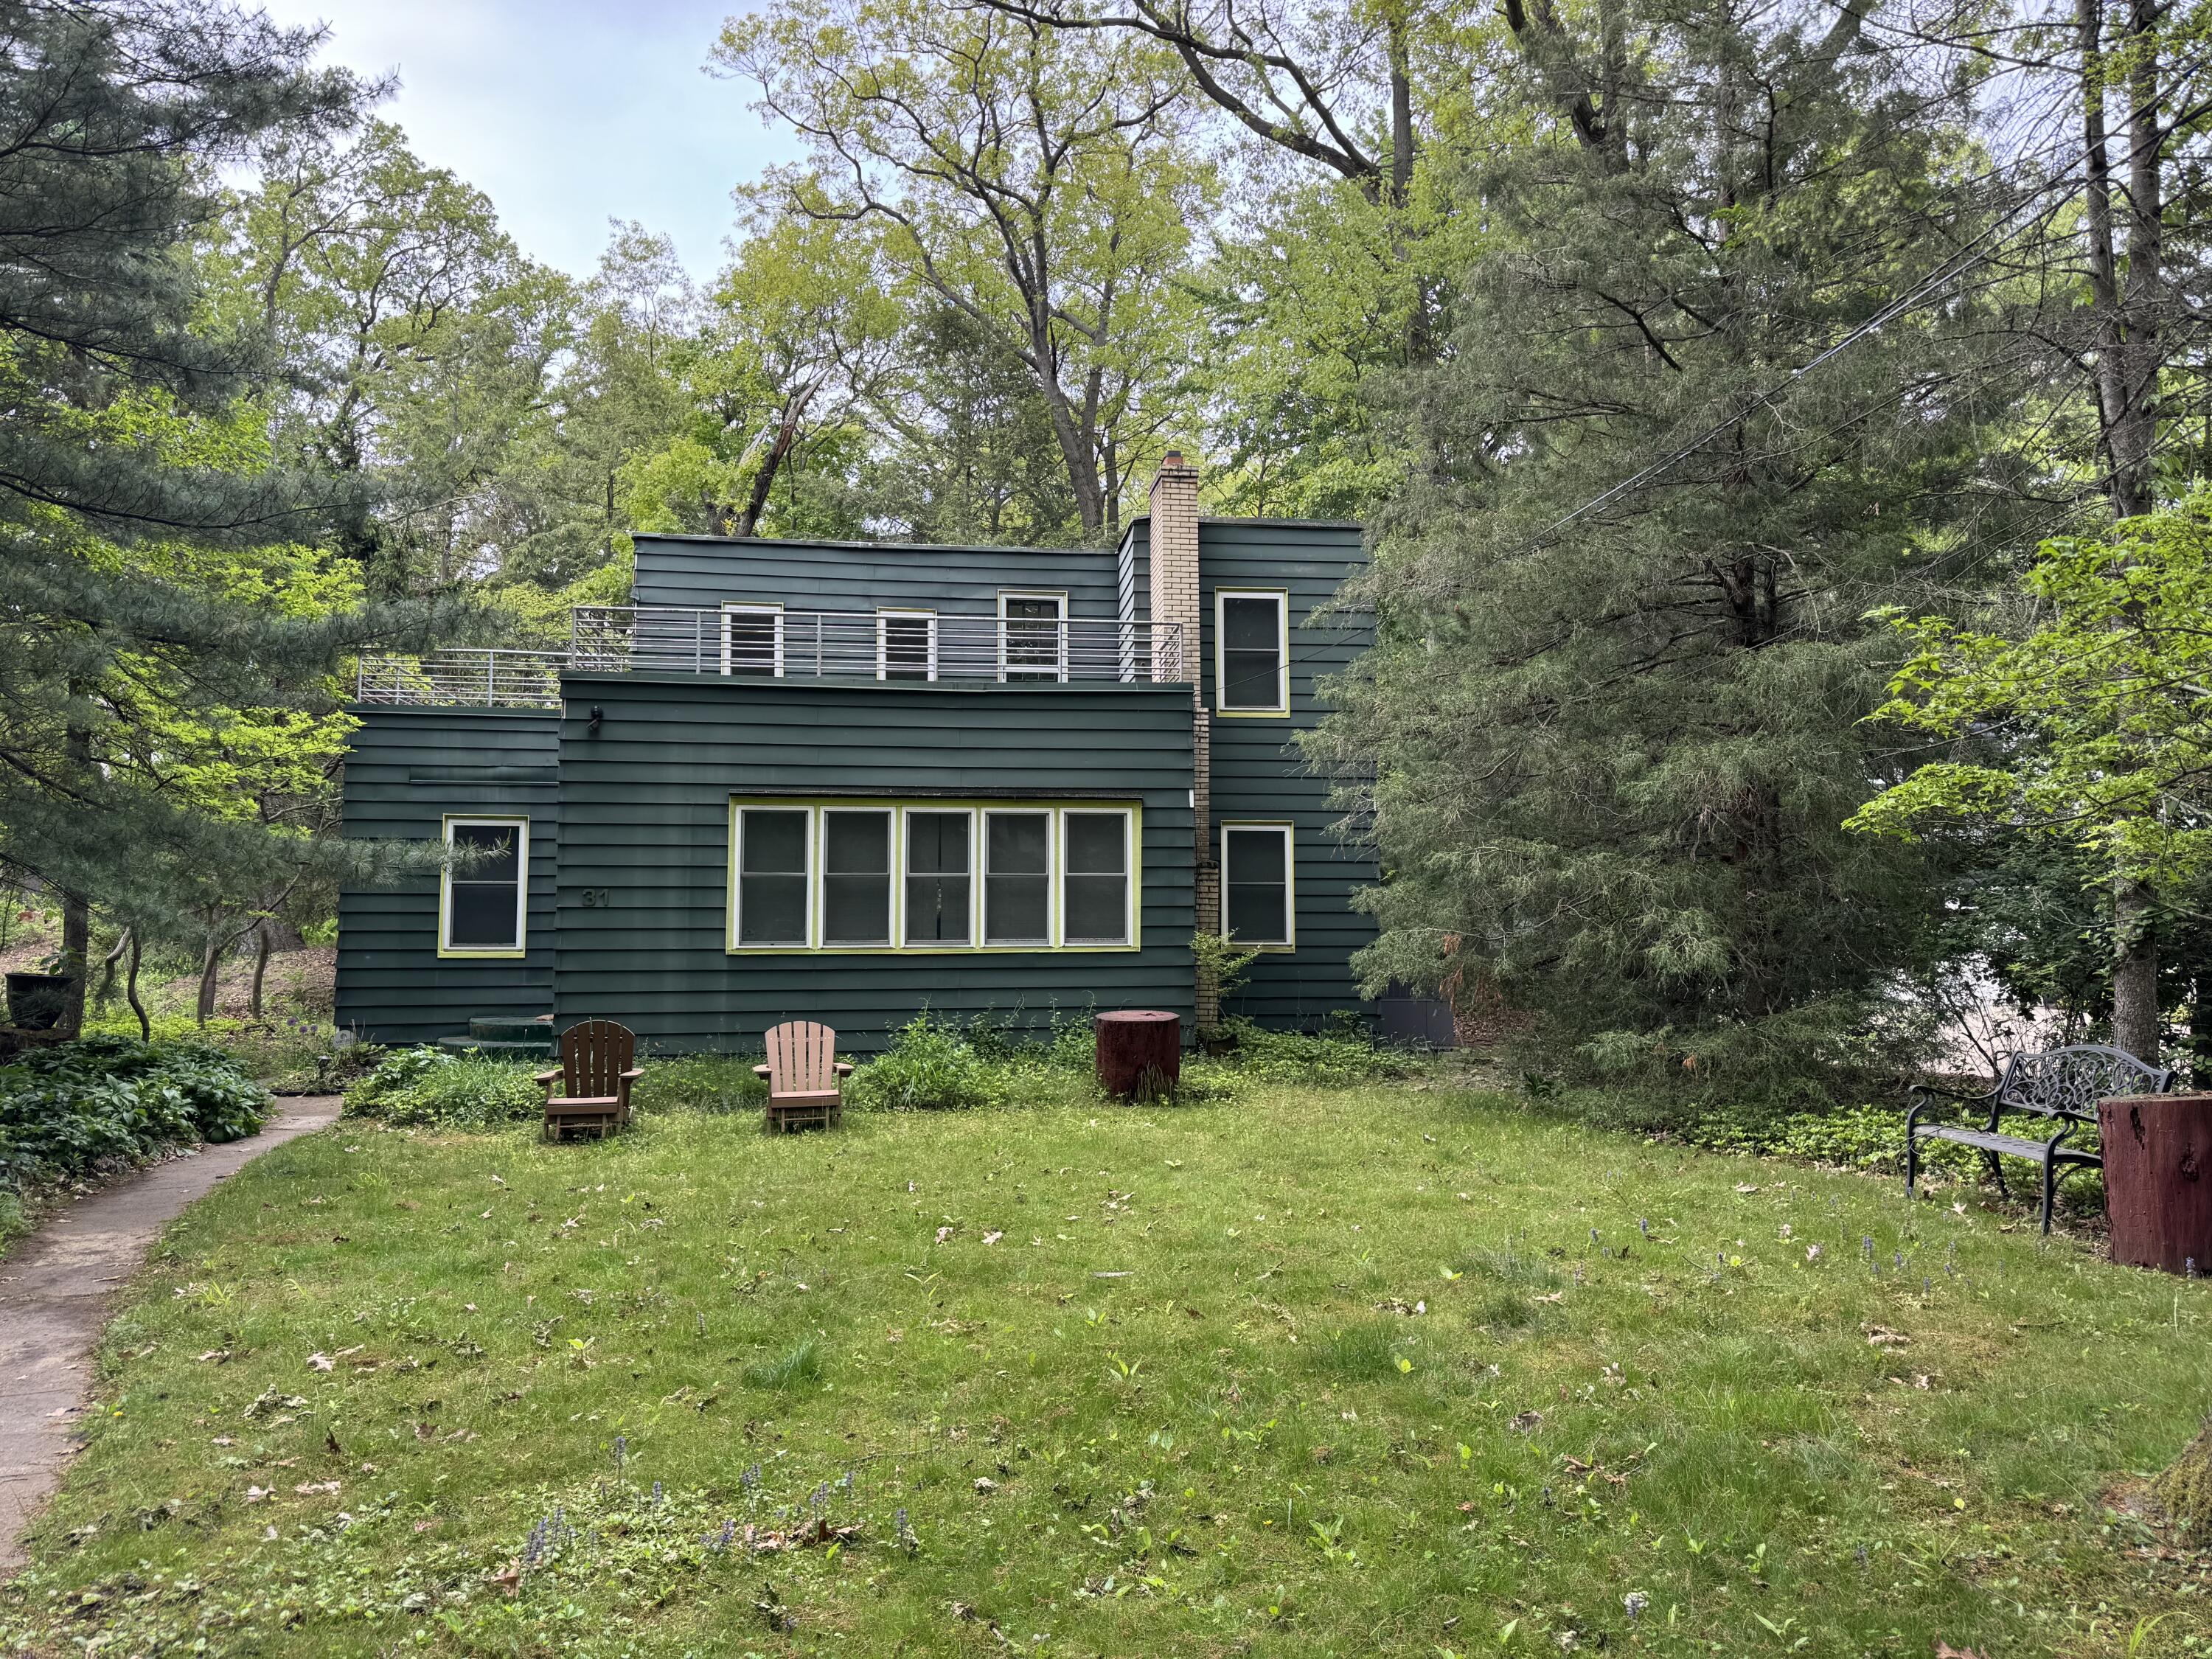
Active
$629,000
3
bds
|
2
ba
|
1,272
sqft
|
built
1938
31 Mohawk Trl, New Buffalo, MI 49117
$-2,301
Cash flow
-19.1%
Cash-on-Cash Return
1.9%
Cap rate
0.3%
Rent to Value Ratio
Active
$399,900
2
bds
|
1
ba
|
990
sqft
|
built
1936
18335 Oakland Dr, New Buffalo, MI 49117
$-1,082
Cash flow
-14.1%
Cash-on-Cash Return
3.0%
Cap rate
0.5%
Rent to Value Ratio
Active
$1,290,000
5
bds
|
3
ba
|
2,339
sqft
|
built
1960
14438 Spring Creek Dr, New Buffalo, MI 49117
$-5,272
Cash flow
-21.3%
Cash-on-Cash Return
1.4%
Cap rate
0.3%
Rent to Value Ratio
Active
$1,025,000
4
bds
|
4
ba
|
3,356
sqft
|
built
2021
18734 Leonard Ct, New Buffalo, MI 49117
$-3,496
Cash flow
-17.8%
Cash-on-Cash Return
2.2%
Cap rate
0.3%
Rent to Value Ratio

Active
$2,250,000
4
bds
|
5
ba
|
3,902
sqft
|
built
2002
210 E Water St, New Buffalo, MI 49117
$-9,754
Cash flow
-22.6%
Cash-on-Cash Return
1.1%
Cap rate
0.2%
Rent to Value Ratio
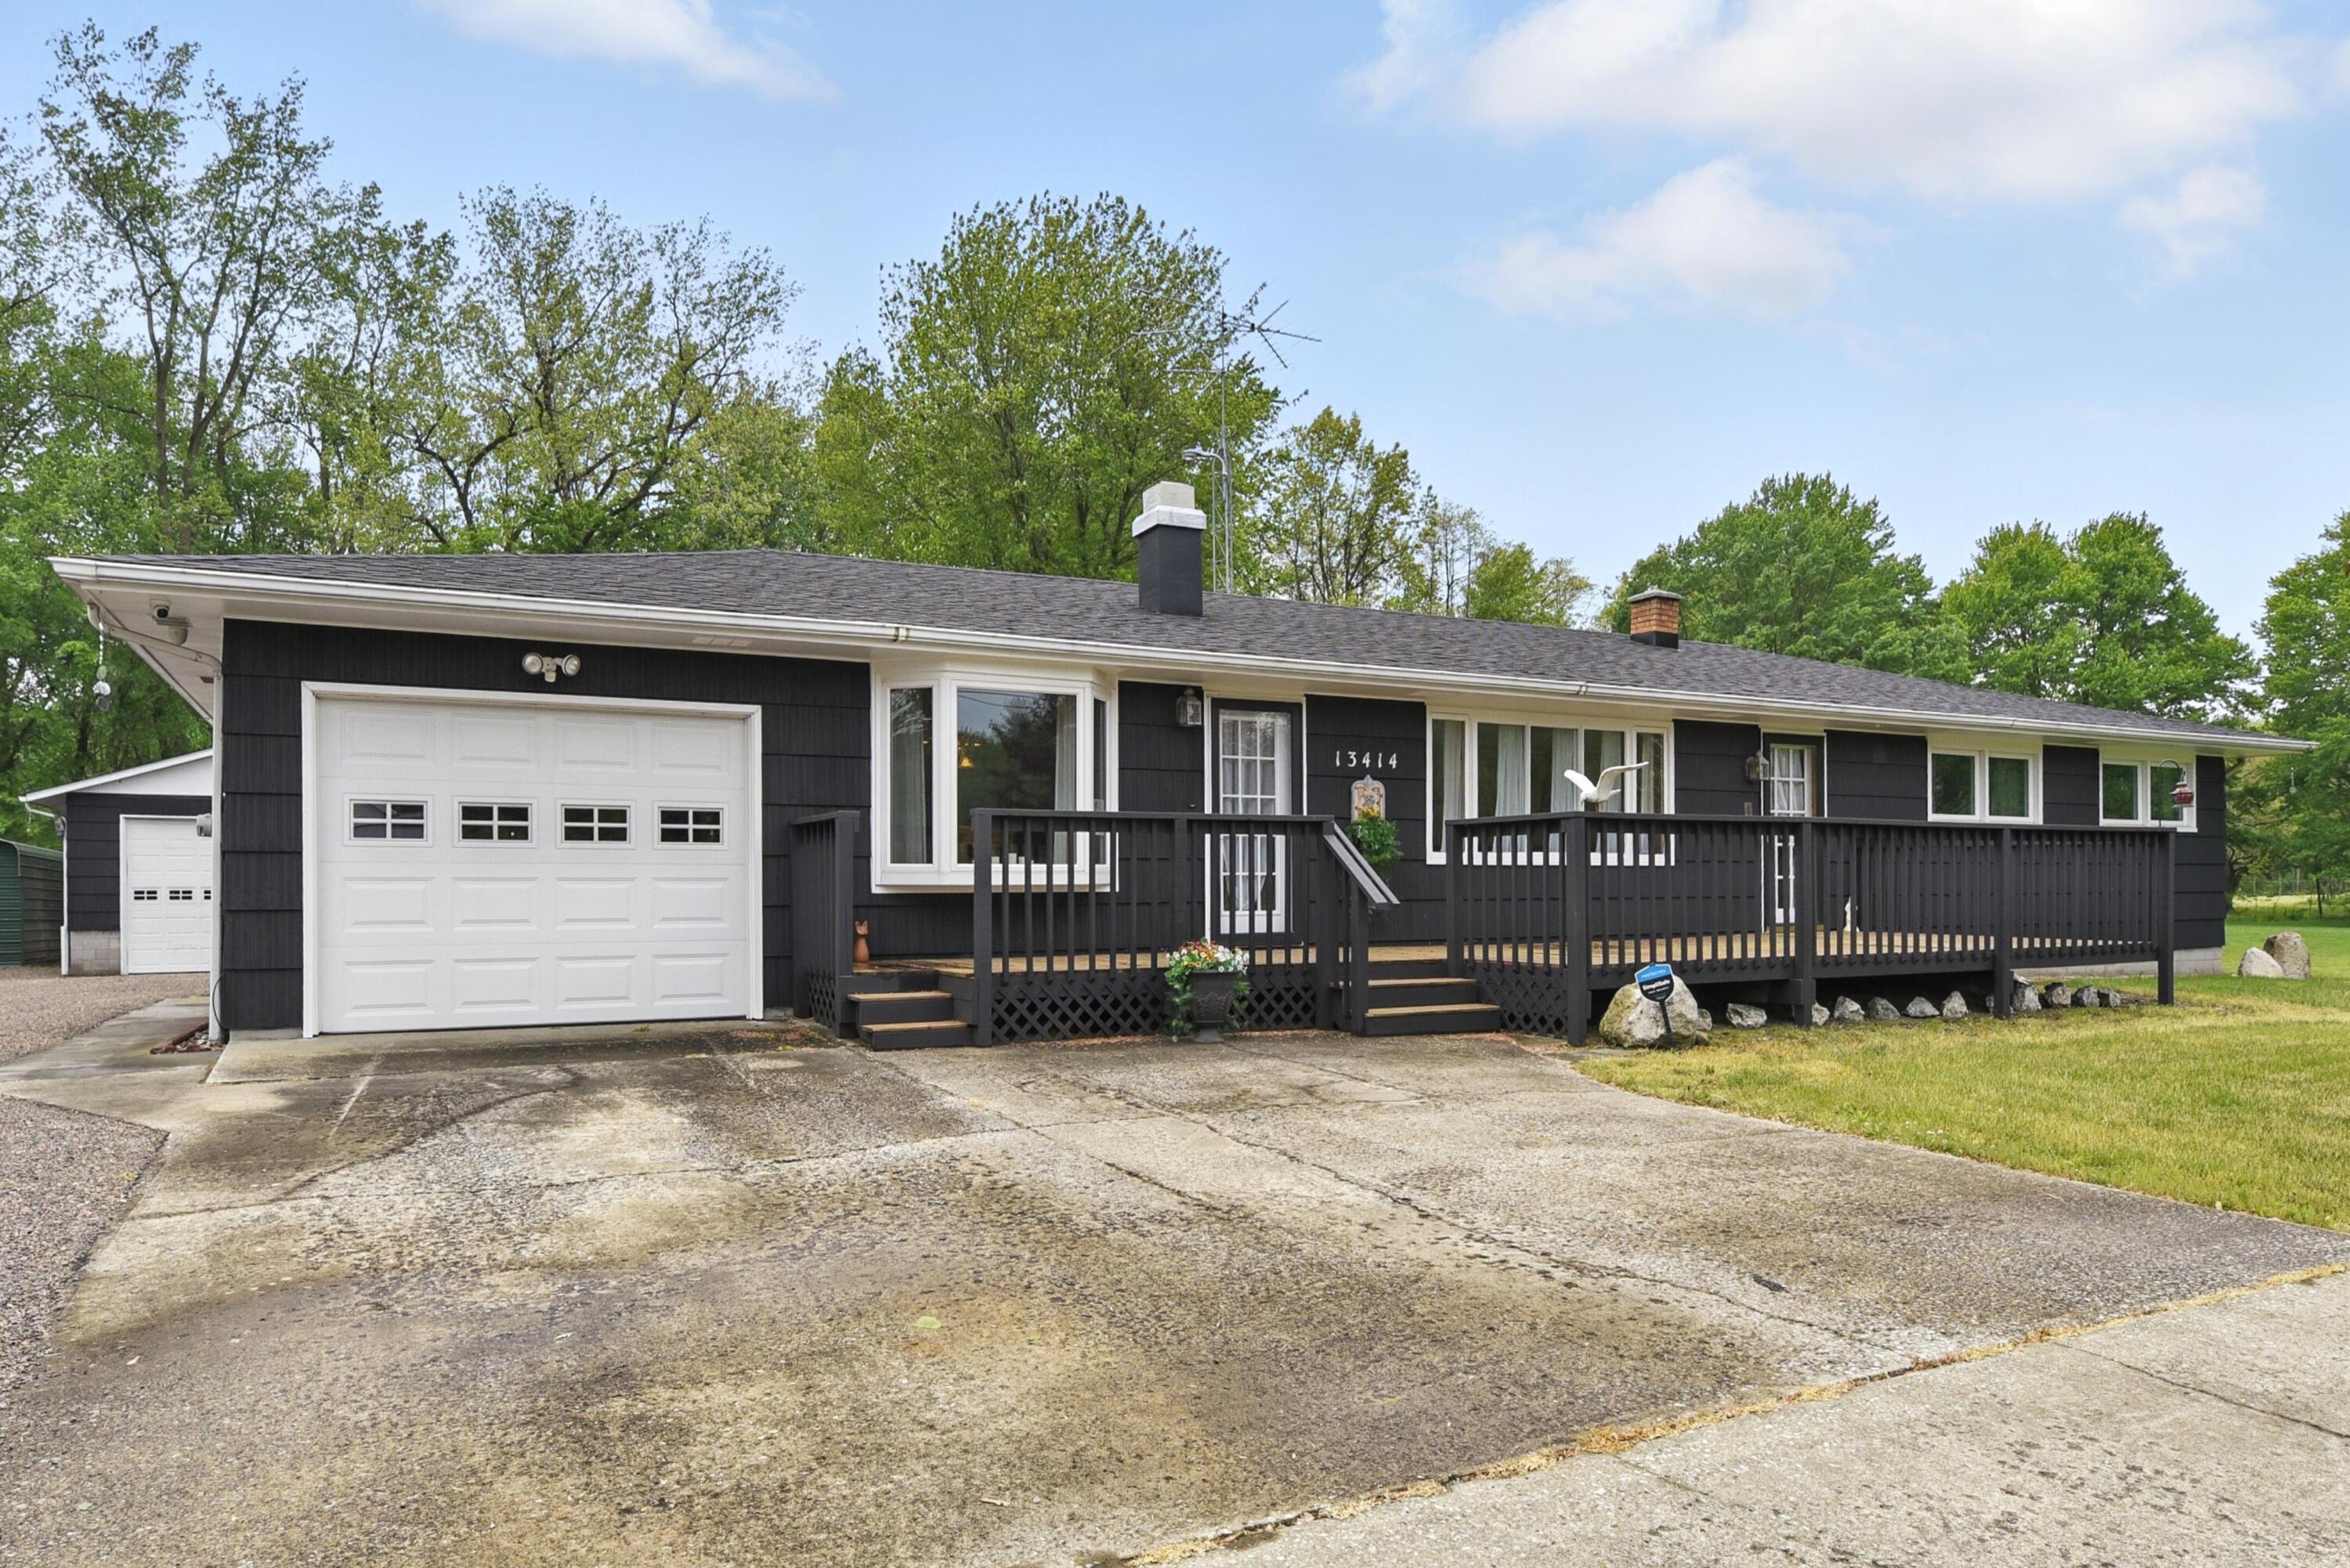
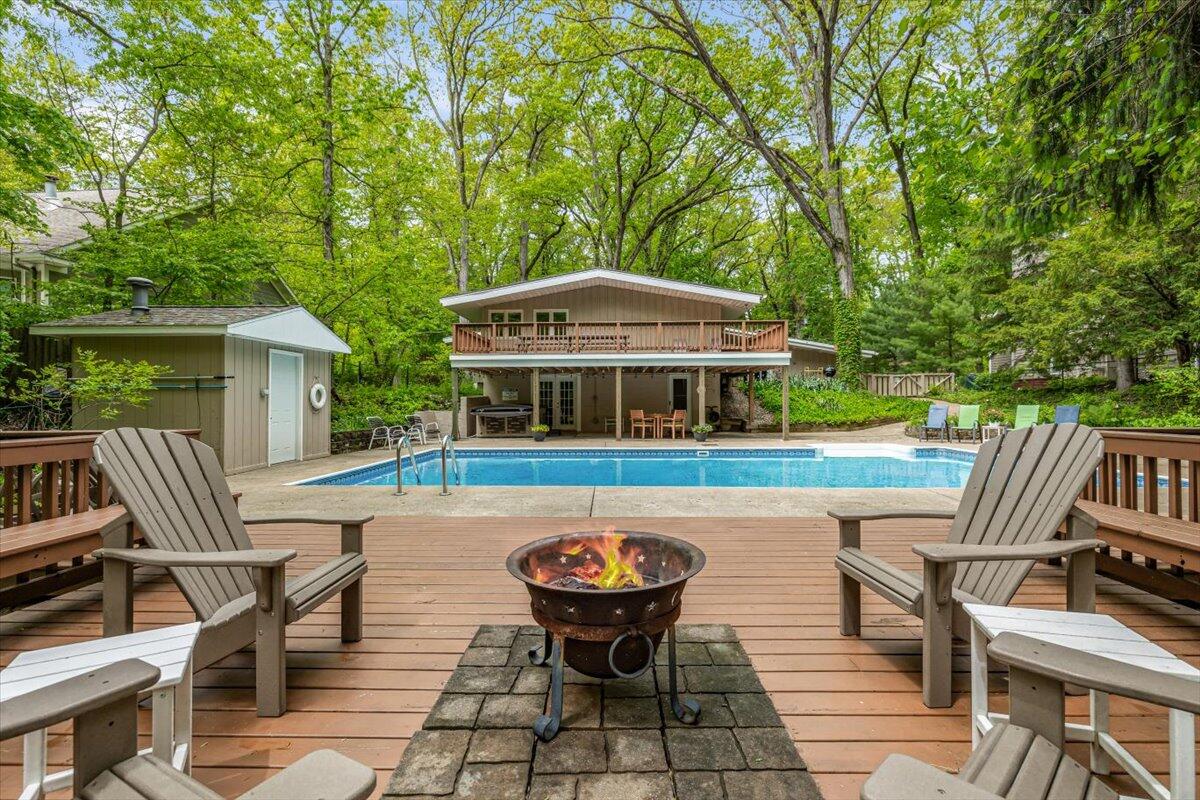
Active
$699,000
3
bds
|
3
ba
|
3,170
sqft
|
built
1960
13414 Wilson Rd, New Buffalo, MI 49117
$-1,771
Cash flow
-13.2%
Cash-on-Cash Return
3.2%
Cap rate
0.4%
Rent to Value Ratio
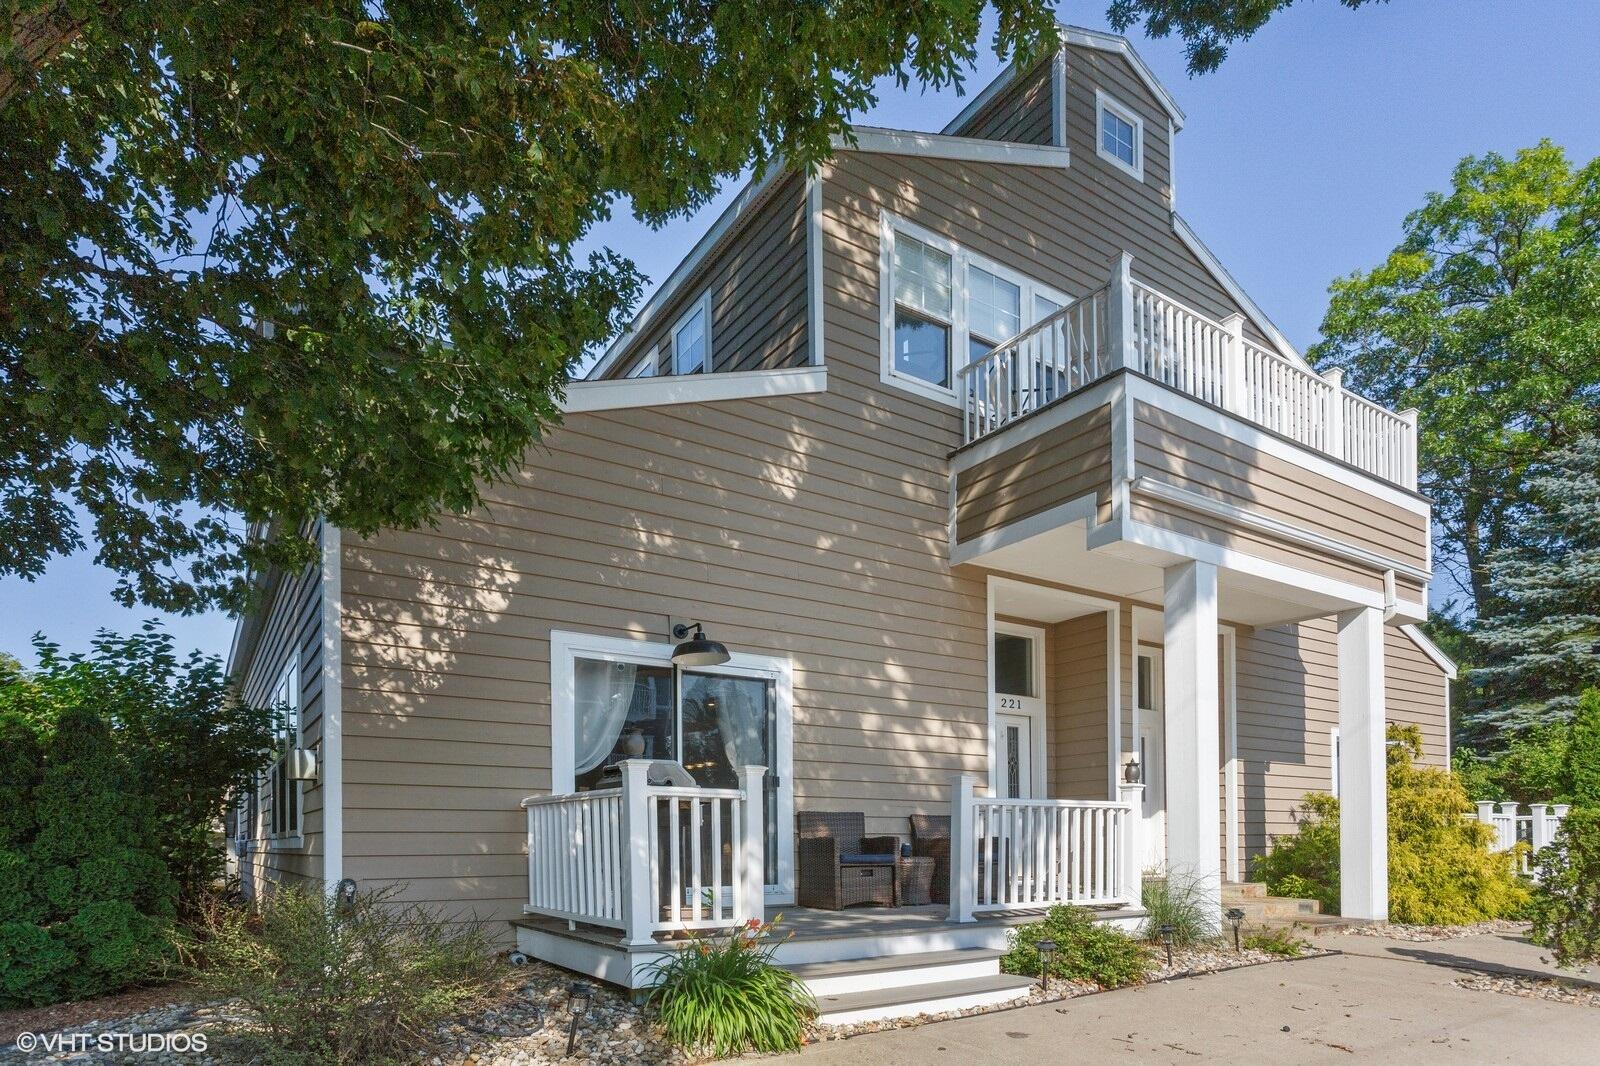
Active
$549,000
2
bds
|
2
ba
|
1,159
sqft
|
built
2007
221 N Townsend St, New Buffalo, MI 49117
$-2,068
Cash flow
-19.7%
Cash-on-Cash Return
1.8%
Cap rate
0.5%
Rent to Value Ratio
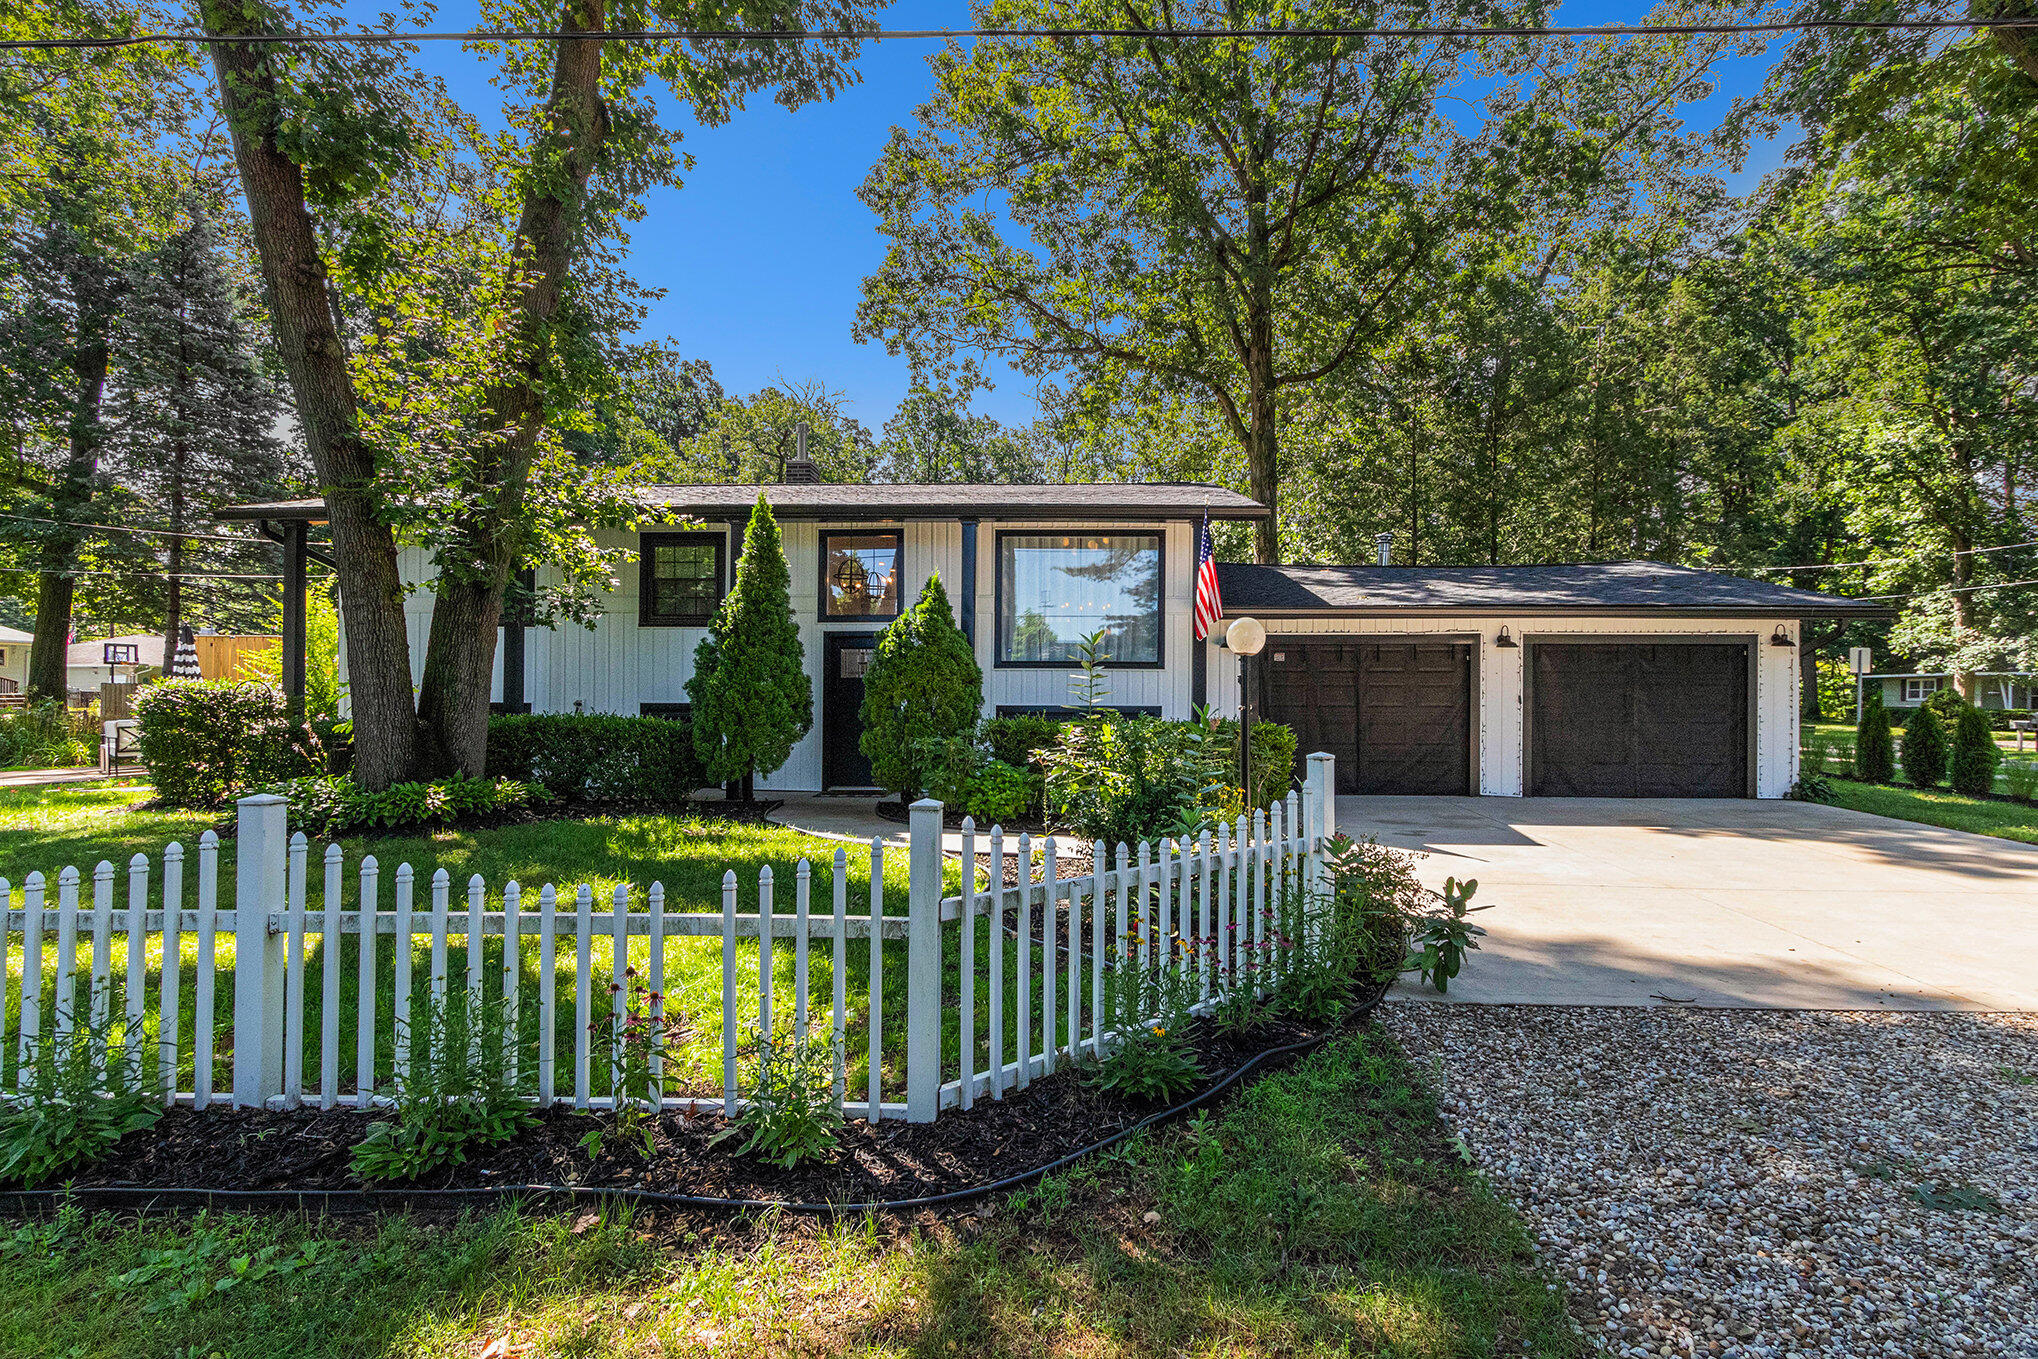
Active
$695,000
4
bds
|
2
ba
|
1,904
sqft
|
built
1963
819 W Michigan St, New Buffalo, MI 49117
$-1,776
Cash flow
-13.3%
Cash-on-Cash Return
3.2%
Cap rate
0.5%
Rent to Value Ratio

Active
$799,900
4
bds
|
3
ba
|
2,550
sqft
|
built
2022
508 S Jameson St, New Buffalo, MI 49117
$-1,817
Cash flow
-11.9%
Cash-on-Cash Return
3.6%
Cap rate
0.5%
Rent to Value Ratio
Active
$1,099,000
2
bds
|
2
ba
|
1,164
sqft
|
built
1987
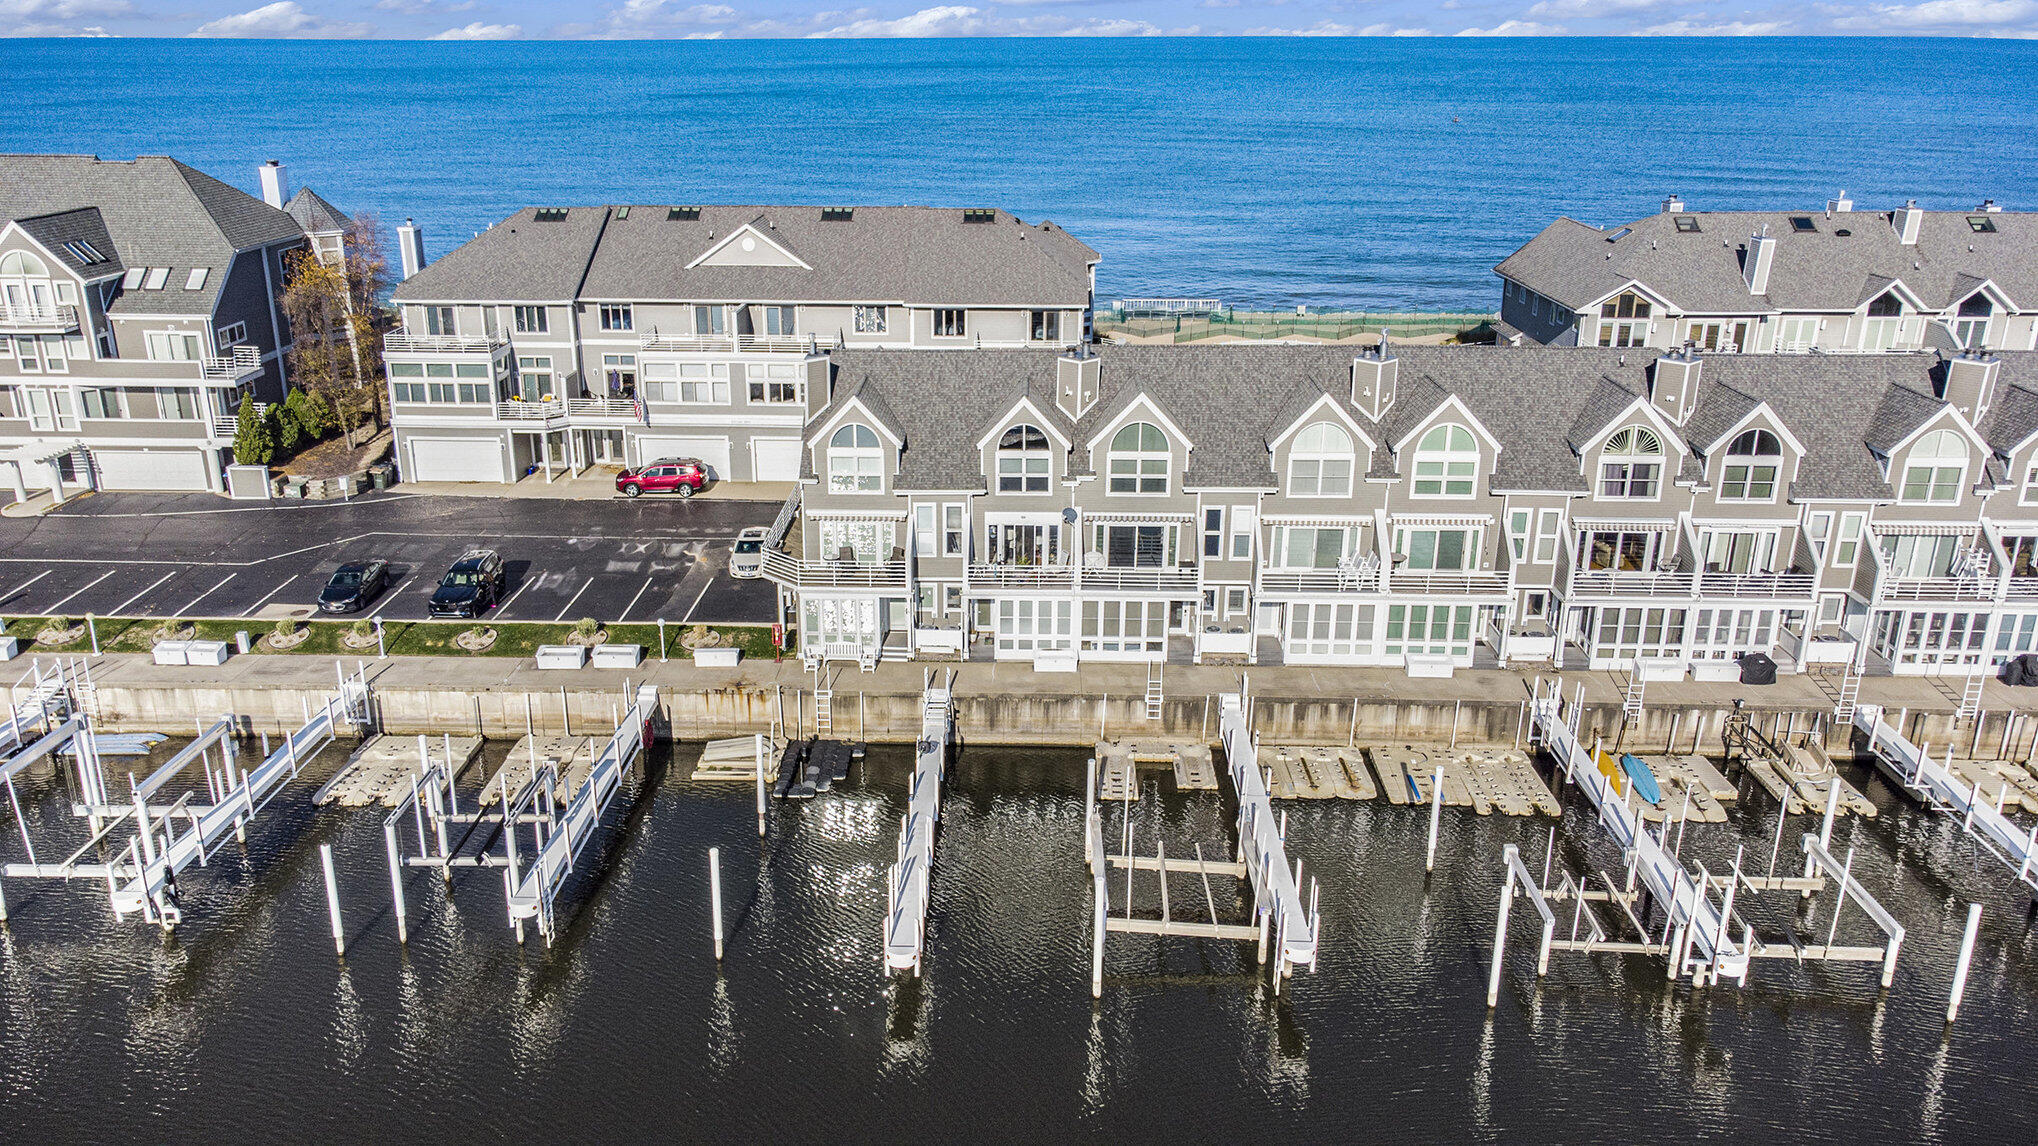
409 Lake Dr, New Buffalo, MI 49117
$-4,597
Cash flow
-21.8%
Cash-on-Cash Return
1.3%
Cap rate
0.3%
Rent to Value Ratio

Active
$624,000
3
bds
|
2
ba
|
2,835
sqft
|
built
2014
1117 Bell Ave, New Buffalo, MI 49117
$-2,016
Cash flow
-16.9%
Cash-on-Cash Return
2.4%
Cap rate
0.4%
Rent to Value Ratio
Active
$1,675,000
9
bds
|
7
ba
|
6,709
sqft
|
built
1983
50102 Alpine Blvd, New Buffalo, MI 49117
$-8,863
Cash flow
-27.6%
Cash-on-Cash Return
-0.1%
Cap rate
0.2%
Rent to Value Ratio
Active
$682,500
3
bds
|
2
ba
|
1,350
sqft
|
built
1950
1359 Bell Ave, New Buffalo, MI 49117
$-2,649
Cash flow
-20.3%
Cash-on-Cash Return
1.6%
Cap rate
0.4%
Rent to Value Ratio

Active
$589,000
4
bds
|
3
ba
|
2,200
sqft
|
built
1964
1111 Shore Dr, New Buffalo, MI 49117
$-2,031
Cash flow
-18.0%
Cash-on-Cash Return
2.1%
Cap rate
0.5%
Rent to Value Ratio
Active
$599,000
2
bds
|
2
ba
|
1,582
sqft
|
built
2004
18743 Oldfield Rd, New Buffalo, MI 49117
$-2,624
Cash flow
-22.9%
Cash-on-Cash Return
1.0%
Cap rate
0.3%
Rent to Value Ratio
Active
$749,000
3
bds
|
3
ba
|
1,914
sqft
|
built
1989
310 Oselka Dr, New Buffalo, MI 49117
$-3,408
Cash flow
-23.7%
Cash-on-Cash Return
0.8%
Cap rate
0.4%
Rent to Value Ratio
Active
$929,000
4
bds
|
4
ba
|
5,032
sqft
|
built
1968
1321 Shore Dr, New Buffalo, MI 49117
$-2,465
Cash flow
-13.8%
Cash-on-Cash Return
3.1%
Cap rate
0.4%
Rent to Value Ratio
Active
$590,000
bds
|
0
ba
|
0
sqft
|
built
1960
121 E Michigan St, New Buffalo, MI 49117
$-1,569
Cash flow
-13.9%
Cash-on-Cash Return
3.1%
Cap rate
0.5%
Rent to Value Ratio

Active
$2,850,000
6
bds
|
5
ba
|
3,835
sqft
|
built
2005
47007 Lake View Ave, New Buffalo, MI 49117
$-14,271
Cash flow
-26.1%
Cash-on-Cash Return
0.3%
Cap rate
0.1%
Rent to Value Ratio
Active
$990,000
5
bds
|
4
ba
|
2,826
sqft
|
built
2021
32 Walden Way, New Buffalo, MI 49117
$-3,733
Cash flow
-19.7%
Cash-on-Cash Return
1.8%
Cap rate
0.4%
Rent to Value Ratio

Active
$869,000
5
bds
|
4
ba
|
3,024
sqft
|
built
2020
109 N Harrison St, New Buffalo, MI 49117
$-2,931
Cash flow
-17.6%
Cash-on-Cash Return
2.2%
Cap rate
0.5%
Rent to Value Ratio
Active
$1,199,000
4
bds
|
3
ba
|
3,084
sqft
|
built
1930
312 S Whittaker St, New Buffalo, MI 49117
$-4,616
Cash flow
-20.1%
Cash-on-Cash Return
1.7%
Cap rate
0.2%
Rent to Value Ratio
Active
$899,000
4
bds
|
3
ba
|
2,504
sqft
|
built
1971
1116 Shore Dr, New Buffalo, MI 49117
$-2,403
Cash flow
-13.9%
Cash-on-Cash Return
3.1%
Cap rate
0.5%
Rent to Value Ratio

Active
$1,400,000
4
bds
|
3
ba
|
1,738
sqft
|
built
1984
10172 US Highway 12, New Buffalo, MI 49117
$-3,999
Cash flow
-14.9%
Cash-on-Cash Return
2.9%
Cap rate
0.4%
Rent to Value Ratio
Active
$4,250,000
4
bds
|
3
ba
|
1,999
sqft
|
built
1989
300 Marquette Dr, New Buffalo, MI 49117
$-19,058
Cash flow
-23.4%
Cash-on-Cash Return
0.9%
Cap rate
0.1%
Rent to Value Ratio

Active
$675,000
bds
|
0
ba
|
0
sqft
|
built
1954
314 N Berrien St, New Buffalo, MI 49117
$-2,182
Cash flow
-16.9%
Cash-on-Cash Return
2.4%
Cap rate
0.4%
Rent to Value Ratio

Active
$899,000
4
bds
|
3
ba
|
2,448
sqft
|
built
1994
19694 Dogwood Dr, New Buffalo, MI 49117
$-2,560
Cash flow
-14.9%
Cash-on-Cash Return
2.9%
Cap rate
0.5%
Rent to Value Ratio
Active
$1,699,000
4
bds
|
3
ba
|
2,158
sqft
|
built
1947
19300 Highland Dr, New Buffalo, MI 49117
$-6,070
Cash flow
-18.6%
Cash-on-Cash Return
2.0%
Cap rate
0.3%
Rent to Value Ratio

Active
$449,000
1
bds
|
1
ba
|
696
sqft
|
built
1983
420 Oselka Dr, New Buffalo, MI 49117
$-1,630
Cash flow
-18.9%
Cash-on-Cash Return
1.9%
Cap rate
0.4%
Rent to Value Ratio
Active
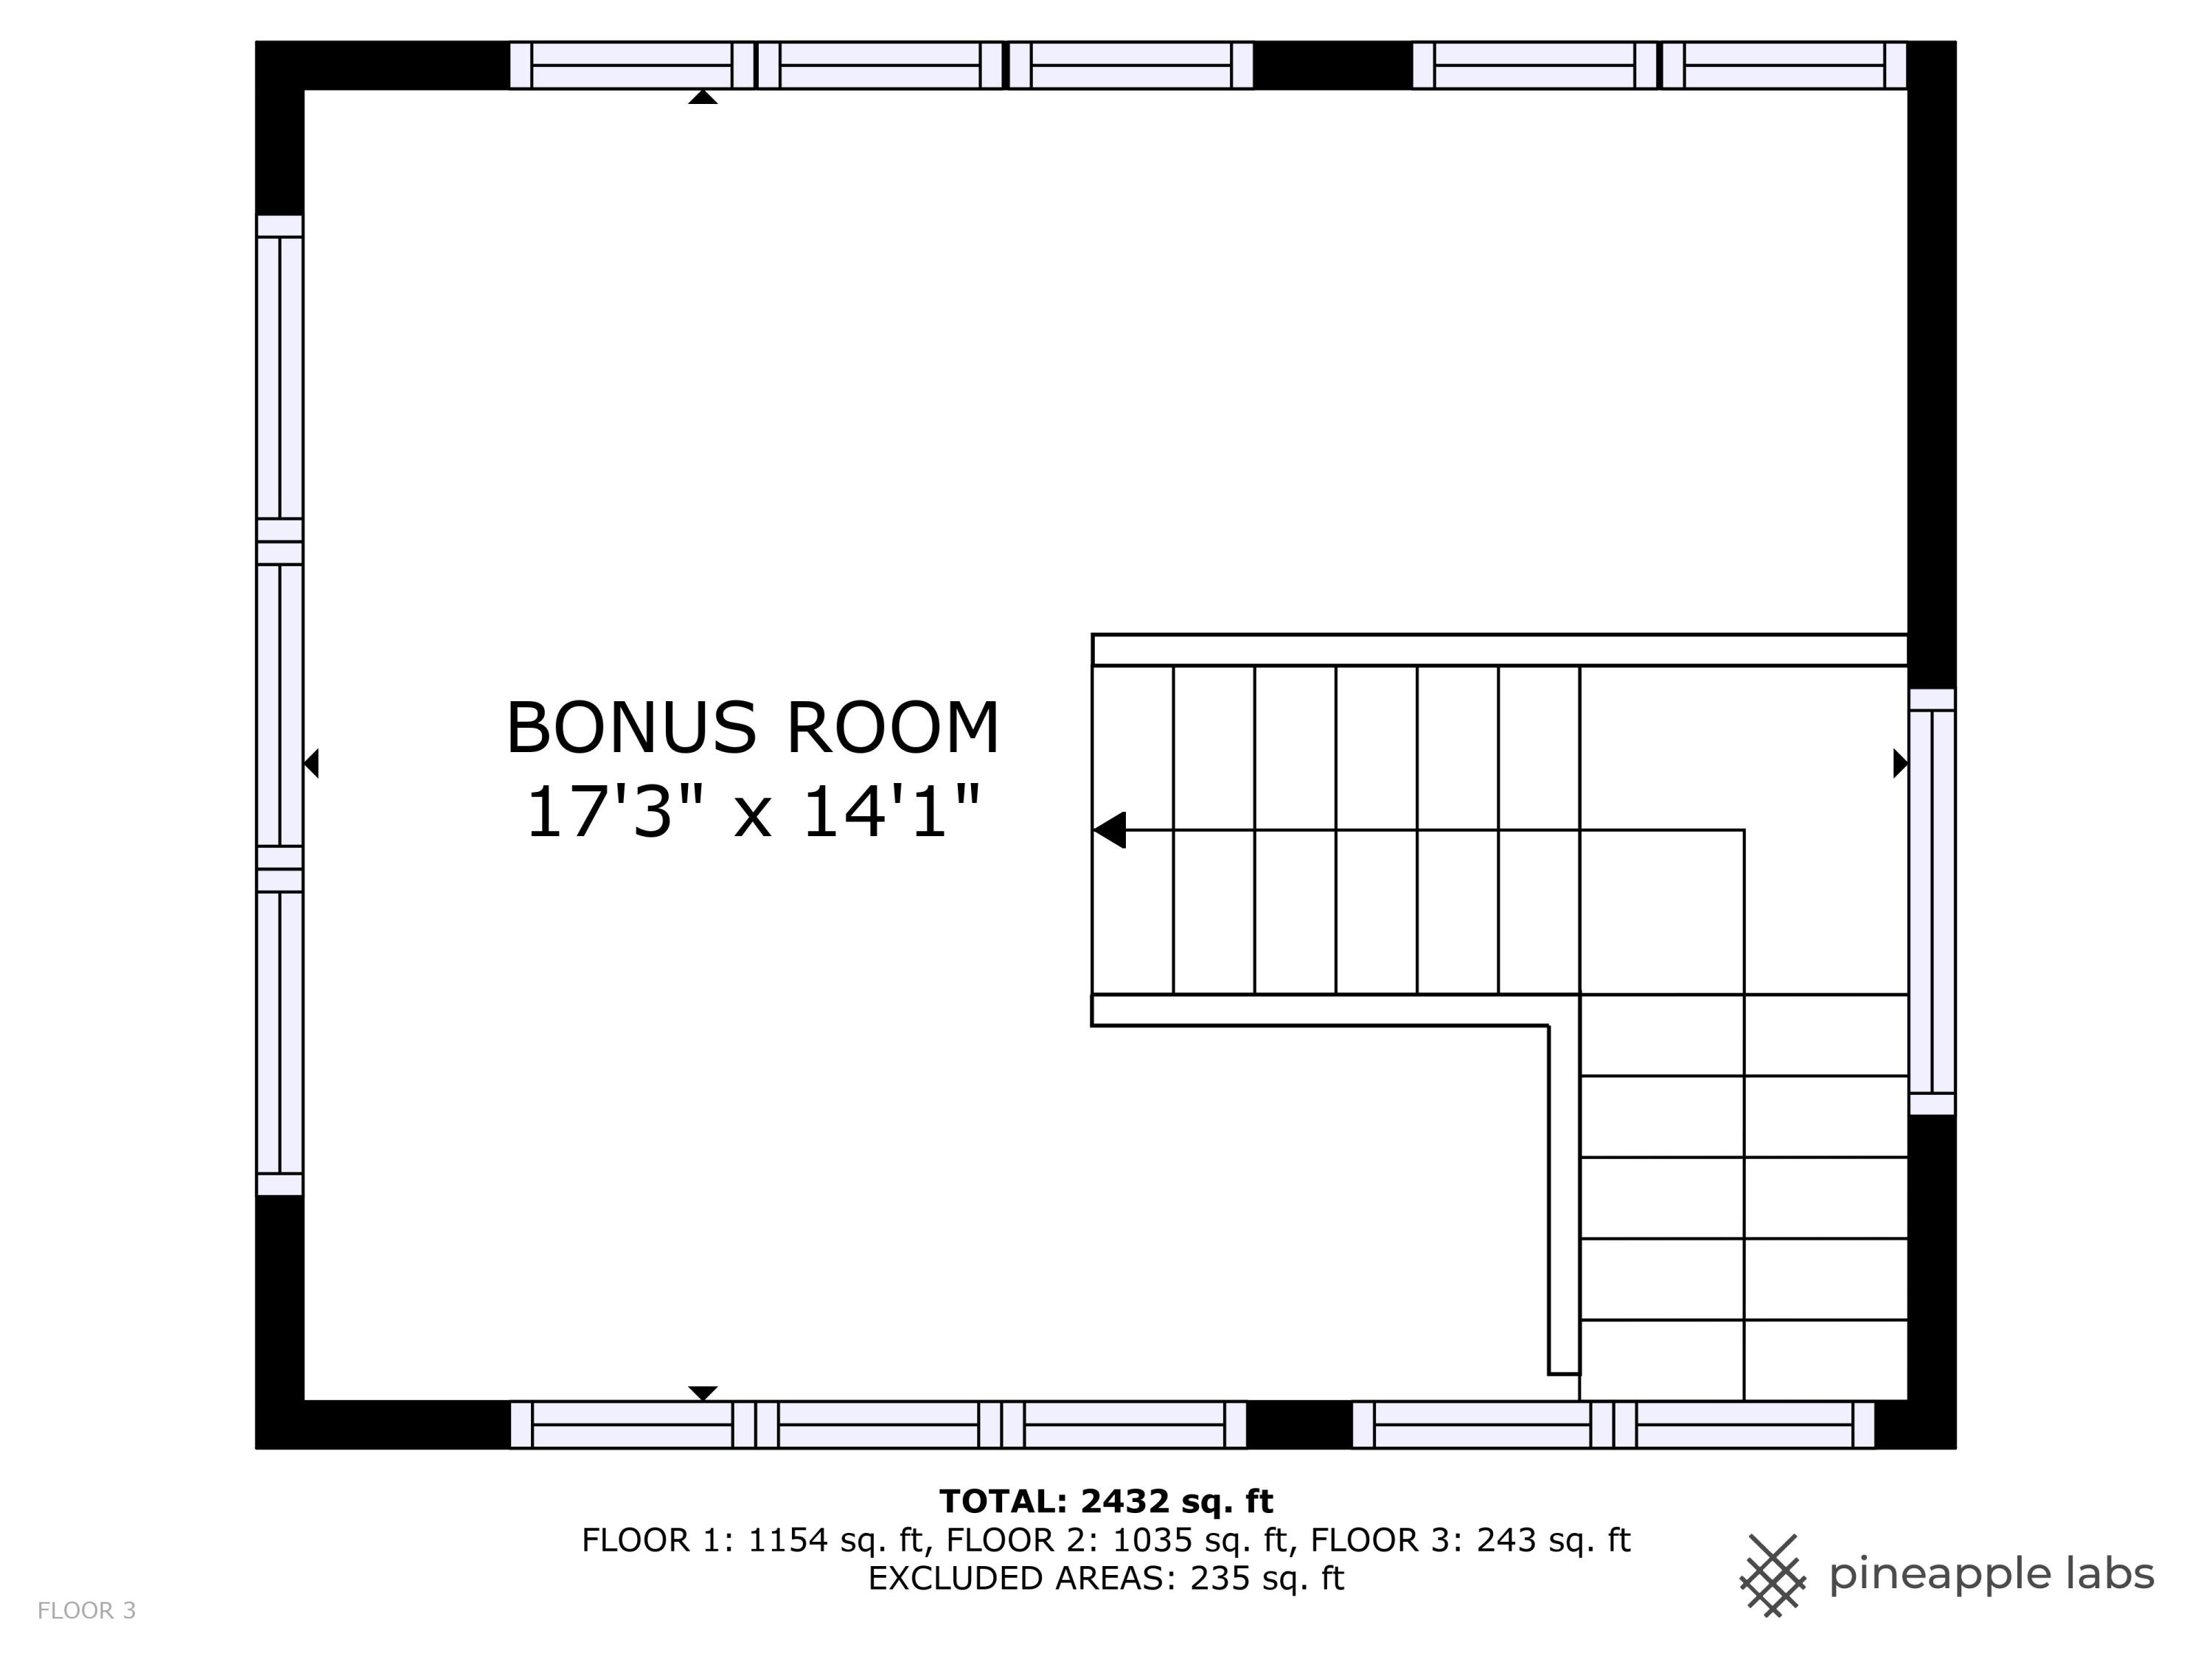
$749,000
3
bds
|
2
ba
|
2,432
sqft
|
built
2006
46108 Glenwood Ave, New Buffalo, MI 49117
$-1,346
Cash flow
-9.4%
Cash-on-Cash Return
4.1%
Cap rate
0.5%
Rent to Value Ratio
Active
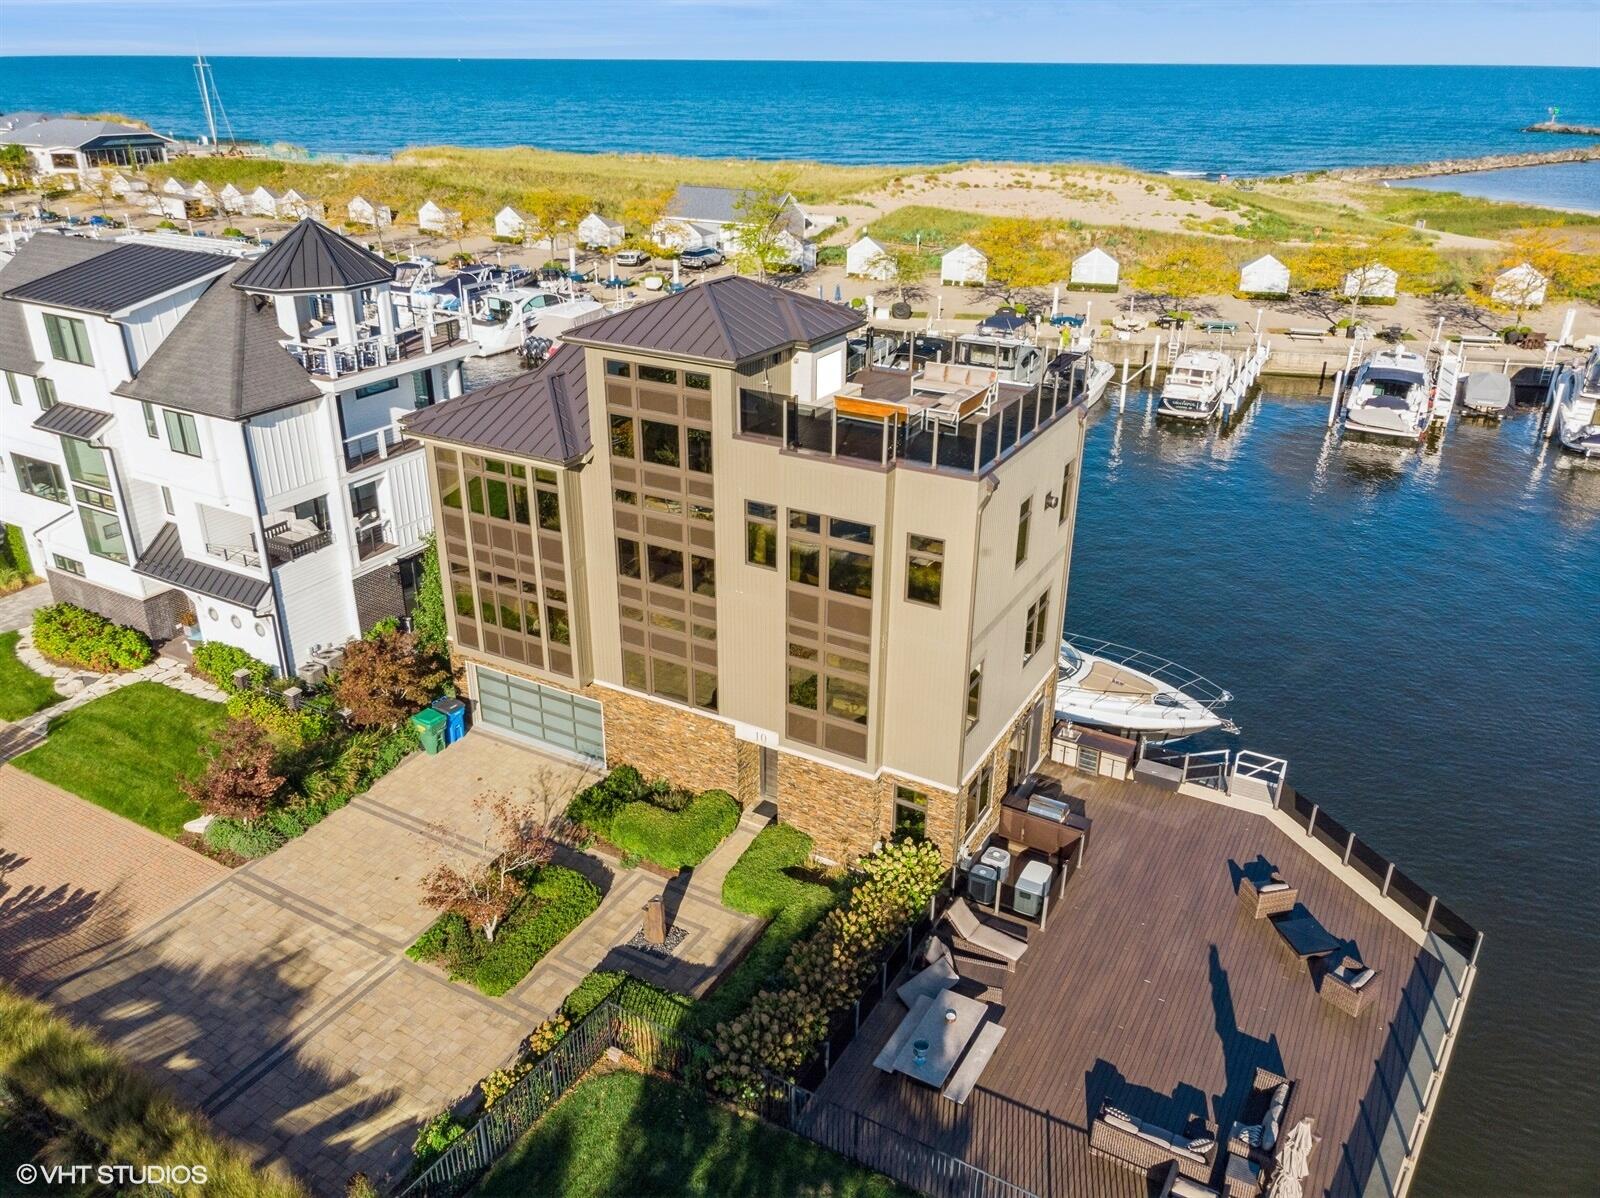
$7,370,000
3
bds
|
5
ba
|
3,641
sqft
|
built
2016
10 Peninsula Dr, New Buffalo, MI 49117
$-36,564
Cash flow
-25.9%
Cash-on-Cash Return
0.3%
Cap rate
0.1%
Rent to Value Ratio
Active
$4,895,000
7
bds
|
8
ba
|
10,167
sqft
|
built
2009
49106 Sun Valley Falls Blvd, New Buffalo, MI 49117
$-23,533
Cash flow
-25.1%
Cash-on-Cash Return
0.5%
Cap rate
0.1%
Rent to Value Ratio