Newport Beach, CA Investment Properties for Sale
Browse homes for sale and investment properties in Newport Beach, CA. Refine your search by price, property type, or more.
Best cash flowing properties in Newport Beach, CA
Active
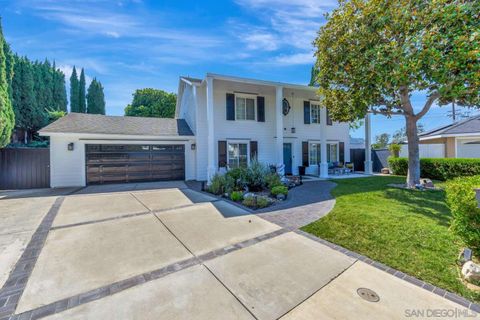
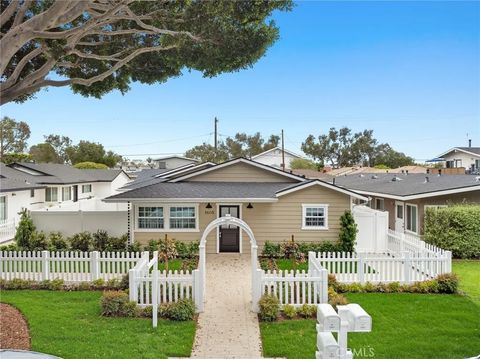
$2,699,000
5
bds
|
3
ba
|
2,585
sqft
|
built
1963
1572 Indus St, Newport Beach, CA 92660
$-8,749
Cash flow
-16.9%
Cash-on-Cash Return
2.2%
Cap rate
0.3%
Rent to Value Ratio
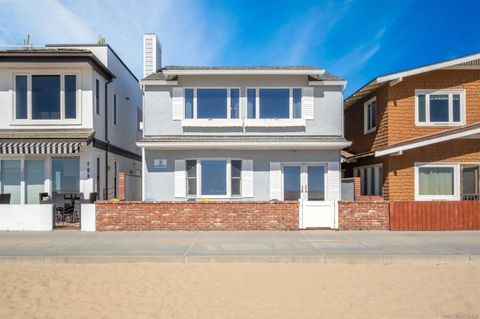
Active
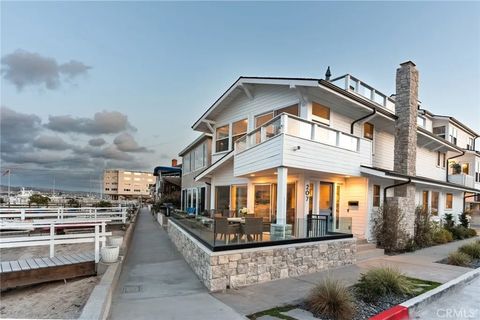
$3,300,000
4
bds
|
3
ba
|
0
sqft
|
built
1928
1825 W Balboa Blvd, Newport Beach, CA 92663
$-9,787
Cash flow
-15.5%
Cash-on-Cash Return
2.5%
Cap rate
0.3%
Rent to Value Ratio
19 out of 176 properties for sale in Newport Beach, CA
Limited Results Shown
Create a free account, or log in to reveal all property listings and enjoy the complete experience.
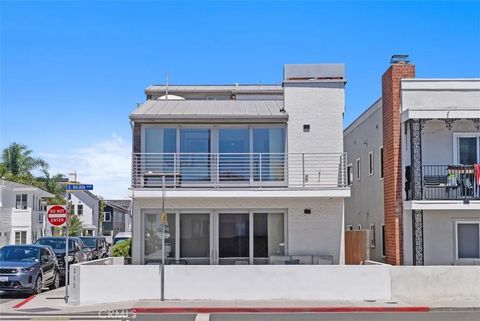
Active
$10,900,000
6
bds
|
0
ba
|
0
sqft
|
built
1965
5901 Seashore Dr, Newport Beach, CA 92663
$-51,252
Cash flow
-24.5%
Cash-on-Cash Return
0.4%
Cap rate
0.1%
Rent to Value Ratio
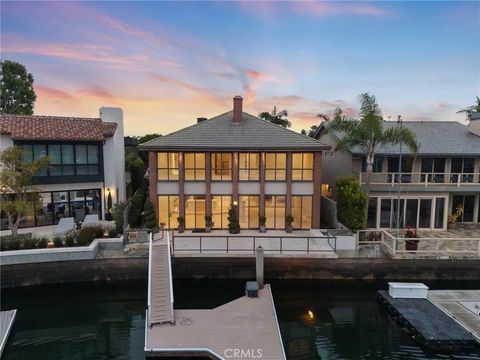
Active
$8,249,000
5
bds
|
5
ba
|
4,503
sqft
|
built
1969
73 Linda Isle, Newport Beach, CA 92660
$-35,666
Cash flow
-22.6%
Cash-on-Cash Return
0.9%
Cap rate
0.1%
Rent to Value Ratio
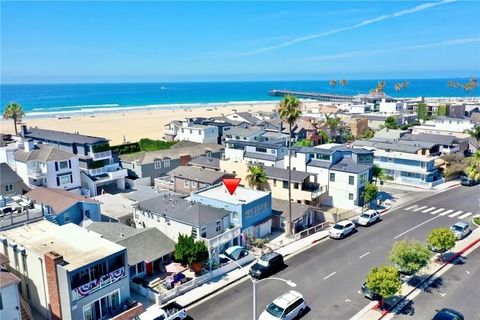
Active
$7,295,000
3
bds
|
3
ba
|
1,583
sqft
|
built
1933
206 E Oceanfront, Newport Beach, CA 92661
$-32,609
Cash flow
-23.3%
Cash-on-Cash Return
0.7%
Cap rate
0.1%
Rent to Value Ratio
Active
$4,899,000
4
bds
|
0
ba
|
0
sqft
|
built
2017
200 E Balboa Blvd, Newport Beach, CA 92661
$-16,906
Cash flow
-18.0%
Cash-on-Cash Return
1.9%
Cap rate
0.2%
Rent to Value Ratio

Active
$4,495,000
3
bds
|
0
ba
|
0
sqft
|
built
2024
1103 Balboa Ave, Newport Beach, CA 92662
$-18,796
Cash flow
-21.8%
Cash-on-Cash Return
1.0%
Cap rate
0.1%
Rent to Value Ratio

Active
$14,500,000
5
bds
|
6
ba
|
4,477
sqft
|
built
2003
2238 Channel Rd, Newport Beach, CA 92661
$-66,420
Cash flow
-23.9%
Cash-on-Cash Return
0.6%
Cap rate
0.1%
Rent to Value Ratio
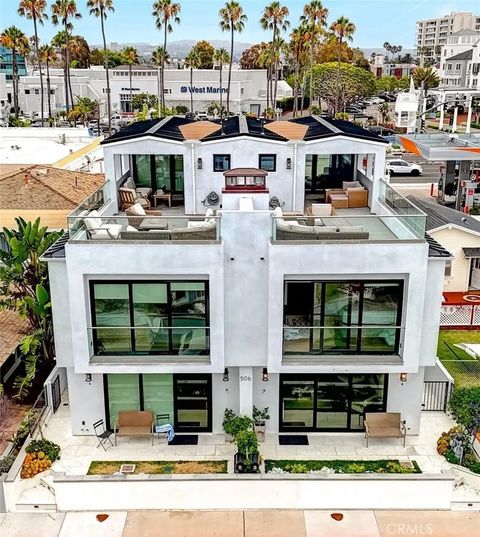
Active
$8,125,000
10
bds
|
12
ba
|
0
sqft
|
built
2023
506 Clubhouse Ave, Newport Beach, CA 92663
$-34,322
Cash flow
-22.0%
Cash-on-Cash Return
1.0%
Cap rate
0.1%
Rent to Value Ratio
Active
$4,200,000
5
bds
|
5
ba
|
0
sqft
|
built
1958
1324 W Balboa Blvd, Newport Beach, CA 92661
$-18,201
Cash flow
-22.6%
Cash-on-Cash Return
0.9%
Cap rate
0.1%
Rent to Value Ratio
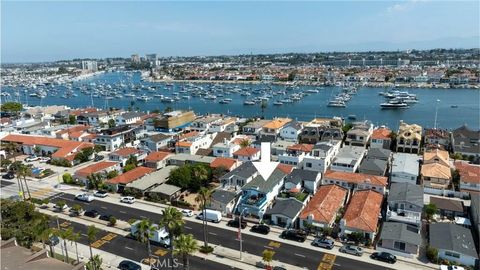
Active
$4,498,000
5
bds
|
4
ba
|
0
sqft
|
built
1994
410 Clubhouse Ave, Newport Beach, CA 92663
$-20,950
Cash flow
-24.3%
Cash-on-Cash Return
0.5%
Cap rate
0.1%
Rent to Value Ratio
Active
$3,500,000
7
bds
|
5
ba
|
0
sqft
|
built
1948
1532 Miramar Dr, Newport Beach, CA 92661
$-14,593
Cash flow
-21.8%
Cash-on-Cash Return
1.1%
Cap rate
0.1%
Rent to Value Ratio
Active
$8,088,000
6
bds
|
6
ba
|
0
sqft
|
built
1948
1509 W Balboa Blvd, Newport Beach, CA 92663
$-38,137
Cash flow
-24.6%
Cash-on-Cash Return
0.4%
Cap rate
0.0%
Rent to Value Ratio
Active
$14,000,000
2
bds
|
1
ba
|
0
sqft
|
built
1975
1601 E 15th St, Newport Beach, CA 92663
$-68,308
Cash flow
-25.5%
Cash-on-Cash Return
0.2%
Cap rate
0.0%
Rent to Value Ratio
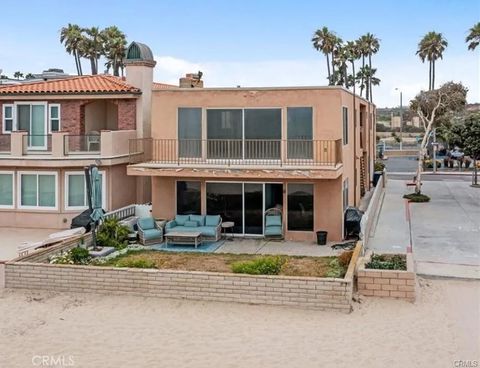
Active
$6,690,000
4
bds
|
3
ba
|
0
sqft
|
built
1973
700 E Oceanfront, Newport Beach, CA 92661
$-29,826
Cash flow
-23.3%
Cash-on-Cash Return
0.7%
Cap rate
0.1%
Rent to Value Ratio
Active
$4,250,000
6
bds
|
3
ba
|
0
sqft
|
built
1955
1805 Clay St, Newport Beach, CA 92663
$-18,454
Cash flow
-22.7%
Cash-on-Cash Return
0.9%
Cap rate
0.1%
Rent to Value Ratio
Active
$18,995,000
6
bds
|
8
ba
|
0
sqft
|
built
1954
3312 Via Lido, Newport Beach, CA 92663
$-92,599
Cash flow
-25.4%
Cash-on-Cash Return
0.2%
Cap rate
0.0%
Rent to Value Ratio
Active
$9,999,999
5
bds
|
5
ba
|
0
sqft
|
built
1976
207 E Edgewater Ave, Newport Beach, CA 92661
$-43,734
Cash flow
-22.8%
Cash-on-Cash Return
0.8%
Cap rate
0.1%
Rent to Value Ratio
Active
$7,995,000
7
bds
|
5
ba
|
0
sqft
|
built
1947
1510 W Oceanfront, Newport Beach, CA 92663
$-37,322
Cash flow
-24.4%
Cash-on-Cash Return
0.5%
Cap rate
0.1%
Rent to Value Ratio