North Logan, UT Investment Properties for Sale
Browse homes for sale and investment properties in North Logan, UT. Refine your search by price, property type, or more.
Best cash flowing properties in North Logan, UT
Active
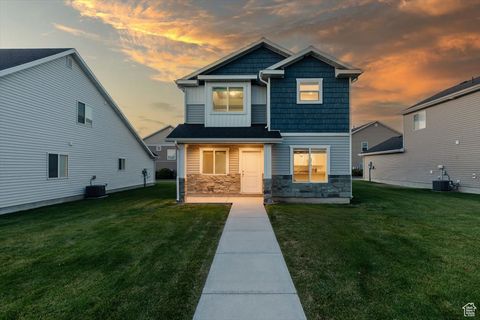
$375,000
3
bds
|
3
ba
|
1,689
sqft
|
built
2016
162 E 2480 N, North Logan, UT 84341
$-586
Cash flow
-8.2%
Cash-on-Cash Return
3.8%
Cap rate
0.6%
Rent to Value Ratio
Active
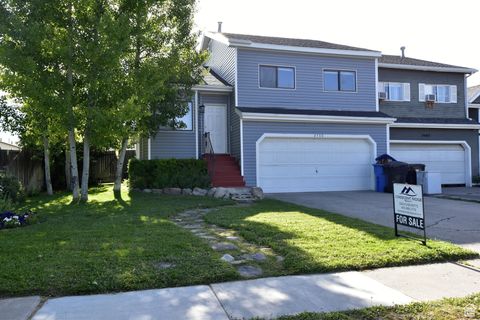
$359,900
4
bds
|
2
ba
|
1,745
sqft
|
built
1986
2700 N 300 E, North Logan, UT 84341
$-853
Cash flow
-12.4%
Cash-on-Cash Return
2.8%
Cap rate
0.4%
Rent to Value Ratio
16 out of 16 properties for sale in North Logan, UT
Limited Results Shown
Create a free account, or log in to reveal all property listings and enjoy the complete experience.
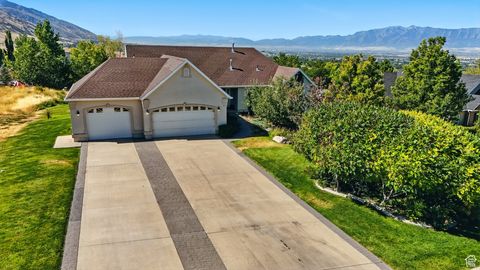
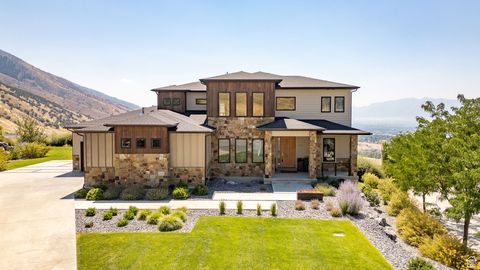
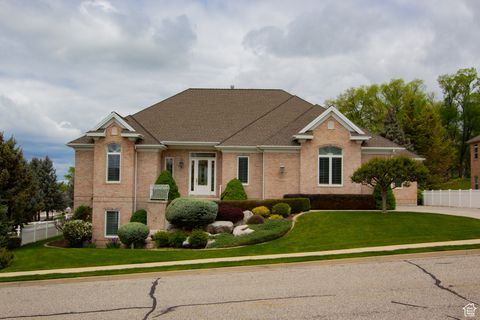
Active
$749,000
5
bds
|
3
ba
|
3,311
sqft
|
built
1997
1990 E Canyon Ridge Dr, North Logan, UT 84341
$-1,918
Cash flow
-13.4%
Cash-on-Cash Return
2.6%
Cap rate
0.4%
Rent to Value Ratio
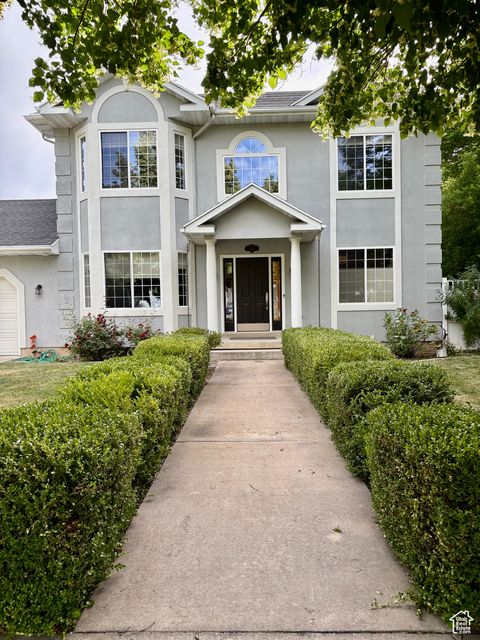
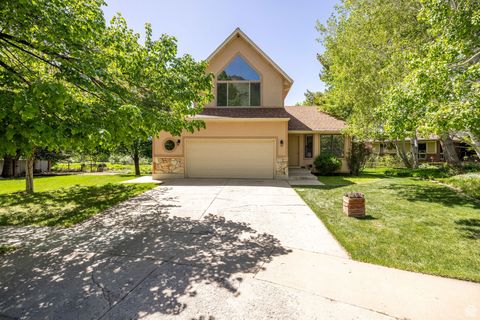
Active
$674,000
5
bds
|
4
ba
|
3,457
sqft
|
built
1992
1801 N 1700 E, North Logan, UT 84341
$-1,489
Cash flow
-11.5%
Cash-on-Cash Return
3.0%
Cap rate
0.4%
Rent to Value Ratio
Active
$1,595,000
6
bds
|
6
ba
|
5,494
sqft
|
built
2018
2835 Naomi Cir, North Logan, UT 84341
$-5,963
Cash flow
-19.5%
Cash-on-Cash Return
1.2%
Cap rate
0.2%
Rent to Value Ratio
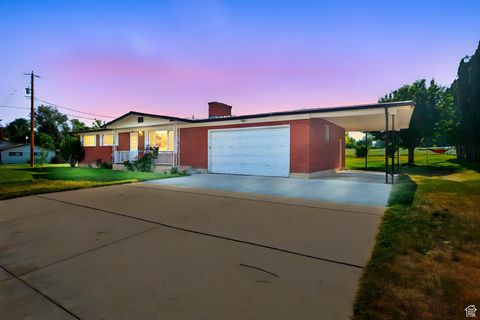
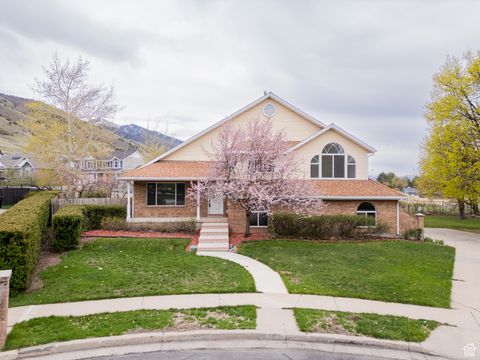
Active
$489,900
6
bds
|
2
ba
|
2,592
sqft
|
built
1963
2280 N 800 E, North Logan, UT 84341
$-1,272
Cash flow
-13.5%
Cash-on-Cash Return
2.6%
Cap rate
0.4%
Rent to Value Ratio

Active
$635,000
5
bds
|
3
ba
|
4,935
sqft
|
built
1987
1580 E 1630 N, North Logan, UT 84341
$-1,053
Cash flow
-8.7%
Cash-on-Cash Return
3.7%
Cap rate
0.5%
Rent to Value Ratio
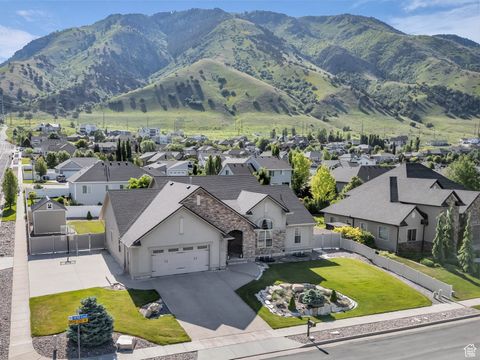
Active
$624,900
5
bds
|
4
ba
|
3,172
sqft
|
built
1992
2951 N 1200 E, North Logan, UT 84341
$-1,379
Cash flow
-11.5%
Cash-on-Cash Return
3.0%
Cap rate
0.4%
Rent to Value Ratio
Active
$784,999
6
bds
|
4
ba
|
3,903
sqft
|
built
2008
1872 N 1850 E, North Logan, UT 84341
$-2,033
Cash flow
-13.5%
Cash-on-Cash Return
2.6%
Cap rate
0.4%
Rent to Value Ratio
Active
$899,000
4
bds
|
4
ba
|
5,785
sqft
|
built
2003
1315 E 1550 N, North Logan, UT 84341
$-2,889
Cash flow
-16.8%
Cash-on-Cash Return
1.8%
Cap rate
0.3%
Rent to Value Ratio
Active
$629,000
4
bds
|
3
ba
|
3,300
sqft
|
built
1987
1729 E 1700 N, North Logan, UT 84341
$-1,781
Cash flow
-14.8%
Cash-on-Cash Return
2.3%
Cap rate
0.3%
Rent to Value Ratio
Active
$566,000
5
bds
|
4
ba
|
2,844
sqft
|
built
1988
1720 N 1850 E, North Logan, UT 84341
$-1,276
Cash flow
-11.8%
Cash-on-Cash Return
3.0%
Cap rate
0.4%
Rent to Value Ratio
Active
$1,399,000
6
bds
|
5
ba
|
6,721
sqft
|
built
1994
1910 E Canyon Ridge Dr, North Logan, UT 84341
$-4,939
Cash flow
-18.4%
Cash-on-Cash Return
1.4%
Cap rate
0.2%
Rent to Value Ratio

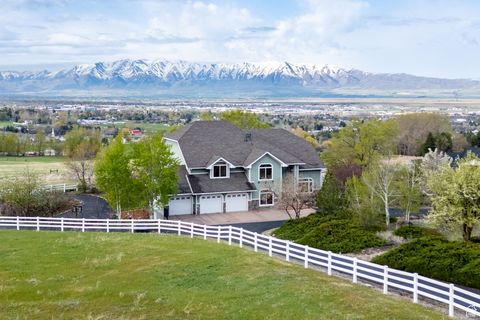
Active
$769,000
6
bds
|
4
ba
|
4,174
sqft
|
built
2005
534 E 2000 N, North Logan, UT 84341
$-1,491
Cash flow
-10.1%
Cash-on-Cash Return
3.4%
Cap rate
0.5%
Rent to Value Ratio

Active
$544,999
5
bds
|
3
ba
|
3,558
sqft
|
built
1969
2047 N 1350 E, North Logan, UT 84341
$-957
Cash flow
-9.2%
Cash-on-Cash Return
3.6%
Cap rate
0.5%
Rent to Value Ratio
Active
$1,499,999
5
bds
|
5
ba
|
5,252
sqft
|
built
2020
3450 N 1930 E, North Logan, UT 84341
$-3,234
Cash flow
-11.2%
Cash-on-Cash Return
3.1%
Cap rate
0.4%
Rent to Value Ratio