North Miami Beach, FL Investment Properties for Sale
Browse homes for sale and investment properties in North Miami Beach, FL. Refine your search by price, property type, or more.
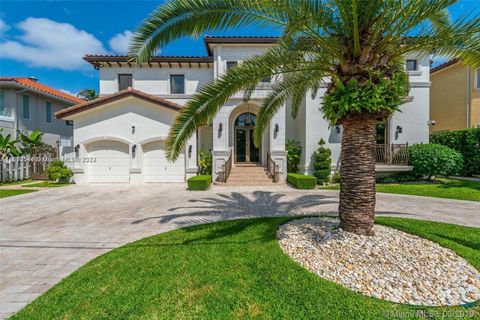
Best cash flowing properties in North Miami Beach, FL

Active
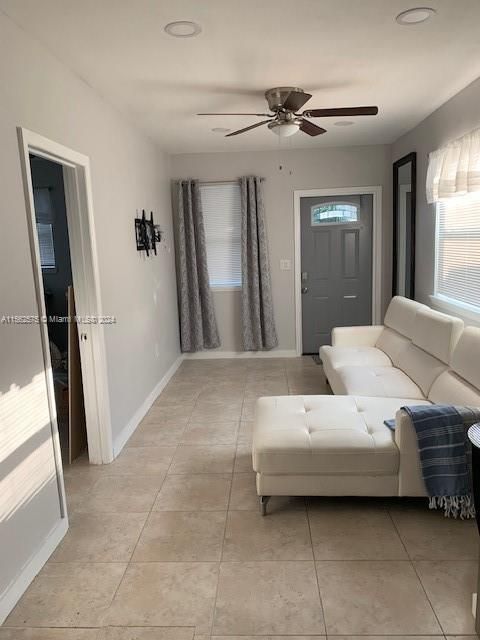
$229,000
1
bds
|
2
ba
|
865
sqft
|
built
1971
3660 NE 166th St, North Miami Beach, FL 33160
$-82
Cash flow
-1.9%
Cash-on-Cash Return
5.7%
Cap rate
0.9%
Rent to Value Ratio
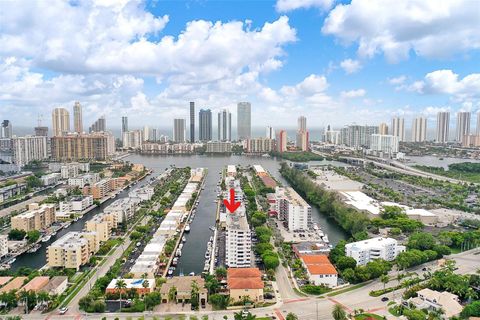
Active
$250,000
1
bds
|
1
ba
|
563
sqft
|
built
1962
2475 NE 136th Ter, North Miami Beach, FL 33181
$-135
Cash flow
-2.8%
Cash-on-Cash Return
5.5%
Cap rate
0.8%
Rent to Value Ratio
274 out of 414 properties for sale in North Miami Beach, FL
Limited Results Shown
Create a free account, or log in to reveal all property listings and enjoy the complete experience.
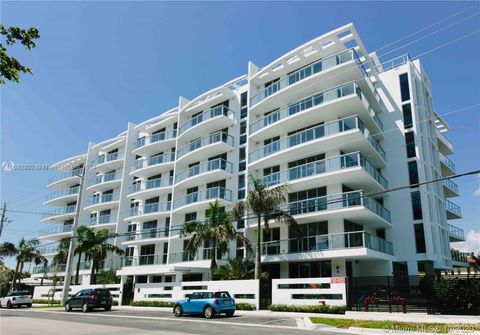
Active
$259,000
1
bds
|
1
ba
|
828
sqft
|
built
1972
3545 NE 166th St, North Miami Beach, FL 33160
$-675
Cash flow
-13.6%
Cash-on-Cash Return
3.0%
Cap rate
0.8%
Rent to Value Ratio
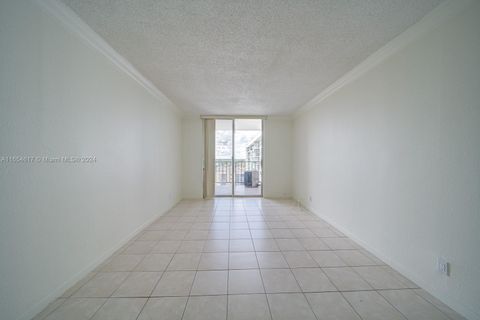
Active
$500,000
2
bds
|
2
ba
|
1,097
sqft
|
built
2019
13800 Highland Dr, North Miami Beach, FL 33181
$-805
Cash flow
-8.4%
Cash-on-Cash Return
4.2%
Cap rate
0.7%
Rent to Value Ratio

Active
$795,000
3
bds
|
2
ba
|
1,220
sqft
|
built
1954
17130 NE 7th Ave, North Miami Beach, FL 33162
$-2,135
Cash flow
-14.0%
Cash-on-Cash Return
2.9%
Cap rate
0.5%
Rent to Value Ratio
Active
$200,000
1
bds
|
2
ba
|
792
sqft
|
built
1972
2903 NE 163rd St, North Miami Beach, FL 33160
$-614
Cash flow
-16.0%
Cash-on-Cash Return
2.5%
Cap rate
0.9%
Rent to Value Ratio

Active
$269,000
1
bds
|
2
ba
|
790
sqft
|
built
1969
2841 NE 163rd St, North Miami Beach, FL 33160
$-525
Cash flow
-10.2%
Cash-on-Cash Return
3.8%
Cap rate
0.9%
Rent to Value Ratio

Active
$310,000
1
bds
|
2
ba
|
990
sqft
|
built
1980
16570 NE 26th Ave, North Miami Beach, FL 33160
$-1,331
Cash flow
-22.4%
Cash-on-Cash Return
1.0%
Cap rate
0.6%
Rent to Value Ratio
Active
$275,000
2
bds
|
2
ba
|
750
sqft
|
built
1963
2072 NE 169th St, North Miami Beach, FL 33162
$-758
Cash flow
-14.4%
Cash-on-Cash Return
2.8%
Cap rate
0.7%
Rent to Value Ratio

Active
$352,000
2
bds
|
2
ba
|
1,318
sqft
|
built
1974
16558 NE 26th Ave, North Miami Beach, FL 33160
$-1,097
Cash flow
-16.3%
Cash-on-Cash Return
2.4%
Cap rate
0.8%
Rent to Value Ratio

Active
$243,000
1
bds
|
2
ba
|
865
sqft
|
built
1971
3660 NE 166th St, North Miami Beach, FL 33160
$-918
Cash flow
-19.7%
Cash-on-Cash Return
1.6%
Cap rate
0.8%
Rent to Value Ratio
Active
$220,000
2
bds
|
2
ba
|
1,020
sqft
|
built
1973
16851 NE 23rd Ave, North Miami Beach, FL 33160
$-557
Cash flow
-13.2%
Cash-on-Cash Return
3.1%
Cap rate
1.0%
Rent to Value Ratio

Active
$255,000
2
bds
|
2
ba
|
785
sqft
|
built
1973
3545 NE 167th St, North Miami Beach, FL 33160
$-760
Cash flow
-15.5%
Cash-on-Cash Return
2.6%
Cap rate
0.9%
Rent to Value Ratio
Active
$229,000
1
bds
|
2
ba
|
865
sqft
|
built
1971
3660 NE 166th St, North Miami Beach, FL 33160
$-82
Cash flow
-1.9%
Cash-on-Cash Return
5.7%
Cap rate
0.9%
Rent to Value Ratio

Active
$233,000
1
bds
|
2
ba
|
865
sqft
|
built
1971
3660 NE 166th St, North Miami Beach, FL 33160
$-853
Cash flow
-19.1%
Cash-on-Cash Return
1.8%
Cap rate
0.9%
Rent to Value Ratio

Active
$1,120,000
2
bds
|
2
ba
|
1,463
sqft
|
built
2010
15811 Collins Ave, North Miami Beach, FL 33160
$-3,896
Cash flow
-18.1%
Cash-on-Cash Return
2.0%
Cap rate
0.6%
Rent to Value Ratio
Active
$695,000
4
bds
|
2
ba
|
1,276
sqft
|
built
1953
1801 NE 176th St, North Miami Beach, FL 33162
$-1,933
Cash flow
-14.5%
Cash-on-Cash Return
2.8%
Cap rate
0.5%
Rent to Value Ratio

Active
$233,000
1
bds
|
2
ba
|
778
sqft
|
built
1973
2935 NE 163rd St, North Miami Beach, FL 33160
$-649
Cash flow
-14.5%
Cash-on-Cash Return
2.8%
Cap rate
0.8%
Rent to Value Ratio

Active
$699,995
3
bds
|
3
ba
|
2,111
sqft
|
built
1957
18441 NE 21st Ave, North Miami Beach, FL 33179
$-1,768
Cash flow
-13.2%
Cash-on-Cash Return
3.1%
Cap rate
0.5%
Rent to Value Ratio
Active
$349,000
2
bds
|
2
ba
|
909
sqft
|
built
1972
3702 NE 171st St, North Miami Beach, FL 33160
$-1,058
Cash flow
-15.8%
Cash-on-Cash Return
2.5%
Cap rate
0.7%
Rent to Value Ratio
Active
$290,000
2
bds
|
2
ba
|
1,213
sqft
|
built
1979
17890 W Dixie Hwy, North Miami Beach, FL 33160
$-659
Cash flow
-11.9%
Cash-on-Cash Return
3.4%
Cap rate
0.8%
Rent to Value Ratio
Active
$395,000
2
bds
|
2
ba
|
1,085
sqft
|
built
1974
4000 NE 170th St, North Miami Beach, FL 33160
$-1,155
Cash flow
-15.3%
Cash-on-Cash Return
2.6%
Cap rate
0.7%
Rent to Value Ratio

Active
$5,600,000
6
bds
|
7
ba
|
0
sqft
|
built
2007
3344 NE 167th St, North Miami Beach, FL 33160
$-26,124
Cash flow
-24.3%
Cash-on-Cash Return
0.5%
Cap rate
0.2%
Rent to Value Ratio

Active
$265,000
2
bds
|
2
ba
|
1,025
sqft
|
built
1971
3660 NE 166th St, North Miami Beach, FL 33160
$-1,192
Cash flow
-23.5%
Cash-on-Cash Return
0.7%
Cap rate
0.8%
Rent to Value Ratio
Active
$250,000
1
bds
|
1
ba
|
563
sqft
|
built
1962
2475 NE 136th Ter, North Miami Beach, FL 33181
$-135
Cash flow
-2.8%
Cash-on-Cash Return
5.5%
Cap rate
0.8%
Rent to Value Ratio
Active
$315,000
1
bds
|
2
ba
|
1,053
sqft
|
built
1974
16558 NE 26th Ave, North Miami Beach, FL 33160
$-1,541
Cash flow
-25.5%
Cash-on-Cash Return
0.3%
Cap rate
0.5%
Rent to Value Ratio
Active
$499,999
2
bds
|
2
ba
|
1,373
sqft
|
built
1955
1660 NE 174th St, North Miami Beach, FL 33162
$-881
Cash flow
-9.2%
Cash-on-Cash Return
4.0%
Cap rate
0.6%
Rent to Value Ratio
Active
$5,350,000
6
bds
|
8
ba
|
5,293
sqft
|
built
2007
16433 NE 31st Ave, North Miami Beach, FL 33160
$-25,909
Cash flow
-25.3%
Cash-on-Cash Return
0.3%
Cap rate
0.2%
Rent to Value Ratio
Active
$285,000
2
bds
|
2
ba
|
1,025
sqft
|
built
1971
3660 NE 166th St, North Miami Beach, FL 33160
$-762
Cash flow
-13.9%
Cash-on-Cash Return
2.9%
Cap rate
0.9%
Rent to Value Ratio
Active
$239,000
1
bds
|
2
ba
|
865
sqft
|
built
1971
3660 NE 166th St, North Miami Beach, FL 33160
$-598
Cash flow
-13.1%
Cash-on-Cash Return
3.1%
Cap rate
1.0%
Rent to Value Ratio
Active
$485,000
3
bds
|
1
ba
|
1,012
sqft
|
built
1953
1540 NE 176th St, North Miami Beach, FL 33162
$-796
Cash flow
-8.6%
Cash-on-Cash Return
4.2%
Cap rate
0.7%
Rent to Value Ratio
Active
$195,000
2
bds
|
1
ba
|
839
sqft
|
built
1962
1450 NE 170th St, North Miami Beach, FL 33162
$-199
Cash flow
-5.3%
Cash-on-Cash Return
4.9%
Cap rate
0.9%
Rent to Value Ratio
Active
$495,000
3
bds
|
3
ba
|
2,008
sqft
|
built
1972
3703 NE 166th St, North Miami Beach, FL 33160
$-1,473
Cash flow
-15.5%
Cash-on-Cash Return
2.6%
Cap rate
0.6%
Rent to Value Ratio
Active
$1,999,999
4
bds
|
6
ba
|
4,130
sqft
|
built
1985
20215 W Oak Haven Cir, North Miami Beach, FL 33179
$-6,893
Cash flow
-18.0%
Cash-on-Cash Return
2.0%
Cap rate
0.4%
Rent to Value Ratio
Active
$209,000
1
bds
|
1
ba
|
728
sqft
|
built
1973
16851 NE 23rd Ave, North Miami Beach, FL 33160
$-441
Cash flow
-11.0%
Cash-on-Cash Return
3.6%
Cap rate
0.9%
Rent to Value Ratio
Active
$470,000
2
bds
|
2
ba
|
903
sqft
|
built
2019
13800 Highland Dr, North Miami Beach, FL 33181
$-614
Cash flow
-6.8%
Cash-on-Cash Return
4.6%
Cap rate
0.6%
Rent to Value Ratio