North Miami Beach, FL Investment Properties for Sale
Browse homes for sale and investment properties in North Miami Beach, FL. Refine your search by price, property type, or more.
Best cash flowing properties in North Miami Beach, FL

Active
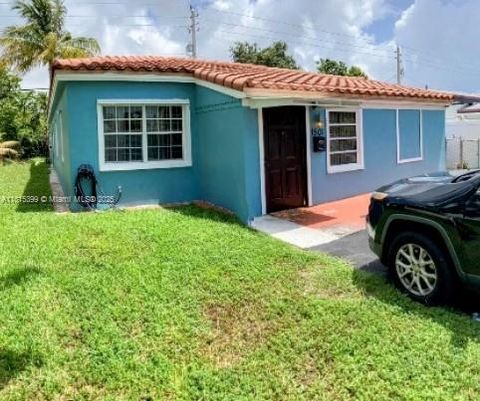
$210,000
1
bds
|
2
ba
|
930
sqft
|
built
1975
16750 NE 10th Ave, North Miami Beach, FL 33162
$83
Cash flow
2.1%
Cash-on-Cash Return
6.6%
Cap rate
1.0%
Rent to Value Ratio

Active
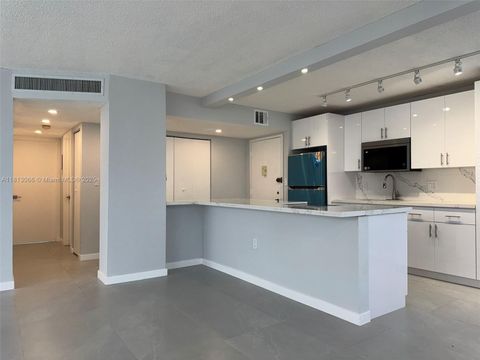
$150,000
1
bds
|
2
ba
|
790
sqft
|
built
1970
2025 NE 164th St, North Miami Beach, FL 33162
$29
Cash flow
1.0%
Cash-on-Cash Return
6.4%
Cap rate
1.3%
Rent to Value Ratio
275 out of 416 properties for sale in North Miami Beach, FL
Limited Results Shown
Create a free account, or log in to reveal all property listings and enjoy the complete experience.
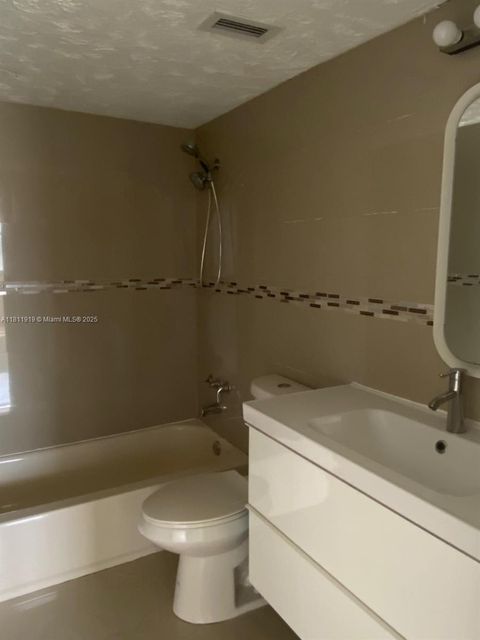
Active
$155,000
1
bds
|
1
ba
|
658
sqft
|
built
1971
16465 NE 22nd Ave, North Miami Beach, FL 33160
$-261
Cash flow
-8.8%
Cash-on-Cash Return
4.1%
Cap rate
1.2%
Rent to Value Ratio
Active
$165,000
1
bds
|
2
ba
|
790
sqft
|
built
1970
2025 NE 164th St, North Miami Beach, FL 33162
$-297
Cash flow
-9.4%
Cash-on-Cash Return
4.0%
Cap rate
1.0%
Rent to Value Ratio

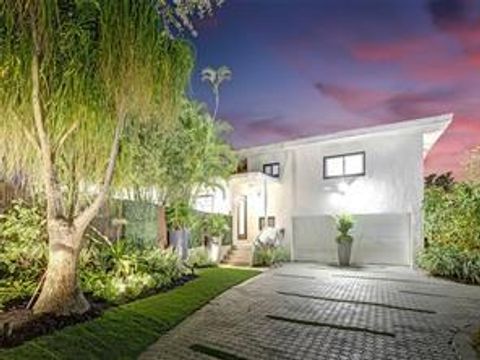
Active
$530,000
3
bds
|
2
ba
|
1,130
sqft
|
built
1952
1428 NE 153rd Ter, North Miami Beach, FL 33162
$-668
Cash flow
-6.6%
Cash-on-Cash Return
4.6%
Cap rate
0.7%
Rent to Value Ratio

Active
$549,000
3
bds
|
2
ba
|
1,195
sqft
|
built
1952
1640 NE 183rd St, North Miami Beach, FL 33179
$-1,847
Cash flow
-17.6%
Cash-on-Cash Return
2.1%
Cap rate
0.4%
Rent to Value Ratio

Active
$260,000
2
bds
|
2
ba
|
785
sqft
|
built
1974
3642 NE 171st St, North Miami Beach, FL 33160
$-803
Cash flow
-16.1%
Cash-on-Cash Return
2.4%
Cap rate
0.9%
Rent to Value Ratio

Active
$1,980,000
3
bds
|
2
ba
|
1,889
sqft
|
built
1960
2010 NE 196th Ter, North Miami Beach, FL 33179
$-9,240
Cash flow
-24.3%
Cash-on-Cash Return
0.5%
Cap rate
0.2%
Rent to Value Ratio

Active
$275,000
3
bds
|
2
ba
|
702
sqft
|
built
1951
345 NE 168th St, North Miami Beach, FL 33162
$-100
Cash flow
-1.9%
Cash-on-Cash Return
5.7%
Cap rate
0.8%
Rent to Value Ratio

Active
$850,000
2
bds
|
3
ba
|
1,345
sqft
|
built
1982
4000 NE 168th St, North Miami Beach, FL 33160
$-2,946
Cash flow
-18.1%
Cash-on-Cash Return
2.0%
Cap rate
0.5%
Rent to Value Ratio

Active
$299,000
2
bds
|
2
ba
|
1,190
sqft
|
built
1974
16508 NE 26th Ave, North Miami Beach, FL 33160
$-1,038
Cash flow
-18.1%
Cash-on-Cash Return
2.0%
Cap rate
0.9%
Rent to Value Ratio

Active
$620,000
3
bds
|
1
ba
|
1,265
sqft
|
built
1953
280 NE 169th St, North Miami Beach, FL 33162
$-1,010
Cash flow
-8.5%
Cash-on-Cash Return
4.2%
Cap rate
0.5%
Rent to Value Ratio

Active
$220,000
1
bds
|
2
ba
|
772
sqft
|
built
1973
2935 NE 163rd St, North Miami Beach, FL 33160
$-747
Cash flow
-17.7%
Cash-on-Cash Return
2.1%
Cap rate
0.7%
Rent to Value Ratio

Active
$2,700,000
3
bds
|
3
ba
|
2,344
sqft
|
built
1971
3446 NE 168th St, North Miami Beach, FL 33160
$-11,390
Cash flow
-22.0%
Cash-on-Cash Return
1.1%
Cap rate
0.3%
Rent to Value Ratio
Active
$765,000
3
bds
|
2
ba
|
1,395
sqft
|
built
1974
4000 NE 170th St, North Miami Beach, FL 33160
$-2,700
Cash flow
-18.4%
Cash-on-Cash Return
1.9%
Cap rate
0.5%
Rent to Value Ratio

Active
$295,000
1
bds
|
2
ba
|
1,053
sqft
|
built
1973
16546 NE 26th Ave, North Miami Beach, FL 33160
$-1,201
Cash flow
-21.2%
Cash-on-Cash Return
1.3%
Cap rate
0.7%
Rent to Value Ratio

Active
$500,000
3
bds
|
2
ba
|
1,088
sqft
|
built
1951
1728 NE 179th St, North Miami Beach, FL 33162
$-1,122
Cash flow
-11.7%
Cash-on-Cash Return
3.5%
Cap rate
0.6%
Rent to Value Ratio

Active
$899,770
3
bds
|
2
ba
|
1,485
sqft
|
built
1956
1121 NE 175th St, North Miami Beach, FL 33162
$-2,420
Cash flow
-14.0%
Cash-on-Cash Return
2.9%
Cap rate
0.4%
Rent to Value Ratio

Active
$2,150,000
4
bds
|
3
ba
|
2,374
sqft
|
built
1957
2050 NE 196th Ter, North Miami Beach, FL 33179
$-8,642
Cash flow
-21.0%
Cash-on-Cash Return
1.3%
Cap rate
0.3%
Rent to Value Ratio
Active
$150,000
1
bds
|
2
ba
|
790
sqft
|
built
1970
2025 NE 164th St, North Miami Beach, FL 33162
$29
Cash flow
1.0%
Cash-on-Cash Return
6.4%
Cap rate
1.3%
Rent to Value Ratio

Active
$525,000
3
bds
|
1
ba
|
1,367
sqft
|
built
1955
1435 NE 182nd St, North Miami Beach, FL 33162
$-1,077
Cash flow
-10.7%
Cash-on-Cash Return
3.7%
Cap rate
0.6%
Rent to Value Ratio

Active
$165,000
1
bds
|
2
ba
|
790
sqft
|
built
1970
2025 NE 164th St, North Miami Beach, FL 33162
$-141
Cash flow
-4.5%
Cash-on-Cash Return
5.1%
Cap rate
1.1%
Rent to Value Ratio
Active
$830,000
3
bds
|
2
ba
|
1,363
sqft
|
built
1957
17630 NE 4th Ave, North Miami Beach, FL 33162
$-2,866
Cash flow
-18.0%
Cash-on-Cash Return
2.0%
Cap rate
0.4%
Rent to Value Ratio

Active
$14,800,000
6
bds
|
8
ba
|
6,364
sqft
|
built
1989
3209 NE 169th St, North Miami Beach, FL 33160
$-78,959
Cash flow
-27.8%
Cash-on-Cash Return
-0.3%
Cap rate
0.1%
Rent to Value Ratio

Active
$165,000
1
bds
|
2
ba
|
790
sqft
|
built
1970
2025 NE 164th St, North Miami Beach, FL 33162
$-279
Cash flow
-8.8%
Cash-on-Cash Return
4.1%
Cap rate
1.0%
Rent to Value Ratio
Active
$800,000
3
bds
|
0
ba
|
1,580
sqft
|
built
1953
1501 NE 175th St, North Miami Beach, FL 33162
$-1,398
Cash flow
-9.1%
Cash-on-Cash Return
4.1%
Cap rate
0.5%
Rent to Value Ratio

Active
$249,900
2
bds
|
2
ba
|
1,213
sqft
|
built
1979
17890 W Dixie Hwy, North Miami Beach, FL 33160
$-693
Cash flow
-14.5%
Cash-on-Cash Return
2.8%
Cap rate
0.9%
Rent to Value Ratio

Active
$299,999
2
bds
|
2
ba
|
1,213
sqft
|
built
1980
16570 NE 26th Ave, North Miami Beach, FL 33160
$-1,202
Cash flow
-20.9%
Cash-on-Cash Return
1.3%
Cap rate
0.8%
Rent to Value Ratio

Active
$249,900
2
bds
|
2
ba
|
970
sqft
|
built
1969
16850 S Glades Dr, North Miami Beach, FL 33162
$-394
Cash flow
-8.2%
Cash-on-Cash Return
4.3%
Cap rate
0.8%
Rent to Value Ratio

Active
$524,900
3
bds
|
1
ba
|
1,256
sqft
|
built
1952
990 NE 159th St, North Miami Beach, FL 33162
$-1,021
Cash flow
-10.1%
Cash-on-Cash Return
3.8%
Cap rate
0.6%
Rent to Value Ratio
Active
$299,000
2
bds
|
2
ba
|
1,222
sqft
|
built
1975
1300 NE Miami Gardens Dr, North Miami Beach, FL 33179
$-412
Cash flow
-7.2%
Cash-on-Cash Return
4.5%
Cap rate
0.8%
Rent to Value Ratio

Active
$690,000
3
bds
|
2
ba
|
1,125
sqft
|
built
1953
1451 NE 155th Ter, North Miami Beach, FL 33162
$-1,948
Cash flow
-14.7%
Cash-on-Cash Return
2.8%
Cap rate
0.4%
Rent to Value Ratio

Active
$498,000
3
bds
|
2
ba
|
1,360
sqft
|
built
1953
1498 NE 178th St, North Miami Beach, FL 33162
$-903
Cash flow
-9.5%
Cash-on-Cash Return
4.0%
Cap rate
0.6%
Rent to Value Ratio
Active
$375,000
2
bds
|
2
ba
|
1,083
sqft
|
built
1971
3660 NE 166th St, North Miami Beach, FL 33160
$-1,328
Cash flow
-18.5%
Cash-on-Cash Return
1.9%
Cap rate
0.7%
Rent to Value Ratio

Active
$275,000
1
bds
|
2
ba
|
886
sqft
|
built
1973
4000 NE 169th St, North Miami Beach, FL 33160
$-434
Cash flow
-8.2%
Cash-on-Cash Return
4.3%
Cap rate
0.8%
Rent to Value Ratio

Active
$225,900
2
bds
|
2
ba
|
1,213
sqft
|
built
1979
17890 W Dixie Hwy, North Miami Beach, FL 33160
$-645
Cash flow
-14.9%
Cash-on-Cash Return
2.7%
Cap rate
1.0%
Rent to Value Ratio

Active
$575,900
2
bds
|
3
ba
|
1,745
sqft
|
built
2010
18427 NE 28th Ave, North Miami Beach, FL 33160
$-1,490
Cash flow
-13.5%
Cash-on-Cash Return
3.0%
Cap rate
0.8%
Rent to Value Ratio

Active
$719,000
3
bds
|
3
ba
|
1,590
sqft
|
built
1980
16449 NE 26th Ave, North Miami Beach, FL 33160
$-2,085
Cash flow
-15.1%
Cash-on-Cash Return
2.7%
Cap rate
0.6%
Rent to Value Ratio

Active
$829,000
4
bds
|
2
ba
|
1,887
sqft
|
built
1964
870 NE 182nd St, North Miami Beach, FL 33162
$-2,061
Cash flow
-13.0%
Cash-on-Cash Return
3.2%
Cap rate
0.6%
Rent to Value Ratio
Active
$210,000
1
bds
|
2
ba
|
930
sqft
|
built
1975
16750 NE 10th Ave, North Miami Beach, FL 33162
$83
Cash flow
2.1%
Cash-on-Cash Return
6.6%
Cap rate
1.0%
Rent to Value Ratio
Active
$1,890,000
4
bds
|
3
ba
|
2,342
sqft
|
built
1956
18560 NE 20th Ct, North Miami Beach, FL 33179
$-5,555
Cash flow
-15.3%
Cash-on-Cash Return
2.6%
Cap rate
0.4%
Rent to Value Ratio

Active
$579,000
4
bds
|
3
ba
|
1,264
sqft
|
built
1952
100 NE 171st Ter, North Miami Beach, FL 33162
$-1,206
Cash flow
-10.9%
Cash-on-Cash Return
3.6%
Cap rate
0.6%
Rent to Value Ratio