North Miami Beach, FL Investment Properties for Sale
Browse homes for sale and investment properties in North Miami Beach, FL. Refine your search by price, property type, or more.
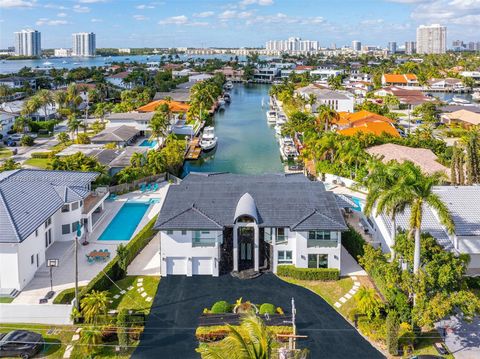
Best cash flowing properties in North Miami Beach, FL
Active
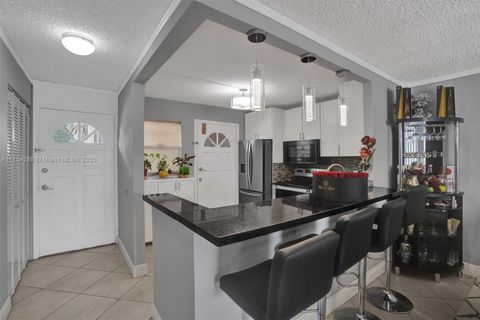
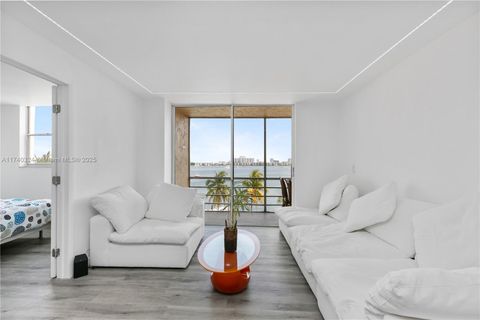
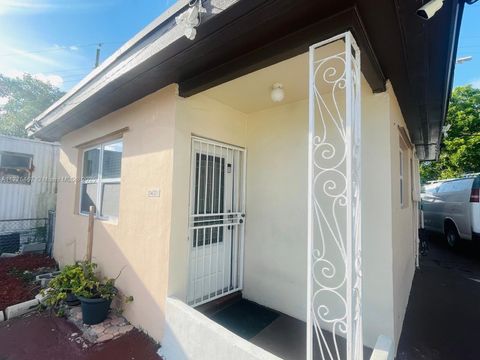
$230,000
2
bds
|
1
ba
|
920
sqft
|
built
1972
1735 NE 164th St, North Miami Beach, FL 33162
$-131
Cash flow
-3.0%
Cash-on-Cash Return
5.5%
Cap rate
1.0%
Rent to Value Ratio
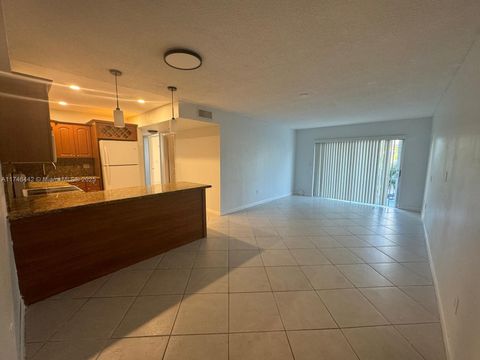
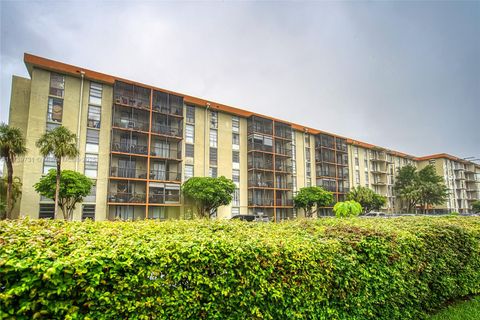
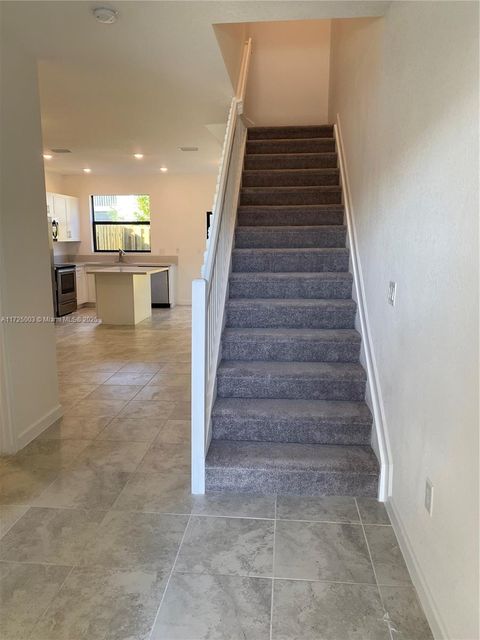
Active
$182,500
1
bds
|
2
ba
|
640
sqft
|
built
1972
2903 NE 163rd St, North Miami Beach, FL 33160
$-277
Cash flow
-7.9%
Cash-on-Cash Return
4.3%
Cap rate
1.1%
Rent to Value Ratio
275 out of 416 properties for sale in North Miami Beach, FL
Limited Results Shown
Create a free account, or log in to reveal all property listings and enjoy the complete experience.
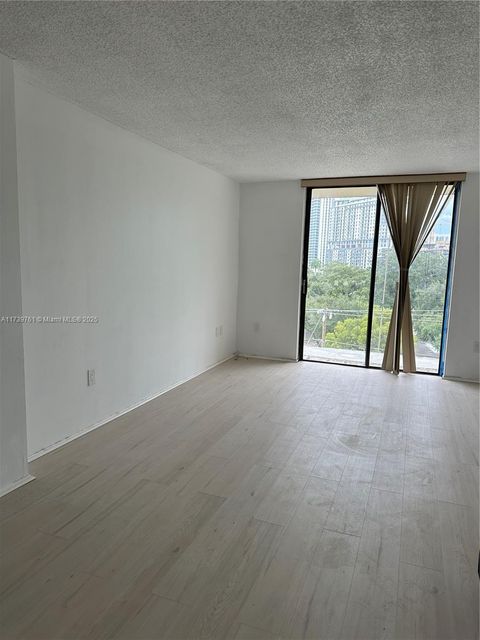
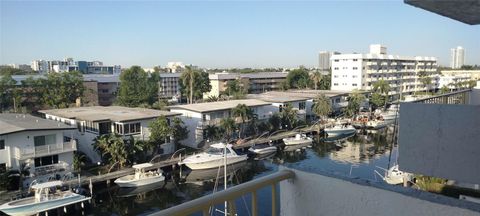
Active
$210,000
1
bds
|
2
ba
|
865
sqft
|
built
1971
3660 NE 166th St, North Miami Beach, FL 33160
$-705
Cash flow
-17.5%
Cash-on-Cash Return
2.1%
Cap rate
1.0%
Rent to Value Ratio
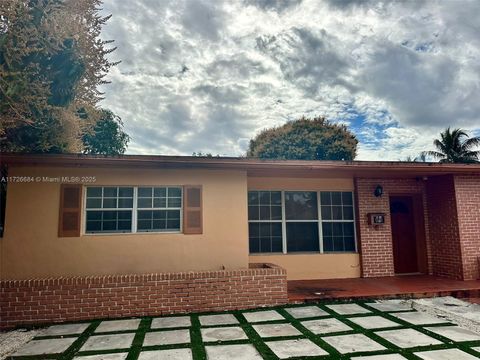
Active
$259,000
2
bds
|
2
ba
|
841
sqft
|
built
1974
3582 NE 171st St, North Miami Beach, FL 33160
$-717
Cash flow
-14.4%
Cash-on-Cash Return
2.8%
Cap rate
0.8%
Rent to Value Ratio

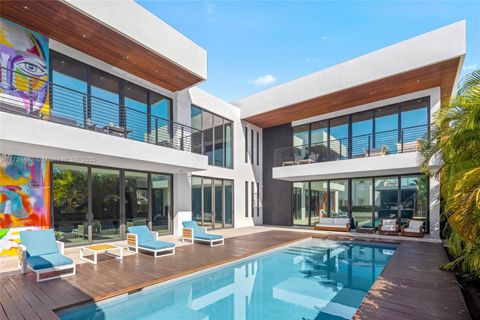
Active
$1,325,000
4
bds
|
2
ba
|
2,412
sqft
|
built
1957
1052 NE 179th Ter, North Miami Beach, FL 33162
$-4,149
Cash flow
-16.3%
Cash-on-Cash Return
2.4%
Cap rate
0.4%
Rent to Value Ratio
Active
$275,000
2
bds
|
2
ba
|
1,110
sqft
|
built
1972
3750 NE 170th St, North Miami Beach, FL 33160
$-521
Cash flow
-9.9%
Cash-on-Cash Return
3.9%
Cap rate
0.9%
Rent to Value Ratio
Active
$182,500
1
bds
|
2
ba
|
640
sqft
|
built
1972
2903 NE 163rd St, North Miami Beach, FL 33160
$-277
Cash flow
-7.9%
Cash-on-Cash Return
4.3%
Cap rate
1.1%
Rent to Value Ratio

Active
$6,000,000
6
bds
|
6
ba
|
4,773
sqft
|
built
1993
3368 NE 169th St, North Miami Beach, FL 33160
$-26,381
Cash flow
-22.9%
Cash-on-Cash Return
0.9%
Cap rate
0.2%
Rent to Value Ratio
Active
$250,000
2
bds
|
2
ba
|
815
sqft
|
built
1974
3642 NE 171st St, North Miami Beach, FL 33160
$-765
Cash flow
-16.0%
Cash-on-Cash Return
2.5%
Cap rate
0.9%
Rent to Value Ratio
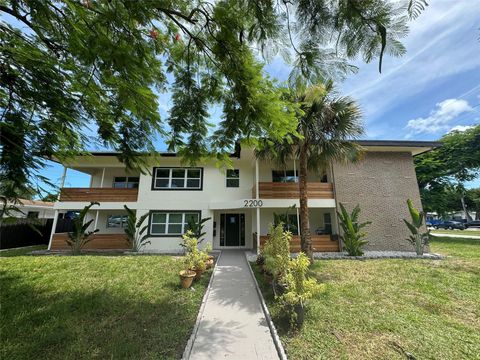
Active
$1,550,000
6
bds
|
0
ba
|
4,173
sqft
|
built
1957
2200 NE 173rd St, North Miami Beach, FL 33160
$-6,805
Cash flow
-22.9%
Cash-on-Cash Return
0.9%
Cap rate
0.2%
Rent to Value Ratio

Active
$229,000
2
bds
|
2
ba
|
1,113
sqft
|
built
1970
2025 NE 164th St, North Miami Beach, FL 33162
$-362
Cash flow
-8.2%
Cash-on-Cash Return
4.2%
Cap rate
1.0%
Rent to Value Ratio
Active
$520,000
3
bds
|
1
ba
|
1,270
sqft
|
built
1953
1431 NE 156th Ter, North Miami Beach, FL 33162
$-939
Cash flow
-9.4%
Cash-on-Cash Return
4.0%
Cap rate
0.6%
Rent to Value Ratio
Active
$5,995,000
5
bds
|
4
ba
|
4,416
sqft
|
built
1998
3251 NE 164th St, North Miami Beach, FL 33160
$-28,552
Cash flow
-24.8%
Cash-on-Cash Return
0.4%
Cap rate
0.2%
Rent to Value Ratio
Active
$305,000
3
bds
|
2
ba
|
1,652
sqft
|
built
1980
17890 W Dixie Hwy, North Miami Beach, FL 33160
$-984
Cash flow
-16.8%
Cash-on-Cash Return
2.3%
Cap rate
0.9%
Rent to Value Ratio
Active
$525,000
3
bds
|
2
ba
|
1,148
sqft
|
built
1954
561 NE 173rd St, North Miami Beach, FL 33162
$-842
Cash flow
-8.4%
Cash-on-Cash Return
4.2%
Cap rate
0.7%
Rent to Value Ratio
Active
$525,000
3
bds
|
2
ba
|
660
sqft
|
built
1952
2381 NE 137th St, North Miami Beach, FL 33181
$-1,493
Cash flow
-14.8%
Cash-on-Cash Return
2.7%
Cap rate
0.4%
Rent to Value Ratio
Active
$280,000
2
bds
|
2
ba
|
1,052
sqft
|
built
1973
2821 NE 163rd St, North Miami Beach, FL 33160
$-369
Cash flow
-6.9%
Cash-on-Cash Return
4.6%
Cap rate
1.0%
Rent to Value Ratio
Active
$160,000
1
bds
|
1
ba
|
728
sqft
|
built
1973
16851 NE 23rd Ave, North Miami Beach, FL 33160
$-398
Cash flow
-13.0%
Cash-on-Cash Return
3.2%
Cap rate
1.0%
Rent to Value Ratio
Active
$235,000
2
bds
|
2
ba
|
1,020
sqft
|
built
1973
16851 NE 23rd Ave, North Miami Beach, FL 33160
$-507
Cash flow
-11.3%
Cash-on-Cash Return
3.6%
Cap rate
1.0%
Rent to Value Ratio

Active
$550,000
3
bds
|
2
ba
|
1,435
sqft
|
built
1952
16234 NE 9th Ct, North Miami Beach, FL 33162
$-982
Cash flow
-9.3%
Cash-on-Cash Return
4.0%
Cap rate
0.6%
Rent to Value Ratio
Active
$6,000,000
6
bds
|
8
ba
|
5,278
sqft
|
built
2017
3462 NE 171st St, North Miami Beach, FL 33160
$-32,325
Cash flow
-28.1%
Cash-on-Cash Return
-0.3%
Cap rate
0.2%
Rent to Value Ratio
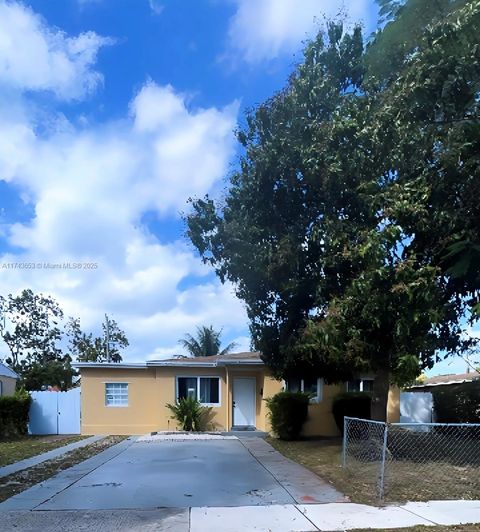
Active
$545,000
3
bds
|
1
ba
|
936
sqft
|
built
1952
1801 NE 175th St, North Miami Beach, FL 33162
$-719
Cash flow
-6.9%
Cash-on-Cash Return
4.6%
Cap rate
0.7%
Rent to Value Ratio

Active
$499,000
3
bds
|
1
ba
|
1,042
sqft
|
built
1952
981 NE 159th St, North Miami Beach, FL 33162
$-1,276
Cash flow
-13.3%
Cash-on-Cash Return
3.1%
Cap rate
0.6%
Rent to Value Ratio

Active
$225,000
2
bds
|
2
ba
|
1,040
sqft
|
built
1973
16950 W Dixie Hwy, North Miami Beach, FL 33160
$-25,491
Cash flow
-591.1%
Cash-on-Cash Return
-129.8%
Cap rate
1.0%
Rent to Value Ratio
Active
$3,100,000
5
bds
|
4
ba
|
3,250
sqft
|
built
1957
2091 NE 191st Dr, North Miami Beach, FL 33179
$-10,003
Cash flow
-16.8%
Cash-on-Cash Return
2.3%
Cap rate
0.4%
Rent to Value Ratio
Active
$374,900
3
bds
|
2
ba
|
1,652
sqft
|
built
1980
17890 W Dixie Hwy, North Miami Beach, FL 33160
$-946
Cash flow
-13.2%
Cash-on-Cash Return
3.1%
Cap rate
0.8%
Rent to Value Ratio
Active
$389,999
3
bds
|
3
ba
|
1,182
sqft
|
built
2006
2196 NE 167th St, North Miami Beach, FL 33162
$-842
Cash flow
-11.3%
Cash-on-Cash Return
3.6%
Cap rate
0.8%
Rent to Value Ratio
Active
$789,000
2
bds
|
0
ba
|
1,500
sqft
|
built
1956
1788 NE 169th St, North Miami Beach, FL 33162
$-2,821
Cash flow
-18.7%
Cash-on-Cash Return
1.9%
Cap rate
0.4%
Rent to Value Ratio
Active
$375,000
3
bds
|
3
ba
|
1,380
sqft
|
built
1990
2050 NE 140th St, North Miami Beach, FL 33181
$-861
Cash flow
-12.0%
Cash-on-Cash Return
3.4%
Cap rate
0.8%
Rent to Value Ratio

Active
$628,000
3
bds
|
2
ba
|
1,519
sqft
|
built
1954
701 NE 170th St, North Miami Beach, FL 33162
$-851
Cash flow
-7.1%
Cash-on-Cash Return
4.5%
Cap rate
0.6%
Rent to Value Ratio
Active
$209,900
1
bds
|
2
ba
|
712
sqft
|
built
1971
3716 NE 168th St, North Miami Beach, FL 33160
$-789
Cash flow
-19.6%
Cash-on-Cash Return
1.6%
Cap rate
1.0%
Rent to Value Ratio
Active
$750,000
2
bds
|
1
ba
|
880
sqft
|
built
1956
1223 NE 181st St, North Miami Beach, FL 33162
$-2,128
Cash flow
-14.8%
Cash-on-Cash Return
2.7%
Cap rate
0.4%
Rent to Value Ratio

Active
$2,098,000
4
bds
|
0
ba
|
3,361
sqft
|
built
1959
3767 NE 168th St, North Miami Beach, FL 33160
$-8,441
Cash flow
-21.0%
Cash-on-Cash Return
1.3%
Cap rate
0.2%
Rent to Value Ratio
Active
$250,000
1
bds
|
1
ba
|
456
sqft
|
built
1959
2421 NE 135th Ln, North Miami Beach, FL 33181
$-388
Cash flow
-8.1%
Cash-on-Cash Return
4.3%
Cap rate
0.6%
Rent to Value Ratio
Active
$465,000
3
bds
|
3
ba
|
1,320
sqft
|
built
2019
383 NE 208th Ter, North Miami Beach, FL 33179
$-1,321
Cash flow
-14.8%
Cash-on-Cash Return
2.7%
Cap rate
0.7%
Rent to Value Ratio
Active
$389,000
2
bds
|
2
ba
|
1,300
sqft
|
built
1974
3770 NE 171st St, North Miami Beach, FL 33160
$-1,043
Cash flow
-14.0%
Cash-on-Cash Return
2.9%
Cap rate
0.7%
Rent to Value Ratio

Active
$425,000
2
bds
|
2
ba
|
1,085
sqft
|
built
1974
4000 NE 170th St, North Miami Beach, FL 33160
$-1,401
Cash flow
-17.2%
Cash-on-Cash Return
2.2%
Cap rate
0.7%
Rent to Value Ratio

Active
$450,000
2
bds
|
3
ba
|
1,200
sqft
|
built
1972
3862 NE 171st St, North Miami Beach, FL 33160
$-1,682
Cash flow
-19.5%
Cash-on-Cash Return
1.7%
Cap rate
0.7%
Rent to Value Ratio
Active
$977,770
3
bds
|
2
ba
|
2,252
sqft
|
built
1957
1020 NE 179th St, North Miami Beach, FL 33162
$-2,519
Cash flow
-13.4%
Cash-on-Cash Return
3.1%
Cap rate
0.4%
Rent to Value Ratio
Active
$299,000
2
bds
|
2
ba
|
962
sqft
|
built
1972
3522 NE 171st St, North Miami Beach, FL 33160
$-653
Cash flow
-11.4%
Cash-on-Cash Return
3.5%
Cap rate
0.8%
Rent to Value Ratio
Active
$230,000
2
bds
|
1
ba
|
920
sqft
|
built
1972
1735 NE 164th St, North Miami Beach, FL 33162
$-131
Cash flow
-3.0%
Cash-on-Cash Return
5.5%
Cap rate
1.0%
Rent to Value Ratio
Active
$3,750,000
4
bds
|
3
ba
|
2,723
sqft
|
built
1981
16650 NE 35th Ave, North Miami Beach, FL 33160
$-16,869
Cash flow
-23.5%
Cash-on-Cash Return
0.7%
Cap rate
0.3%
Rent to Value Ratio