Clark County Investment Properties for Sale
Browse homes for sale and investment properties in Clark County. Refine your search by price, property type, or more.
Best cash flowing properties in Clark County

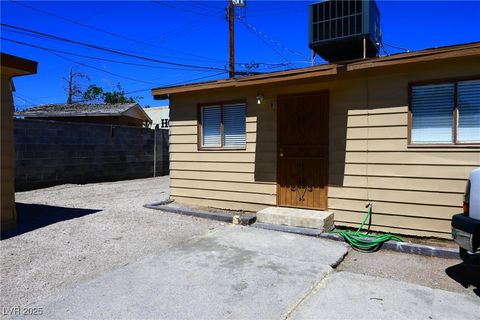
Active
$215,000
2
bds
|
2
ba
|
1,080
sqft
|
built
1983
5240 Janfred Ct, Las Vegas, NV 89103
$-252
Cash flow
-6.1%
Cash-on-Cash Return
4.3%
Cap rate
0.7%
Rent to Value Ratio
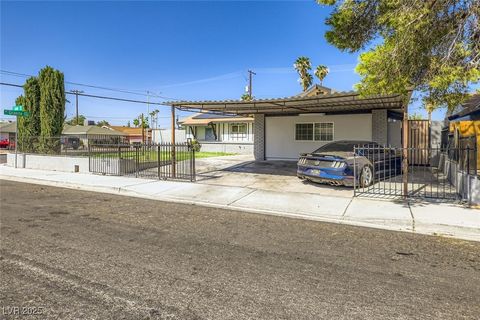
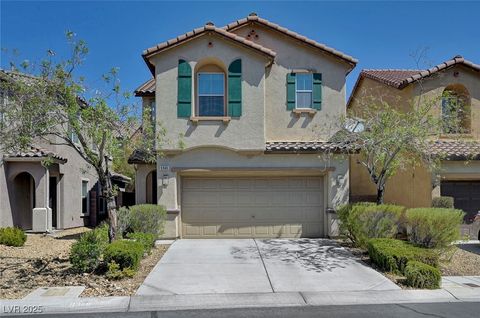
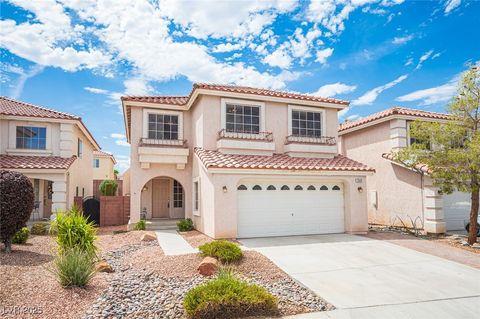
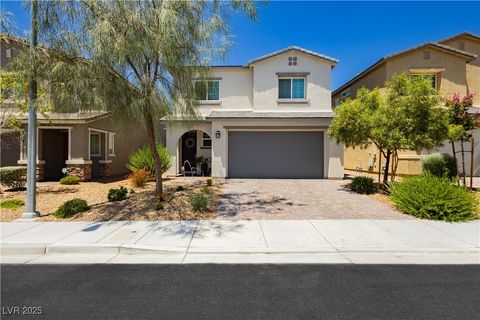
Active
$385,000
3
bds
|
3
ba
|
1,430
sqft
|
built
2007
10557 Shiny Skies Dr, Las Vegas, NV 89129
$-450
Cash flow
-6.1%
Cash-on-Cash Return
4.3%
Cap rate
0.6%
Rent to Value Ratio
7,842 out of 8,161 properties for sale in Clark County
Limited Results Shown
Create a free account, or log in to reveal all property listings and enjoy the complete experience.
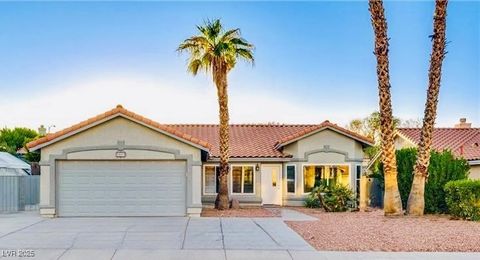
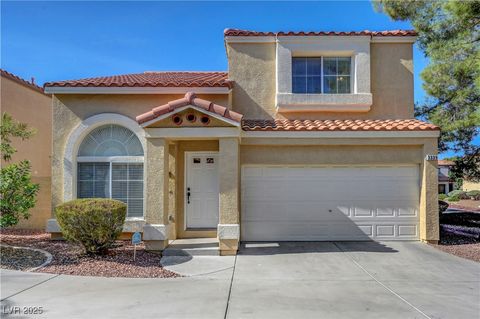
Active
$2,099,999
4
bds
|
3
ba
|
3,591
sqft
|
built
2023
2669 Pioneer Estates Ct, Las Vegas, NV 89117
$-4,083
Cash flow
-10.1%
Cash-on-Cash Return
3.3%
Cap rate
0.5%
Rent to Value Ratio
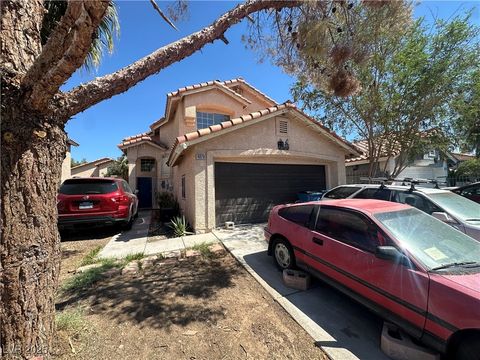
Active
$360,000
3
bds
|
3
ba
|
1,597
sqft
|
built
2010
3784 Nerine Pass Way, North Las Vegas, NV 89032
$-660
Cash flow
-9.6%
Cash-on-Cash Return
3.5%
Cap rate
0.5%
Rent to Value Ratio
Active
$424,900
3
bds
|
2
ba
|
1,638
sqft
|
built
1979
5881 Arandas Ct, Las Vegas, NV 89103
$-767
Cash flow
-9.4%
Cash-on-Cash Return
3.5%
Cap rate
0.5%
Rent to Value Ratio
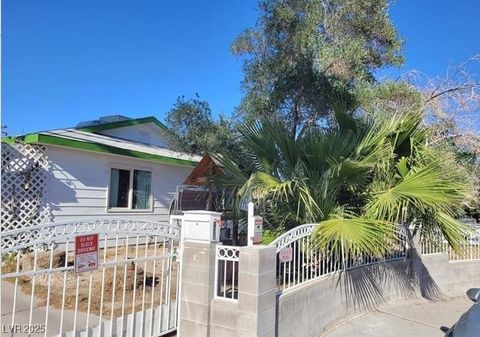
Active
$465,000
2
bds
|
0
ba
|
2,160
sqft
|
built
1952
1610 Marlin Ave, Las Vegas, NV 89101
$-1,659
Cash flow
-18.6%
Cash-on-Cash Return
1.4%
Cap rate
0.2%
Rent to Value Ratio
Active
$410,000
4
bds
|
3
ba
|
1,707
sqft
|
built
1964
35 Jade Cir, Las Vegas, NV 89106
$-461
Cash flow
-5.9%
Cash-on-Cash Return
4.3%
Cap rate
0.6%
Rent to Value Ratio
Active
$599,000
3
bds
|
2
ba
|
1,596
sqft
|
built
1994
7857 Cliffs Edge Cir, Las Vegas, NV 89123
$-1,107
Cash flow
-9.6%
Cash-on-Cash Return
3.5%
Cap rate
0.5%
Rent to Value Ratio
Active
$365,000
3
bds
|
2
ba
|
1,630
sqft
|
built
1995
4028 Red Pony Ct, Las Vegas, NV 89110
$-703
Cash flow
-10.0%
Cash-on-Cash Return
3.4%
Cap rate
0.5%
Rent to Value Ratio
Active
$624,900
4
bds
|
2
ba
|
1,858
sqft
|
built
1977
1527 Irene Dr, Boulder City, NV 89005
$-1,419
Cash flow
-11.8%
Cash-on-Cash Return
3.0%
Cap rate
0.4%
Rent to Value Ratio
Active
$380,000
3
bds
|
3
ba
|
1,989
sqft
|
built
1993
1840 Camino Carlos Rey, North Las Vegas, NV 89031
$-489
Cash flow
-6.7%
Cash-on-Cash Return
4.1%
Cap rate
0.6%
Rent to Value Ratio
Active
$1,450,000
5
bds
|
5
ba
|
4,861
sqft
|
built
2007
7277 Sashaying Spirit Ct, Las Vegas, NV 89131
$-1,942
Cash flow
-7.0%
Cash-on-Cash Return
4.1%
Cap rate
0.6%
Rent to Value Ratio
Active
$2,295,000
2
bds
|
4
ba
|
5,239
sqft
|
built
1996
20 Wild Dunes Ct, Las Vegas, NV 89113
$-9,182
Cash flow
-20.9%
Cash-on-Cash Return
0.9%
Cap rate
0.2%
Rent to Value Ratio
Active
$369,900
3
bds
|
3
ba
|
1,602
sqft
|
built
2005
5593 Gold Mint Ln, Las Vegas, NV 89122
$-734
Cash flow
-10.4%
Cash-on-Cash Return
3.3%
Cap rate
0.5%
Rent to Value Ratio
Active
$439,998
3
bds
|
3
ba
|
1,668
sqft
|
built
2009
9346 Shawnee Mission Ave, Las Vegas, NV 89178
$-975
Cash flow
-11.6%
Cash-on-Cash Return
3.0%
Cap rate
0.4%
Rent to Value Ratio
Active
$375,000
2
bds
|
3
ba
|
1,458
sqft
|
built
2000
9901 Trailwood Dr, Las Vegas, NV 89134
$-1,048
Cash flow
-14.6%
Cash-on-Cash Return
2.3%
Cap rate
0.5%
Rent to Value Ratio
Active
$500,000
4
bds
|
2
ba
|
2,035
sqft
|
built
1993
2811 Via Terra St, Henderson, NV 89074
$-879
Cash flow
-9.2%
Cash-on-Cash Return
3.6%
Cap rate
0.5%
Rent to Value Ratio
Active
$390,000
3
bds
|
3
ba
|
1,558
sqft
|
built
1987
7742 Selby Ct, Las Vegas, NV 89147
$-622
Cash flow
-8.3%
Cash-on-Cash Return
3.8%
Cap rate
0.5%
Rent to Value Ratio
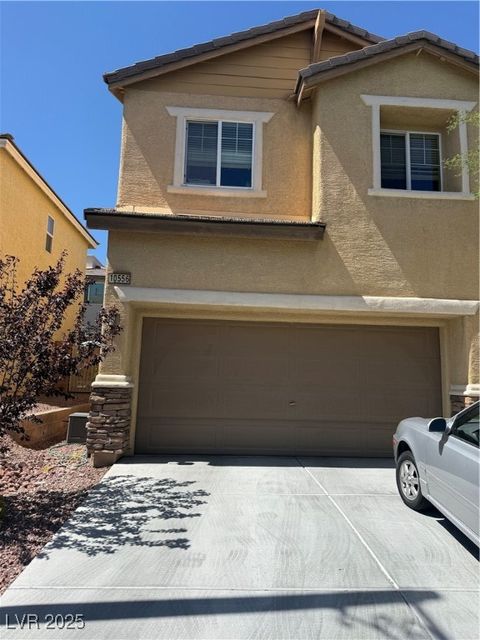
Active
$460,000
4
bds
|
3
ba
|
1,919
sqft
|
built
2010
10556 Bandera Mountain Ln, Las Vegas, NV 89166
$-1,210
Cash flow
-13.7%
Cash-on-Cash Return
2.5%
Cap rate
0.4%
Rent to Value Ratio
Active
$423,500
3
bds
|
3
ba
|
2,197
sqft
|
built
2008
5505 Moss Landing St, North Las Vegas, NV 89031
$-726
Cash flow
-8.9%
Cash-on-Cash Return
3.6%
Cap rate
0.5%
Rent to Value Ratio

Active
$1,195,000
5
bds
|
6
ba
|
5,781
sqft
|
built
2000
8301 Broad Peak Dr, Las Vegas, NV 89131
$-1,938
Cash flow
-8.5%
Cash-on-Cash Return
3.7%
Cap rate
0.5%
Rent to Value Ratio
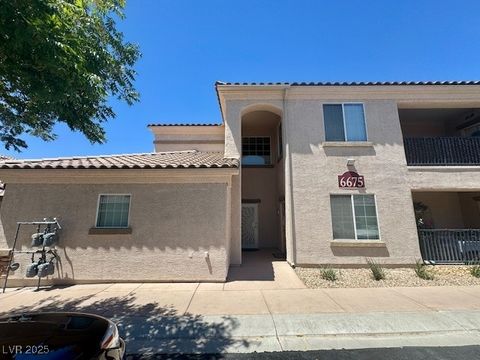
Active
$309,900
3
bds
|
2
ba
|
1,454
sqft
|
built
2006
6675 Caporetto Ln, North Las Vegas, NV 89084
$-494
Cash flow
-8.3%
Cash-on-Cash Return
3.8%
Cap rate
0.6%
Rent to Value Ratio
Active
$1,549,000
4
bds
|
4
ba
|
3,270
sqft
|
built
2017
10313 Jade Point Dr, Las Vegas, NV 89135
$-2,807
Cash flow
-9.5%
Cash-on-Cash Return
3.5%
Cap rate
0.5%
Rent to Value Ratio
Active
$369,900
3
bds
|
2
ba
|
1,356
sqft
|
built
1997
2050 W Warm Springs Rd, Henderson, NV 89014
$-941
Cash flow
-13.3%
Cash-on-Cash Return
2.6%
Cap rate
0.5%
Rent to Value Ratio
Active
$250,000
2
bds
|
2
ba
|
1,428
sqft
|
built
1997
6201 E Lake Mead Blvd, Las Vegas, NV 89156
$-535
Cash flow
-11.2%
Cash-on-Cash Return
3.1%
Cap rate
0.6%
Rent to Value Ratio
Active
$360,000
2
bds
|
1
ba
|
693
sqft
|
built
1961
3968 Mont Blanc Way, Mount Charleston, NV 89124
$-517
Cash flow
-7.5%
Cash-on-Cash Return
4.0%
Cap rate
0.5%
Rent to Value Ratio
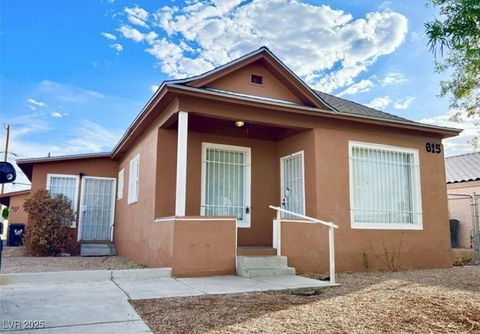
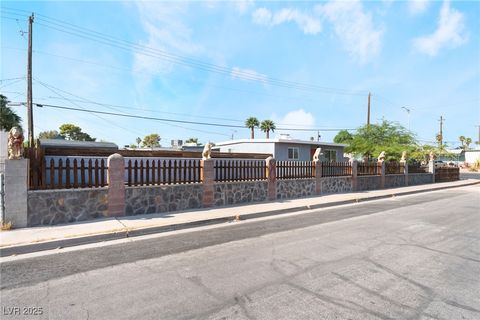
Active
$650,000
3
bds
|
0
ba
|
2,680
sqft
|
built
1942
615 Harrison Ave, Las Vegas, NV 89106
$-2,042
Cash flow
-16.4%
Cash-on-Cash Return
1.9%
Cap rate
0.2%
Rent to Value Ratio
Active
$720,000
5
bds
|
3
ba
|
2,637
sqft
|
built
2003
7870 Midnight Ride St, Las Vegas, NV 89131
$-1,761
Cash flow
-12.8%
Cash-on-Cash Return
2.7%
Cap rate
0.4%
Rent to Value Ratio
Active
$389,900
2
bds
|
2
ba
|
1,385
sqft
|
built
2007
6310 Aspen Mountain Ave, Las Vegas, NV 89141
$-838
Cash flow
-11.2%
Cash-on-Cash Return
3.1%
Cap rate
0.5%
Rent to Value Ratio
Active
$800,000
5
bds
|
3
ba
|
3,018
sqft
|
built
1997
2870 Maverick St, Las Vegas, NV 89108
$-1,384
Cash flow
-9.0%
Cash-on-Cash Return
3.6%
Cap rate
0.5%
Rent to Value Ratio
Active
$1,695,500
4
bds
|
6
ba
|
5,357
sqft
|
built
2007
1169 Calle De Luz, Henderson, NV 89012
$-1,781
Cash flow
-5.5%
Cash-on-Cash Return
4.4%
Cap rate
0.6%
Rent to Value Ratio
Active
$474,900
4
bds
|
3
ba
|
1,972
sqft
|
built
2004
7549 Mermaid Song Ct, Las Vegas, NV 89139
$-976
Cash flow
-10.7%
Cash-on-Cash Return
3.2%
Cap rate
0.5%
Rent to Value Ratio
Active
$350,000
3
bds
|
2
ba
|
1,088
sqft
|
built
1971
4674 Petaluma Cir, Las Vegas, NV 89120
$-472
Cash flow
-7.0%
Cash-on-Cash Return
4.1%
Cap rate
0.5%
Rent to Value Ratio
Active
$334,999
3
bds
|
1
ba
|
1,028
sqft
|
built
1953
1333 Eastwood Dr, Las Vegas, NV 89104
$-615
Cash flow
-9.6%
Cash-on-Cash Return
3.5%
Cap rate
0.4%
Rent to Value Ratio
Active
$382,000
3
bds
|
3
ba
|
1,347
sqft
|
built
1996
3339 Epson St, Las Vegas, NV 89129
$-878
Cash flow
-12.0%
Cash-on-Cash Return
2.9%
Cap rate
0.5%
Rent to Value Ratio
Active
$925,000
4
bds
|
3
ba
|
3,475
sqft
|
built
1998
4514 Blue Mesa Way, Las Vegas, NV 89129
$-1,473
Cash flow
-8.3%
Cash-on-Cash Return
3.8%
Cap rate
0.5%
Rent to Value Ratio
Active
$425,000
3
bds
|
3
ba
|
1,893
sqft
|
built
2021
7025 Nash Tracks St, North Las Vegas, NV 89084
$-1,031
Cash flow
-12.7%
Cash-on-Cash Return
2.8%
Cap rate
0.5%
Rent to Value Ratio
Active
$425,000
3
bds
|
2
ba
|
1,381
sqft
|
built
2001
3021 Robincrest Ct, North Las Vegas, NV 89031
$-894
Cash flow
-11.0%
Cash-on-Cash Return
3.2%
Cap rate
0.4%
Rent to Value Ratio
Active
$688,888
3
bds
|
3
ba
|
2,667
sqft
|
built
2005
8321 Bay Dunes St, Las Vegas, NV 89131
$-1,601
Cash flow
-12.1%
Cash-on-Cash Return
2.9%
Cap rate
0.5%
Rent to Value Ratio
Active
$445,000
3
bds
|
2
ba
|
1,752
sqft
|
built
2006
9327 Oxbow Lake Ave, Las Vegas, NV 89149
$-869
Cash flow
-10.2%
Cash-on-Cash Return
3.3%
Cap rate
0.5%
Rent to Value Ratio