Nevada Investment Properties for Sale
Browse homes for sale and investment properties in Nevada. Refine your search by price, property type, or more.
Best cash flowing properties in Nevada
Active
$130,000
1
bds
|
1
ba
|
675
sqft
|
built
1996
1830 N Pecos Rd, Las Vegas, NV 89115
$-290
Cash flow
-11.6%
Cash-on-Cash Return
3.6%
Cap rate
0.8%
Rent to Value Ratio
Active
$200,000
2
bds
|
2
ba
|
912
sqft
|
built
1987
1220 Observation Dr, Las Vegas, NV 89128
$-318
Cash flow
-8.3%
Cash-on-Cash Return
4.4%
Cap rate
0.8%
Rent to Value Ratio
8,711 out of 9,115 properties for sale in Nevada
Limited Results Shown
Create a free account, or log in to reveal all property listings and enjoy the complete experience.
Active
$774,900
4
bds
|
4
ba
|
3,289
sqft
|
built
2020
6821 Empire Cliff St, North Las Vegas, NV 89084
$-2,444
Cash flow
-16.5%
Cash-on-Cash Return
2.5%
Cap rate
0.4%
Rent to Value Ratio

Active
$339,000
3
bds
|
3
ba
|
1,512
sqft
|
built
2006
3728 Juanita May Ave, North Las Vegas, NV 89032
$-654
Cash flow
-10.1%
Cash-on-Cash Return
4.0%
Cap rate
0.6%
Rent to Value Ratio
Active
$369,500
3
bds
|
3
ba
|
1,510
sqft
|
built
2019
5392 Blustery Towns Ave, Las Vegas, NV 89118
$-943
Cash flow
-13.3%
Cash-on-Cash Return
3.2%
Cap rate
0.5%
Rent to Value Ratio
Active
$190,000
2
bds
|
2
ba
|
976
sqft
|
built
1998
3318 N Decatur Blvd, Las Vegas, NV 89130
$-574
Cash flow
-15.8%
Cash-on-Cash Return
2.6%
Cap rate
0.7%
Rent to Value Ratio

Active
$399,900
2
bds
|
2
ba
|
1,398
sqft
|
built
1987
1747 Angel Falls St, Las Vegas, NV 89142
$-1,205
Cash flow
-15.7%
Cash-on-Cash Return
2.6%
Cap rate
0.4%
Rent to Value Ratio
Active
$360,000
3
bds
|
3
ba
|
1,512
sqft
|
built
2008
2130 Trebbiano Way, Las Vegas, NV 89156
$-682
Cash flow
-9.9%
Cash-on-Cash Return
4.0%
Cap rate
0.6%
Rent to Value Ratio

Active
$439,999
3
bds
|
3
ba
|
2,066
sqft
|
built
2005
8205 Celina Hills St, Las Vegas, NV 89131
$-1,222
Cash flow
-14.5%
Cash-on-Cash Return
2.9%
Cap rate
0.5%
Rent to Value Ratio
Active
$959,900
4
bds
|
3
ba
|
2,281
sqft
|
built
2022
93 Reverie Heights Ave, Henderson, NV 89011
$-2,084
Cash flow
-11.3%
Cash-on-Cash Return
3.7%
Cap rate
0.6%
Rent to Value Ratio
Active
$279,000
1
bds
|
1
ba
|
615
sqft
|
built
2006
4381 W Flamingo Rd, Las Vegas, NV 89103
$-879
Cash flow
-16.4%
Cash-on-Cash Return
2.5%
Cap rate
0.8%
Rent to Value Ratio
Active
$439,900
3
bds
|
3
ba
|
1,736
sqft
|
built
2020
3270 Palindrome Ave, Henderson, NV 89044
$-1,191
Cash flow
-14.1%
Cash-on-Cash Return
3.0%
Cap rate
0.5%
Rent to Value Ratio

Active
$730,000
5
bds
|
3
ba
|
3,063
sqft
|
built
2020
2629 Monte Cevedale Ave, Henderson, NV 89044
$-2,182
Cash flow
-15.6%
Cash-on-Cash Return
2.7%
Cap rate
0.4%
Rent to Value Ratio
Active
$552,000
3
bds
|
3
ba
|
2,000
sqft
|
built
2006
9987 Shiloh Heights St, Las Vegas, NV 89178
$-1,704
Cash flow
-16.1%
Cash-on-Cash Return
2.6%
Cap rate
0.4%
Rent to Value Ratio
Active
$429,999
4
bds
|
3
ba
|
1,896
sqft
|
built
2022
6963 Stone Cactus St, North Las Vegas, NV 89086
$-944
Cash flow
-11.5%
Cash-on-Cash Return
3.6%
Cap rate
0.6%
Rent to Value Ratio
Active
$760,000
3
bds
|
3
ba
|
2,151
sqft
|
built
2022
12 Tatahatso Point St, Henderson, NV 89011
$-2,805
Cash flow
-19.3%
Cash-on-Cash Return
1.8%
Cap rate
0.4%
Rent to Value Ratio
Active
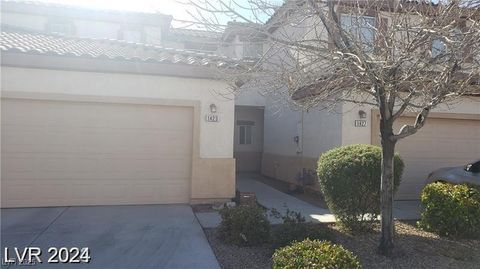
$464,900
3
bds
|
3
ba
|
1,972
sqft
|
built
2006
1423 Orange Jubilee Rd, Henderson, NV 89014
$-1,332
Cash flow
-14.9%
Cash-on-Cash Return
2.8%
Cap rate
0.4%
Rent to Value Ratio
Active
$359,900
3
bds
|
2
ba
|
1,378
sqft
|
built
1998
108 Zenith Point Ave, North Las Vegas, NV 89032
$-854
Cash flow
-12.4%
Cash-on-Cash Return
3.4%
Cap rate
0.5%
Rent to Value Ratio
Active
$369,999
4
bds
|
2
ba
|
1,302
sqft
|
built
1979
2318 El Molino Cir, Las Vegas, NV 89108
$-830
Cash flow
-11.7%
Cash-on-Cash Return
3.6%
Cap rate
0.5%
Rent to Value Ratio
Active
$460,000
3
bds
|
3
ba
|
1,764
sqft
|
built
2012
3839 Zodiacal Light St, Las Vegas, NV 89129
$-913
Cash flow
-10.4%
Cash-on-Cash Return
3.9%
Cap rate
0.5%
Rent to Value Ratio
Active
$498,000
4
bds
|
3
ba
|
2,118
sqft
|
built
1987
9529 Shallow Brook Cir, Las Vegas, NV 89117
$-1,155
Cash flow
-12.1%
Cash-on-Cash Return
3.5%
Cap rate
0.5%
Rent to Value Ratio
Active
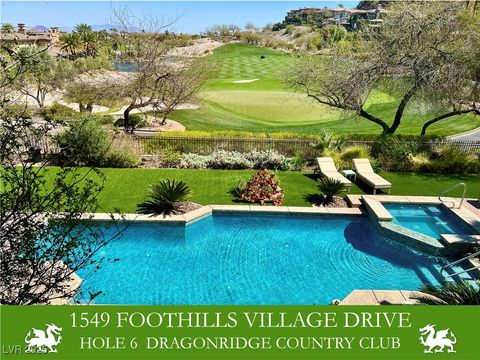
$3,299,999
5
bds
|
6
ba
|
5,514
sqft
|
built
2002
1549 Foothills Village Dr, Henderson, NV 89012
$-10,577
Cash flow
-16.7%
Cash-on-Cash Return
2.4%
Cap rate
0.3%
Rent to Value Ratio
Active
$540,000
3
bds
|
2
ba
|
1,889
sqft
|
built
1991
7405 Blue Sage Ct, Las Vegas, NV 89129
$-1,276
Cash flow
-12.3%
Cash-on-Cash Return
3.4%
Cap rate
0.5%
Rent to Value Ratio
Active
$499,750
4
bds
|
3
ba
|
1,872
sqft
|
built
2024
6611 Dove Point Pl, Las Vegas, NV 89130
$-1,519
Cash flow
-15.9%
Cash-on-Cash Return
2.6%
Cap rate
0.5%
Rent to Value Ratio

Active
$825,000
5
bds
|
4
ba
|
2,944
sqft
|
built
2023
10140 Magnolia Creek St, Las Vegas, NV 89141
$-2,746
Cash flow
-17.4%
Cash-on-Cash Return
2.3%
Cap rate
0.4%
Rent to Value Ratio

Active
$265,000
2
bds
|
3
ba
|
1,242
sqft
|
built
1990
101 Luna Way, Las Vegas, NV 89145
$-721
Cash flow
-14.2%
Cash-on-Cash Return
3.0%
Cap rate
0.6%
Rent to Value Ratio

Active
$445,000
3
bds
|
3
ba
|
1,771
sqft
|
built
2023
236 Callen Falls Ave, Henderson, NV 89011
$-1,284
Cash flow
-15.1%
Cash-on-Cash Return
2.8%
Cap rate
0.5%
Rent to Value Ratio
Active
$200,000
2
bds
|
2
ba
|
912
sqft
|
built
1987
1220 Observation Dr, Las Vegas, NV 89128
$-318
Cash flow
-8.3%
Cash-on-Cash Return
4.4%
Cap rate
0.8%
Rent to Value Ratio

Active
$535,990
4
bds
|
3
ba
|
2,095
sqft
|
built
2023
10273 Fragrant Apple Ct, Las Vegas, NV 89141
$-1,718
Cash flow
-16.7%
Cash-on-Cash Return
2.4%
Cap rate
0.4%
Rent to Value Ratio
Active
$130,000
1
bds
|
1
ba
|
675
sqft
|
built
1996
1830 N Pecos Rd, Las Vegas, NV 89115
$-290
Cash flow
-11.6%
Cash-on-Cash Return
3.6%
Cap rate
0.8%
Rent to Value Ratio

Active
$170,000
1
bds
|
1
ba
|
695
sqft
|
built
1998
5710 E Tropicana Ave, Las Vegas, NV 89122
$-425
Cash flow
-13.0%
Cash-on-Cash Return
3.3%
Cap rate
0.6%
Rent to Value Ratio
Active
$325,000
2
bds
|
2
ba
|
974
sqft
|
built
1992
230 E Flamingo Rd, Las Vegas, NV 89169
$-1,015
Cash flow
-16.3%
Cash-on-Cash Return
2.5%
Cap rate
0.6%
Rent to Value Ratio
Active
$525,000
1
bds
|
2
ba
|
1,220
sqft
|
built
2006
4381 W Flamingo Rd, Las Vegas, NV 89103
$-3,360
Cash flow
-33.4%
Cash-on-Cash Return
-1.4%
Cap rate
0.6%
Rent to Value Ratio
Active
$1,125,000
2
bds
|
2
ba
|
1,652
sqft
|
built
2007
4471 Dean Martin Dr, Las Vegas, NV 89103
$-3,879
Cash flow
-18.0%
Cash-on-Cash Return
2.1%
Cap rate
0.5%
Rent to Value Ratio
Active
$890,000
3
bds
|
4
ba
|
2,352
sqft
|
built
1988
9865 Penny Ln, Las Vegas, NV 89178
$-2,516
Cash flow
-14.7%
Cash-on-Cash Return
2.9%
Cap rate
0.4%
Rent to Value Ratio

Active
$535,000
4
bds
|
3
ba
|
3,159
sqft
|
built
2008
5937 Armide St, North Las Vegas, NV 89081
$-1,095
Cash flow
-10.7%
Cash-on-Cash Return
3.8%
Cap rate
0.5%
Rent to Value Ratio

Active
$259,888
2
bds
|
2
ba
|
1,410
sqft
|
built
2006
5855 Valley Dr, North Las Vegas, NV 89031
$-464
Cash flow
-9.3%
Cash-on-Cash Return
4.1%
Cap rate
0.7%
Rent to Value Ratio
Active
$285,000
2
bds
|
2
ba
|
1,120
sqft
|
built
2005
9303 Gilcrease Ave, Las Vegas, NV 89149
$-662
Cash flow
-12.1%
Cash-on-Cash Return
3.5%
Cap rate
0.6%
Rent to Value Ratio

Active
$364,900
2
bds
|
3
ba
|
1,422
sqft
|
built
2004
978 Valetta Flat Ave, Las Vegas, NV 89183
$-890
Cash flow
-12.7%
Cash-on-Cash Return
3.3%
Cap rate
0.5%
Rent to Value Ratio
Active
$429,000
3
bds
|
3
ba
|
1,935
sqft
|
built
2005
9190 Wine Cellar Ave, Las Vegas, NV 89148
$-888
Cash flow
-10.8%
Cash-on-Cash Return
3.8%
Cap rate
0.5%
Rent to Value Ratio
Active
$545,000
4
bds
|
3
ba
|
2,431
sqft
|
built
2023
4448 Mahogany Hills Ave, Las Vegas, NV 89141
$-1,553
Cash flow
-14.9%
Cash-on-Cash Return
2.8%
Cap rate
0.5%
Rent to Value Ratio
Active
$374,999
3
bds
|
3
ba
|
1,278
sqft
|
built
2006
9527 Havasu Canyon Ave, Las Vegas, NV 89166
$-908
Cash flow
-12.6%
Cash-on-Cash Return
3.4%
Cap rate
0.5%
Rent to Value Ratio