Nevada Investment Properties for Sale
Browse homes for sale and investment properties in Nevada. Refine your search by price, property type, or more.
Best cash flowing properties in Nevada

Active
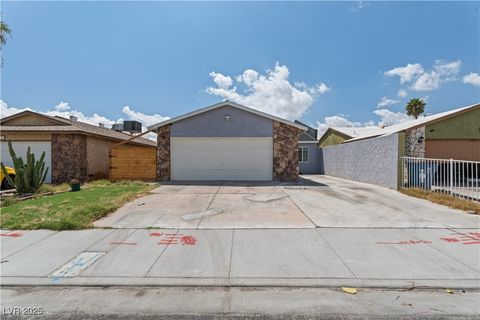
$194,000
2
bds
|
1
ba
|
873
sqft
|
built
1960
350 E Desert Inn Rd, Las Vegas, NV 89109
$-322
Cash flow
-8.7%
Cash-on-Cash Return
4.3%
Cap rate
0.8%
Rent to Value Ratio
Active
$340,000
3
bds
|
2
ba
|
1,548
sqft
|
built
1983
6017 Natures Dr, Las Vegas, NV 89122
$-344
Cash flow
-5.3%
Cash-on-Cash Return
5.1%
Cap rate
0.6%
Rent to Value Ratio
8,411 out of 9,167 properties for sale in Nevada
Limited Results Shown
Create a free account, or log in to reveal all property listings and enjoy the complete experience.
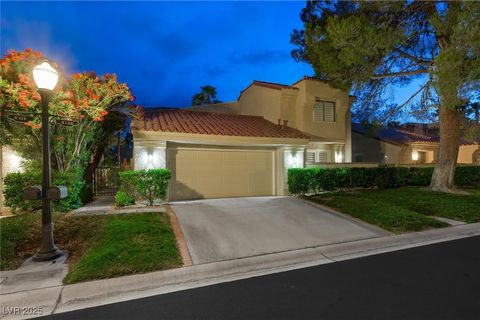
Active
$598,888
2
bds
|
2
ba
|
2,065
sqft
|
built
1985
7296 Mission Hills Dr, Las Vegas, NV 89113
$-2,480
Cash flow
-21.6%
Cash-on-Cash Return
1.3%
Cap rate
0.4%
Rent to Value Ratio
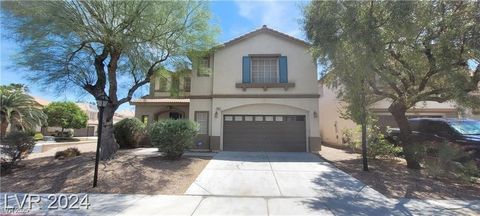
Active
$1,125,000
3
bds
|
4
ba
|
3,276
sqft
|
built
1987
5125 Turnberry Ln, Las Vegas, NV 89113
$-2,910
Cash flow
-13.5%
Cash-on-Cash Return
3.2%
Cap rate
0.5%
Rent to Value Ratio
Active
$489,900
4
bds
|
3
ba
|
2,156
sqft
|
built
2001
4821 Whisper Lake Ave, Las Vegas, NV 89131
$-1,528
Cash flow
-16.3%
Cash-on-Cash Return
2.5%
Cap rate
0.4%
Rent to Value Ratio
Active
$325,000
2
bds
|
1
ba
|
896
sqft
|
built
1942
108 Verdy Ln, Las Vegas, NV 89101
$-643
Cash flow
-10.3%
Cash-on-Cash Return
3.9%
Cap rate
0.5%
Rent to Value Ratio
Active
$200,000
2
bds
|
1
ba
|
924
sqft
|
built
1973
4683 Monterey Cir, Las Vegas, NV 89169
$-458
Cash flow
-11.9%
Cash-on-Cash Return
3.5%
Cap rate
0.7%
Rent to Value Ratio
Active
$214,000
2
bds
|
2
ba
|
995
sqft
|
built
1986
4050 Pacific Harbors Dr, Las Vegas, NV 89121
$-554
Cash flow
-13.5%
Cash-on-Cash Return
3.2%
Cap rate
0.6%
Rent to Value Ratio

Active
$224,900
1
bds
|
1
ba
|
530
sqft
|
built
1992
260 E Flamingo Rd, Las Vegas, NV 89169
$-595
Cash flow
-13.8%
Cash-on-Cash Return
3.1%
Cap rate
0.6%
Rent to Value Ratio

Active
$374,900
4
bds
|
2
ba
|
2,040
sqft
|
built
1971
2639 Heritage Dr, Las Vegas, NV 89121
$-1,597
Cash flow
-22.2%
Cash-on-Cash Return
1.2%
Cap rate
0.3%
Rent to Value Ratio
Active
$859,000
5
bds
|
3
ba
|
2,602
sqft
|
built
1977
6315 Eldora Ave, Las Vegas, NV 89146
$-898
Cash flow
-5.5%
Cash-on-Cash Return
5.0%
Cap rate
0.7%
Rent to Value Ratio
Active
$642,000
4
bds
|
3
ba
|
2,260
sqft
|
built
1989
2724 Monrovia Dr, Las Vegas, NV 89117
$-1,722
Cash flow
-14.0%
Cash-on-Cash Return
3.0%
Cap rate
0.4%
Rent to Value Ratio
Active
$525,000
3
bds
|
3
ba
|
1,738
sqft
|
built
1987
9004 Crystal Glass Dr, Las Vegas, NV 89117
$-1,298
Cash flow
-12.9%
Cash-on-Cash Return
3.3%
Cap rate
0.5%
Rent to Value Ratio
Active
$409,900
3
bds
|
3
ba
|
1,334
sqft
|
built
2006
8708 Gateway Glen Dr, Las Vegas, NV 89178
$-1,183
Cash flow
-15.1%
Cash-on-Cash Return
2.8%
Cap rate
0.4%
Rent to Value Ratio
Active
$340,000
3
bds
|
2
ba
|
1,548
sqft
|
built
1983
6017 Natures Dr, Las Vegas, NV 89122
$-344
Cash flow
-5.3%
Cash-on-Cash Return
5.1%
Cap rate
0.6%
Rent to Value Ratio

Active
$1,199,800
3
bds
|
3
ba
|
3,330
sqft
|
built
1999
308 Kingsclear Ct, Las Vegas, NV 89145
$-3,106
Cash flow
-13.5%
Cash-on-Cash Return
3.2%
Cap rate
0.5%
Rent to Value Ratio

Active
$489,000
4
bds
|
2
ba
|
2,212
sqft
|
built
2006
324 Moonlight Glow Ave, North Las Vegas, NV 89032
$-1,133
Cash flow
-12.1%
Cash-on-Cash Return
3.5%
Cap rate
0.5%
Rent to Value Ratio
Active
$450,000
4
bds
|
2
ba
|
2,192
sqft
|
built
1995
6151 Naha Port Ave, Las Vegas, NV 89110
$-964
Cash flow
-11.2%
Cash-on-Cash Return
3.7%
Cap rate
0.5%
Rent to Value Ratio
Active
$499,999
3
bds
|
3
ba
|
1,801
sqft
|
built
1996
5 Spur Cross Cir, Henderson, NV 89012
$-1,304
Cash flow
-13.6%
Cash-on-Cash Return
3.1%
Cap rate
0.5%
Rent to Value Ratio
Active
$425,000
3
bds
|
4
ba
|
1,602
sqft
|
built
2007
9050 W Tropicana Ave, Las Vegas, NV 89147
$-730
Cash flow
-9.0%
Cash-on-Cash Return
4.2%
Cap rate
0.7%
Rent to Value Ratio
Active
$194,000
2
bds
|
1
ba
|
873
sqft
|
built
1960
350 E Desert Inn Rd, Las Vegas, NV 89109
$-322
Cash flow
-8.7%
Cash-on-Cash Return
4.3%
Cap rate
0.8%
Rent to Value Ratio

Active
$779,900
4
bds
|
3
ba
|
2,954
sqft
|
built
1993
1917 N Moapa Valley Blvd, Logandale, NV 89021
$-2,557
Cash flow
-17.1%
Cash-on-Cash Return
2.3%
Cap rate
0.3%
Rent to Value Ratio
Active
$330,000
2
bds
|
2
ba
|
1,186
sqft
|
built
1989
8940 Antioch Way, Las Vegas, NV 89117
$-914
Cash flow
-14.5%
Cash-on-Cash Return
2.9%
Cap rate
0.5%
Rent to Value Ratio
Active
$2,200,000
4
bds
|
5
ba
|
5,056
sqft
|
built
1990
21 Sawgrass Ct, Las Vegas, NV 89113
$-8,646
Cash flow
-20.5%
Cash-on-Cash Return
1.5%
Cap rate
0.3%
Rent to Value Ratio

Active
$4,750,000
6
bds
|
7
ba
|
5,173
sqft
|
built
1949
1450 Rancho Cir, Las Vegas, NV 89107
$-22,735
Cash flow
-25.0%
Cash-on-Cash Return
0.5%
Cap rate
0.1%
Rent to Value Ratio

Active
$245,000
2
bds
|
2
ba
|
1,240
sqft
|
built
1993
2260 Rugged Mesa Dr, Laughlin, NV 89029
$-787
Cash flow
-16.8%
Cash-on-Cash Return
2.4%
Cap rate
0.6%
Rent to Value Ratio
Active
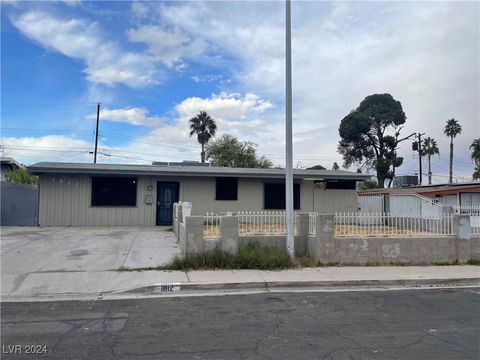
$339,998
3
bds
|
2
ba
|
1,180
sqft
|
built
1956
1812 Ryan Ave, Las Vegas, NV 89101
$-590
Cash flow
-9.1%
Cash-on-Cash Return
4.2%
Cap rate
0.5%
Rent to Value Ratio

Active
$549,900
3
bds
|
3
ba
|
1,641
sqft
|
built
1997
9076 Quarrystone Way, Las Vegas, NV 89123
$-1,392
Cash flow
-13.2%
Cash-on-Cash Return
3.2%
Cap rate
0.5%
Rent to Value Ratio

Active
$239,000
1
bds
|
1
ba
|
876
sqft
|
built
2003
10001 Peace Way, Las Vegas, NV 89147
$-570
Cash flow
-12.4%
Cash-on-Cash Return
3.4%
Cap rate
0.6%
Rent to Value Ratio

Active
$264,990
2
bds
|
2
ba
|
1,042
sqft
|
built
1997
8101 W Flamingo Rd, Las Vegas, NV 89147
$-609
Cash flow
-12.0%
Cash-on-Cash Return
3.5%
Cap rate
0.6%
Rent to Value Ratio

Active
$379,900
3
bds
|
3
ba
|
1,305
sqft
|
built
2000
3254 Gold Run St, North Las Vegas, NV 89032
$-934
Cash flow
-12.8%
Cash-on-Cash Return
3.3%
Cap rate
0.5%
Rent to Value Ratio
Active
$900,000
5
bds
|
4
ba
|
3,068
sqft
|
built
1988
1990 Freeman Ct, Henderson, NV 89014
$-1,840
Cash flow
-10.7%
Cash-on-Cash Return
3.8%
Cap rate
0.5%
Rent to Value Ratio
Active
$799,000
4
bds
|
3
ba
|
2,934
sqft
|
built
1982
5312 Manuel Dr, Las Vegas, NV 89149
$-1,948
Cash flow
-12.7%
Cash-on-Cash Return
3.3%
Cap rate
0.5%
Rent to Value Ratio

Active
$270,000
2
bds
|
2
ba
|
936
sqft
|
built
2003
9050 W Warm Springs Rd, Las Vegas, NV 89148
$-794
Cash flow
-15.3%
Cash-on-Cash Return
2.7%
Cap rate
0.5%
Rent to Value Ratio
Active
$860,000
4
bds
|
3
ba
|
2,646
sqft
|
built
1999
1324 European Dr, Henderson, NV 89052
$-2,471
Cash flow
-15.0%
Cash-on-Cash Return
2.8%
Cap rate
0.4%
Rent to Value Ratio
Active
$315,000
2
bds
|
2
ba
|
1,215
sqft
|
built
2008
8777 W Maule Ave, Las Vegas, NV 89148
$-634
Cash flow
-10.5%
Cash-on-Cash Return
3.9%
Cap rate
0.6%
Rent to Value Ratio
Active
$975,000
6
bds
|
4
ba
|
4,228
sqft
|
built
2004
131 Beesley Dr, Las Vegas, NV 89110
$-2,268
Cash flow
-12.1%
Cash-on-Cash Return
3.5%
Cap rate
0.5%
Rent to Value Ratio
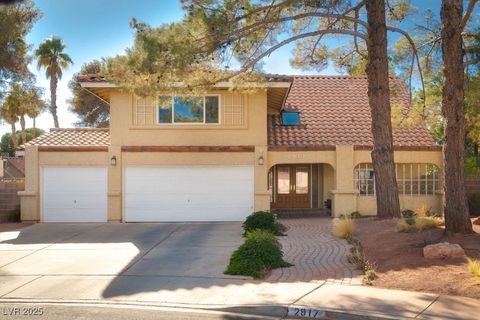
Active
$695,000
4
bds
|
3
ba
|
2,796
sqft
|
built
1982
2917 Chapala Dr, Las Vegas, NV 89120
$-1,058
Cash flow
-7.9%
Cash-on-Cash Return
4.4%
Cap rate
0.6%
Rent to Value Ratio
Active
$452,500
3
bds
|
3
ba
|
1,935
sqft
|
built
2005
9005 Semillon St, Las Vegas, NV 89148
$-1,181
Cash flow
-13.6%
Cash-on-Cash Return
3.1%
Cap rate
0.4%
Rent to Value Ratio
Active
$1,099,000
5
bds
|
3
ba
|
3,078
sqft
|
built
1980
4030 Del Monte Ave, Las Vegas, NV 89102
$-4,046
Cash flow
-19.2%
Cash-on-Cash Return
1.8%
Cap rate
0.3%
Rent to Value Ratio
Active
$649,900
3
bds
|
3
ba
|
2,709
sqft
|
built
2008
6541 Chinatown St, Las Vegas, NV 89166
$-1,962
Cash flow
-15.8%
Cash-on-Cash Return
2.6%
Cap rate
0.4%
Rent to Value Ratio
Active
$529,900
4
bds
|
3
ba
|
1,726
sqft
|
built
1984
6444 Deadwood Rd, Las Vegas, NV 89108
$-1,645
Cash flow
-16.2%
Cash-on-Cash Return
2.5%
Cap rate
0.4%
Rent to Value Ratio