Nevada Investment Properties for Sale
Browse homes for sale and investment properties in Nevada. Refine your search by price, property type, or more.
Best cash flowing properties in Nevada

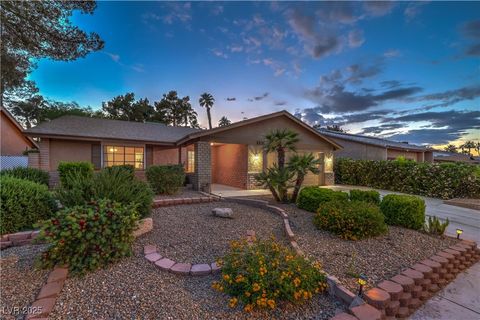
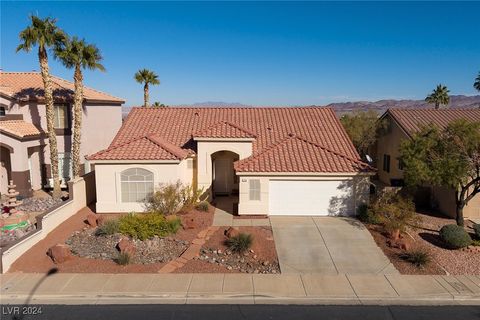
Active
$219,900
3
bds
|
2
ba
|
1,026
sqft
|
built
1977
3683 Villa Knolls East Dr, Las Vegas, NV 89120
$-427
Cash flow
-10.1%
Cash-on-Cash Return
3.9%
Cap rate
0.6%
Rent to Value Ratio
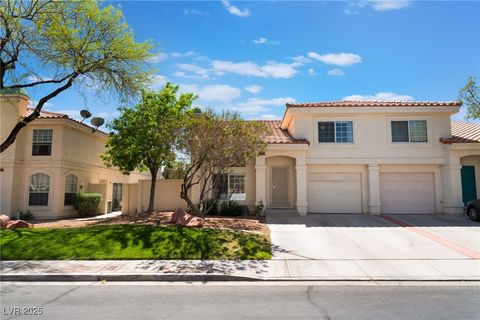
Active
$244,500
2
bds
|
1
ba
|
969
sqft
|
built
1996
1830 N Buffalo Dr, Las Vegas, NV 89128
$-488
Cash flow
-10.4%
Cash-on-Cash Return
3.9%
Cap rate
0.7%
Rent to Value Ratio
8,735 out of 9,140 properties for sale in Nevada
Limited Results Shown
Create a free account, or log in to reveal all property listings and enjoy the complete experience.

Active
$259,000
2
bds
|
3
ba
|
1,440
sqft
|
built
1980
1312 Rawhide St, Las Vegas, NV 89119
$-567
Cash flow
-11.4%
Cash-on-Cash Return
3.6%
Cap rate
0.6%
Rent to Value Ratio

Active
$375,000
2
bds
|
2
ba
|
1,305
sqft
|
built
1997
8737 Red Brook Dr, Las Vegas, NV 89128
$-1,119
Cash flow
-15.6%
Cash-on-Cash Return
2.7%
Cap rate
0.5%
Rent to Value Ratio
Active
$244,500
2
bds
|
1
ba
|
969
sqft
|
built
1996
1830 N Buffalo Dr, Las Vegas, NV 89128
$-488
Cash flow
-10.4%
Cash-on-Cash Return
3.9%
Cap rate
0.7%
Rent to Value Ratio

Active
$424,750
3
bds
|
3
ba
|
1,646
sqft
|
built
2021
2924 Sunday Silence Rd, North Las Vegas, NV 89086
$-1,194
Cash flow
-14.7%
Cash-on-Cash Return
2.9%
Cap rate
0.5%
Rent to Value Ratio

Active
$375,000
3
bds
|
3
ba
|
1,665
sqft
|
built
2021
2682 Weathered Copper Ave, North Las Vegas, NV 89086
$-1,083
Cash flow
-15.1%
Cash-on-Cash Return
2.8%
Cap rate
0.5%
Rent to Value Ratio
Active
$495,000
4
bds
|
4
ba
|
2,044
sqft
|
built
2020
105 Campbelltown Ave, Henderson, NV 89015
$-1,374
Cash flow
-14.5%
Cash-on-Cash Return
2.9%
Cap rate
0.5%
Rent to Value Ratio

Active
$385,000
4
bds
|
3
ba
|
1,603
sqft
|
built
2019
369 Stone Fly Rd, North Las Vegas, NV 89032
$-1,014
Cash flow
-13.7%
Cash-on-Cash Return
3.1%
Cap rate
0.5%
Rent to Value Ratio
Active
$249,999
2
bds
|
2
ba
|
912
sqft
|
built
1991
7961 Lions Rock Way, Las Vegas, NV 89128
$-683
Cash flow
-14.3%
Cash-on-Cash Return
3.0%
Cap rate
0.5%
Rent to Value Ratio
Active
$549,000
4
bds
|
3
ba
|
2,309
sqft
|
built
2014
7246 Spring Flower Ave, Las Vegas, NV 89117
$-1,599
Cash flow
-15.2%
Cash-on-Cash Return
2.8%
Cap rate
0.5%
Rent to Value Ratio

Active
$394,990
3
bds
|
3
ba
|
1,429
sqft
|
built
2000
9972 Trailing Vine St, Las Vegas, NV 89183
$-868
Cash flow
-11.5%
Cash-on-Cash Return
3.6%
Cap rate
0.5%
Rent to Value Ratio
Active
$525,000
3
bds
|
2
ba
|
1,696
sqft
|
built
1979
2231 Marlboro Dr, Henderson, NV 89014
$-1,037
Cash flow
-10.3%
Cash-on-Cash Return
3.9%
Cap rate
0.5%
Rent to Value Ratio

Active
$700,000
5
bds
|
3
ba
|
3,155
sqft
|
built
2008
2733 Auchmull St, Henderson, NV 89044
$-1,541
Cash flow
-11.5%
Cash-on-Cash Return
3.6%
Cap rate
0.5%
Rent to Value Ratio
Active
$519,000
3
bds
|
2
ba
|
1,392
sqft
|
built
2001
10336 Birch Bluff Ln, Las Vegas, NV 89145
$-1,421
Cash flow
-14.3%
Cash-on-Cash Return
3.0%
Cap rate
0.5%
Rent to Value Ratio

Active
$559,621
4
bds
|
3
ba
|
2,643
sqft
|
built
2005
948 Mill Run Creek Ave, Henderson, NV 89002
$-1,415
Cash flow
-13.2%
Cash-on-Cash Return
3.2%
Cap rate
0.5%
Rent to Value Ratio
Active
$429,900
3
bds
|
2
ba
|
1,527
sqft
|
built
1997
33 Newburg Ave, North Las Vegas, NV 89032
$-1,211
Cash flow
-14.7%
Cash-on-Cash Return
2.9%
Cap rate
0.4%
Rent to Value Ratio
Active
$495,000
4
bds
|
3
ba
|
2,281
sqft
|
built
2014
6476 Little Harbor Ct, Las Vegas, NV 89141
$-1,324
Cash flow
-14.0%
Cash-on-Cash Return
3.1%
Cap rate
0.5%
Rent to Value Ratio

Active
$13,000,000
5
bds
|
8
ba
|
9,873
sqft
|
built
2009
28 Painted Feather Way, Las Vegas, NV 89135
$-66,109
Cash flow
-26.5%
Cash-on-Cash Return
0.2%
Cap rate
0.1%
Rent to Value Ratio
Active
$749,900
3
bds
|
3
ba
|
3,245
sqft
|
built
1996
2107 Eaglepath Cir, Henderson, NV 89074
$-1,529
Cash flow
-10.6%
Cash-on-Cash Return
3.8%
Cap rate
0.5%
Rent to Value Ratio

Active
$279,900
2
bds
|
2
ba
|
852
sqft
|
built
1985
3630 Three Bars Ct, Las Vegas, NV 89115
$-818
Cash flow
-15.2%
Cash-on-Cash Return
2.8%
Cap rate
0.4%
Rent to Value Ratio
Active
$400,000
2
bds
|
0
ba
|
1,247
sqft
|
built
1944
203 N 13th St, Las Vegas, NV 89101
$-1,323
Cash flow
-17.3%
Cash-on-Cash Return
2.3%
Cap rate
0.3%
Rent to Value Ratio
Active
$620,000
4
bds
|
3
ba
|
2,242
sqft
|
built
1989
9520 Wooden Pier Way, Las Vegas, NV 89117
$-1,318
Cash flow
-11.1%
Cash-on-Cash Return
3.7%
Cap rate
0.5%
Rent to Value Ratio
Active
$219,900
3
bds
|
2
ba
|
1,026
sqft
|
built
1977
3683 Villa Knolls East Dr, Las Vegas, NV 89120
$-427
Cash flow
-10.1%
Cash-on-Cash Return
3.9%
Cap rate
0.6%
Rent to Value Ratio
Active
$575,000
4
bds
|
3
ba
|
2,300
sqft
|
built
2004
3273 Alcudia Bay Ave, Las Vegas, NV 89141
$-1,621
Cash flow
-14.7%
Cash-on-Cash Return
2.9%
Cap rate
0.5%
Rent to Value Ratio

Active
$525,000
4
bds
|
2
ba
|
1,784
sqft
|
built
1993
1805 Candle Bright Dr, Henderson, NV 89074
$-1,453
Cash flow
-14.4%
Cash-on-Cash Return
2.9%
Cap rate
0.4%
Rent to Value Ratio

Active
$899,788
4
bds
|
3
ba
|
2,353
sqft
|
built
1993
912 Pro Players Dr, Las Vegas, NV 89134
$-2,796
Cash flow
-16.2%
Cash-on-Cash Return
2.5%
Cap rate
0.4%
Rent to Value Ratio
Active
$524,999
3
bds
|
2
ba
|
1,802
sqft
|
built
2014
7497 Alamo Ranch Ave, Las Vegas, NV 89179
$-1,292
Cash flow
-12.8%
Cash-on-Cash Return
3.3%
Cap rate
0.5%
Rent to Value Ratio
Active
$599,900
3
bds
|
3
ba
|
2,173
sqft
|
built
2006
5361 Candlespice Way, Las Vegas, NV 89135
$-1,806
Cash flow
-15.7%
Cash-on-Cash Return
2.7%
Cap rate
0.4%
Rent to Value Ratio
Active
$615,000
4
bds
|
3
ba
|
2,775
sqft
|
built
2007
10519 Bella Camrosa Dr, Las Vegas, NV 89141
$-1,377
Cash flow
-11.7%
Cash-on-Cash Return
3.6%
Cap rate
0.5%
Rent to Value Ratio

Active
$620,000
6
bds
|
0
ba
|
3,082
sqft
|
built
1963
833 N Bruce St, Las Vegas, NV 89101
$-2,236
Cash flow
-18.8%
Cash-on-Cash Return
1.9%
Cap rate
0.3%
Rent to Value Ratio

Active
$910,000
3
bds
|
3
ba
|
2,790
sqft
|
built
2003
11369 Rancho Villa Verde Pl, Las Vegas, NV 89138
$-2,527
Cash flow
-14.5%
Cash-on-Cash Return
2.9%
Cap rate
0.4%
Rent to Value Ratio
Active
$330,000
3
bds
|
1
ba
|
1,021
sqft
|
built
1943
215 N Bruce St, Las Vegas, NV 89101
$-515
Cash flow
-8.1%
Cash-on-Cash Return
4.4%
Cap rate
0.5%
Rent to Value Ratio
Active
$555,000
3
bds
|
2
ba
|
1,967
sqft
|
built
1998
730 Descartes Ave, Henderson, NV 89002
$-1,471
Cash flow
-13.8%
Cash-on-Cash Return
3.1%
Cap rate
0.5%
Rent to Value Ratio

Active
$550,000
3
bds
|
2
ba
|
2,158
sqft
|
built
2005
1428 Chaparral Dr, Mesquite, NV 89027
$-1,476
Cash flow
-14.0%
Cash-on-Cash Return
3.0%
Cap rate
0.5%
Rent to Value Ratio

Active
$669,900
4
bds
|
4
ba
|
3,226
sqft
|
built
2012
4212 Hawks Glide Ave, North Las Vegas, NV 89084
$-1,753
Cash flow
-13.7%
Cash-on-Cash Return
3.1%
Cap rate
0.5%
Rent to Value Ratio

Active
$223,900
1
bds
|
1
ba
|
862
sqft
|
built
2006
6680 Caporetto Ln, North Las Vegas, NV 89084
$-522
Cash flow
-12.2%
Cash-on-Cash Return
3.5%
Cap rate
0.6%
Rent to Value Ratio

Active
$499,900
4
bds
|
3
ba
|
1,686
sqft
|
built
2007
8768 Charm Canyon Ave, Las Vegas, NV 89178
$-1,674
Cash flow
-17.5%
Cash-on-Cash Return
2.2%
Cap rate
0.4%
Rent to Value Ratio

Active
$1,750,000
4
bds
|
5
ba
|
4,192
sqft
|
built
1989
380 Claremont St, Boulder City, NV 89005
$-4,234
Cash flow
-12.6%
Cash-on-Cash Return
3.4%
Cap rate
0.5%
Rent to Value Ratio
Active
$348,000
2
bds
|
3
ba
|
1,287
sqft
|
built
1996
7945 Delbonita Ave, Las Vegas, NV 89147
$-793
Cash flow
-11.9%
Cash-on-Cash Return
3.5%
Cap rate
0.5%
Rent to Value Ratio

Active
$418,787
3
bds
|
3
ba
|
1,530
sqft
|
built
2006
137 Coronation Ave, Las Vegas, NV 89123
$-1,017
Cash flow
-12.7%
Cash-on-Cash Return
3.3%
Cap rate
0.5%
Rent to Value Ratio

Active
$299,500
2
bds
|
2
ba
|
1,410
sqft
|
built
2006
5855 Valley Dr, North Las Vegas, NV 89031
$-771
Cash flow
-13.4%
Cash-on-Cash Return
3.2%
Cap rate
0.5%
Rent to Value Ratio