Nevada Investment Properties for Sale
Browse homes for sale and investment properties in Nevada. Refine your search by price, property type, or more.
Best cash flowing properties in Nevada
Active
$175,000
2
bds
|
2
ba
|
1,188
sqft
|
built
1983
2080 Karen Ave, Las Vegas, NV 89169
$-292
Cash flow
-8.7%
Cash-on-Cash Return
4.3%
Cap rate
0.9%
Rent to Value Ratio

Active
$165,000
2
bds
|
1
ba
|
890
sqft
|
built
1990
3550 Bay Sands Dr, Laughlin, NV 89029
$-312
Cash flow
-9.9%
Cash-on-Cash Return
4.0%
Cap rate
0.8%
Rent to Value Ratio
8,410 out of 9,166 properties for sale in Nevada
Limited Results Shown
Create a free account, or log in to reveal all property listings and enjoy the complete experience.
Active
$642,000
4
bds
|
3
ba
|
2,260
sqft
|
built
1989
2724 Monrovia Dr, Las Vegas, NV 89117
$-1,722
Cash flow
-14.0%
Cash-on-Cash Return
3.0%
Cap rate
0.4%
Rent to Value Ratio
Active
$525,000
3
bds
|
3
ba
|
1,738
sqft
|
built
1987
9004 Crystal Glass Dr, Las Vegas, NV 89117
$-1,298
Cash flow
-12.9%
Cash-on-Cash Return
3.3%
Cap rate
0.5%
Rent to Value Ratio

Active
$250,000
2
bds
|
2
ba
|
1,048
sqft
|
built
2001
1050 E Cactus Ave, Las Vegas, NV 89183
$-675
Cash flow
-14.1%
Cash-on-Cash Return
3.0%
Cap rate
0.6%
Rent to Value Ratio

Active
$420,000
3
bds
|
4
ba
|
1,613
sqft
|
built
2015
9050 W Tropicana Ave, Las Vegas, NV 89147
$-1,370
Cash flow
-17.0%
Cash-on-Cash Return
2.4%
Cap rate
0.5%
Rent to Value Ratio
Active
$240,000
2
bds
|
2
ba
|
884
sqft
|
built
1989
4718 Nara Vista Way, Las Vegas, NV 89103
$-582
Cash flow
-12.7%
Cash-on-Cash Return
3.4%
Cap rate
0.6%
Rent to Value Ratio

Active
$559,000
4
bds
|
3
ba
|
3,064
sqft
|
built
2007
1771 Labrador St, Pahrump, NV 89048
$-1,513
Cash flow
-14.1%
Cash-on-Cash Return
3.0%
Cap rate
0.4%
Rent to Value Ratio
Active
$175,000
2
bds
|
2
ba
|
1,188
sqft
|
built
1983
2080 Karen Ave, Las Vegas, NV 89169
$-292
Cash flow
-8.7%
Cash-on-Cash Return
4.3%
Cap rate
0.9%
Rent to Value Ratio

Active
$371,750
3
bds
|
3
ba
|
1,588
sqft
|
built
2005
8728 Tom Noon Ave, Las Vegas, NV 89178
$-838
Cash flow
-11.8%
Cash-on-Cash Return
3.6%
Cap rate
0.5%
Rent to Value Ratio
Active
$384,900
2
bds
|
2
ba
|
902
sqft
|
built
1990
4200 S Valley View Blvd, Las Vegas, NV 89103
$-1,264
Cash flow
-17.1%
Cash-on-Cash Return
2.3%
Cap rate
0.4%
Rent to Value Ratio
Active
$235,000
1
bds
|
1
ba
|
1,000
sqft
|
built
1973
4670 Monterey Cir, Las Vegas, NV 89169
$-527
Cash flow
-11.7%
Cash-on-Cash Return
3.6%
Cap rate
0.6%
Rent to Value Ratio
Active
$230,000
2
bds
|
2
ba
|
981
sqft
|
built
1990
3145 E Flamingo Rd, Las Vegas, NV 89121
$-403
Cash flow
-9.1%
Cash-on-Cash Return
4.2%
Cap rate
0.7%
Rent to Value Ratio
Active
$165,000
2
bds
|
1
ba
|
890
sqft
|
built
1990
3550 Bay Sands Dr, Laughlin, NV 89029
$-312
Cash flow
-9.9%
Cash-on-Cash Return
4.0%
Cap rate
0.8%
Rent to Value Ratio

Active
$345,000
2
bds
|
2
ba
|
1,042
sqft
|
built
2002
700 Carnegie St, Henderson, NV 89052
$-1,016
Cash flow
-15.4%
Cash-on-Cash Return
2.7%
Cap rate
0.5%
Rent to Value Ratio
Active
$1,449,900
5
bds
|
2
ba
|
2,316
sqft
|
built
1985
11875 Maggie Ave, Las Vegas, NV 89166
$-3,936
Cash flow
-14.2%
Cash-on-Cash Return
3.0%
Cap rate
0.4%
Rent to Value Ratio
Active
$1,145,000
3
bds
|
2
ba
|
2,888
sqft
|
built
1974
10615 Rancho Destino Rd, Las Vegas, NV 89183
$-3,983
Cash flow
-18.1%
Cash-on-Cash Return
2.1%
Cap rate
0.3%
Rent to Value Ratio

Active
$429,999
5
bds
|
3
ba
|
1,937
sqft
|
built
2005
8174 Amphora St, Las Vegas, NV 89139
$-949
Cash flow
-11.5%
Cash-on-Cash Return
3.6%
Cap rate
0.5%
Rent to Value Ratio
Active
$369,900
3
bds
|
3
ba
|
1,966
sqft
|
built
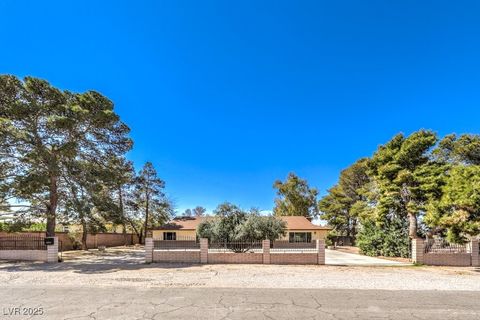
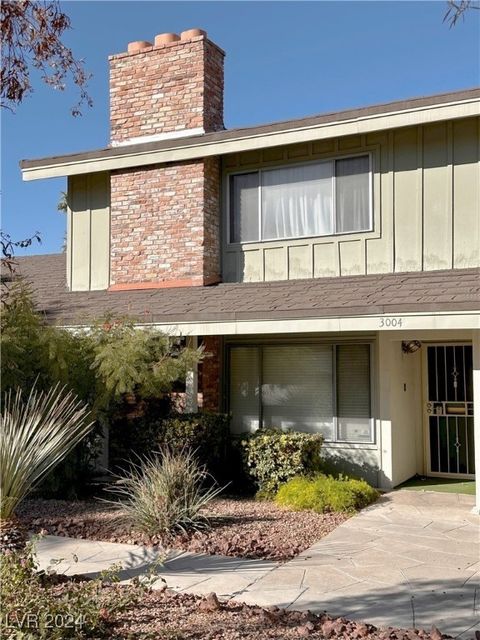
1965
3004 El Camino Ave, Las Vegas, NV 89102
$-837
Cash flow
-11.8%
Cash-on-Cash Return
3.5%
Cap rate
0.5%
Rent to Value Ratio
Active
$375,000
3
bds
|
2
ba
|
1,287
sqft
|
built
1981
115 Parrish Ln, Las Vegas, NV 89110
$-785
Cash flow
-10.9%
Cash-on-Cash Return
3.8%
Cap rate
0.5%
Rent to Value Ratio
Active
$680,000
4
bds
|
4
ba
|
2,548
sqft
|
built
1997
427 Rhythm St, Henderson, NV 89074
$-1,870
Cash flow
-14.3%
Cash-on-Cash Return
3.0%
Cap rate
0.4%
Rent to Value Ratio

Active
$485,000
3
bds
|
3
ba
|
1,805
sqft
|
built
2018
358 Badinerie St, Henderson, NV 89011
$-1,362
Cash flow
-14.7%
Cash-on-Cash Return
2.9%
Cap rate
0.5%
Rent to Value Ratio
Active
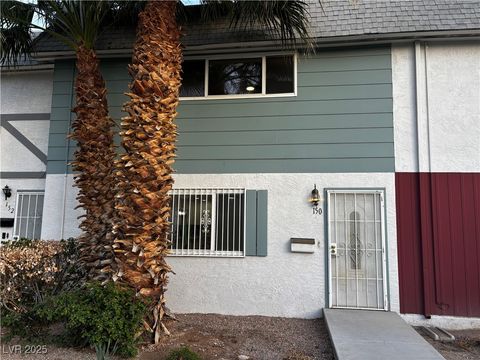
$285,000
2
bds
|
3
ba
|
1,320
sqft
|
built
1969
150 Greenbriar Townhouse Way, Las Vegas, NV 89121
$-663
Cash flow
-12.1%
Cash-on-Cash Return
3.5%
Cap rate
0.5%
Rent to Value Ratio
Active
$372,000
3
bds
|
2
ba
|
1,298
sqft
|
built
1999
2319 Little Italy Ave, North Las Vegas, NV 89031
$-840
Cash flow
-11.8%
Cash-on-Cash Return
3.6%
Cap rate
0.5%
Rent to Value Ratio

Active
$465,000
3
bds
|
2
ba
|
2,060
sqft
|
built
1963
1389 Pawnee Dr, Las Vegas, NV 89169
$-1,169
Cash flow
-13.1%
Cash-on-Cash Return
3.2%
Cap rate
0.4%
Rent to Value Ratio
Active
$874,000
4
bds
|
4
ba
|
3,368
sqft
|
built
2003
6493 Yellow Bells Ct, Las Vegas, NV 89131
$-1,907
Cash flow
-11.4%
Cash-on-Cash Return
3.6%
Cap rate
0.5%
Rent to Value Ratio
Active
$3,650,000
5
bds
|
5
ba
|
5,555
sqft
|
built
2005
2038 Cherry Creek Cir, Las Vegas, NV 89135
$-12,918
Cash flow
-18.5%
Cash-on-Cash Return
2.0%
Cap rate
0.3%
Rent to Value Ratio
Active
$415,000
3
bds
|
3
ba
|
1,668
sqft
|
built
2005
2604 Courlan Dr, North Las Vegas, NV 89084
$-1,046
Cash flow
-13.2%
Cash-on-Cash Return
3.2%
Cap rate
0.5%
Rent to Value Ratio
Active
$1,799,999
3
bds
|
4
ba
|
3,455
sqft
|
built
2003
11534 Glowing Sunset Ln, Las Vegas, NV 89135
$-4,809
Cash flow
-13.9%
Cash-on-Cash Return
3.1%
Cap rate
0.4%
Rent to Value Ratio
Active
$569,900
3
bds
|
3
ba
|
2,103
sqft
|
built
1999
256 Camino Viejo St, Henderson, NV 89012
$-1,663
Cash flow
-15.2%
Cash-on-Cash Return
2.8%
Cap rate
0.4%
Rent to Value Ratio
Active
$799,000
4
bds
|
3
ba
|
3,116
sqft
|
built
1998
10325 Falls Church Ave, Las Vegas, NV 89144
$-2,110
Cash flow
-13.8%
Cash-on-Cash Return
3.1%
Cap rate
0.5%
Rent to Value Ratio
Active
$1,250,000
3
bds
|
3
ba
|
2,612
sqft
|
built
1984
2861 Queens Courtyard Dr, Las Vegas, NV 89109
$-5,075
Cash flow
-21.2%
Cash-on-Cash Return
1.4%
Cap rate
0.2%
Rent to Value Ratio

Active
$459,999
5
bds
|
3
ba
|
3,528
sqft
|
built
1952
116 W Victory Rd, Henderson, NV 89015
$-634
Cash flow
-7.2%
Cash-on-Cash Return
4.6%
Cap rate
0.6%
Rent to Value Ratio

Active
$498,000
3
bds
|
3
ba
|
1,649
sqft
|
built
1996
1116 Avellino Ln, Las Vegas, NV 89144
$-1,450
Cash flow
-15.2%
Cash-on-Cash Return
2.8%
Cap rate
0.4%
Rent to Value Ratio
Active
$279,900
2
bds
|
2
ba
|
891
sqft
|
built
1973
4231 White Sands Ave, Las Vegas, NV 89121
$-497
Cash flow
-9.3%
Cash-on-Cash Return
4.1%
Cap rate
0.6%
Rent to Value Ratio

Active
$519,000
4
bds
|
3
ba
|
2,088
sqft
|
built
1988
1834 Escondido Ter, Henderson, NV 89074
$-1,144
Cash flow
-11.5%
Cash-on-Cash Return
3.6%
Cap rate
0.5%
Rent to Value Ratio
Active
$485,000
4
bds
|
3
ba
|
2,528
sqft
|
built
2006
1213 High Altitude Ave, North Las Vegas, NV 89032
$-1,269
Cash flow
-13.7%
Cash-on-Cash Return
3.1%
Cap rate
0.5%
Rent to Value Ratio
Active
$1,850,000
5
bds
|
4
ba
|
5,888
sqft
|
built
1976
2045 S Tenaya Way, Las Vegas, NV 89117
$-7,172
Cash flow
-20.2%
Cash-on-Cash Return
1.6%
Cap rate
0.2%
Rent to Value Ratio
Active
$895,000
4
bds
|
4
ba
|
3,010
sqft
|
built
1996
10112 Plomosa Pl, Las Vegas, NV 89134
$-2,460
Cash flow
-14.3%
Cash-on-Cash Return
3.0%
Cap rate
0.4%
Rent to Value Ratio
Active
$529,999
2
bds
|
2
ba
|
2,037
sqft
|
built
1992
8591 Heather Downs Dr, Las Vegas, NV 89113
$-1,894
Cash flow
-18.6%
Cash-on-Cash Return
2.0%
Cap rate
0.5%
Rent to Value Ratio
Active
$395,000
3
bds
|
2
ba
|
1,259
sqft
|
built
1976
4766 Knollwood Dr, Las Vegas, NV 89147
$-941
Cash flow
-12.4%
Cash-on-Cash Return
3.4%
Cap rate
0.5%
Rent to Value Ratio

Active
$695,000
2
bds
|
3
ba
|
1,914
sqft
|
built
1988
7889 Harbour Towne Ave, Las Vegas, NV 89113
$-2,118
Cash flow
-15.9%
Cash-on-Cash Return
2.6%
Cap rate
0.5%
Rent to Value Ratio