Nevada Investment Properties for Sale
Browse homes for sale and investment properties in Nevada. Refine your search by price, property type, or more.
Best cash flowing properties in Nevada
Active
$159,000
1
bds
|
1
ba
|
700
sqft
|
built
1982
5314 River Glen Dr, Las Vegas, NV 89103
$-272
Cash flow
-8.9%
Cash-on-Cash Return
3.6%
Cap rate
0.7%
Rent to Value Ratio
Active
$319,000
4
bds
|
2
ba
|
1,435
sqft
|
built
1962
6120 Denver Cir, Las Vegas, NV 89107
$-354
Cash flow
-5.8%
Cash-on-Cash Return
4.3%
Cap rate
0.6%
Rent to Value Ratio
5,259 out of 5,499 properties for sale in Nevada
Limited Results Shown
Create a free account, or log in to reveal all property listings and enjoy the complete experience.
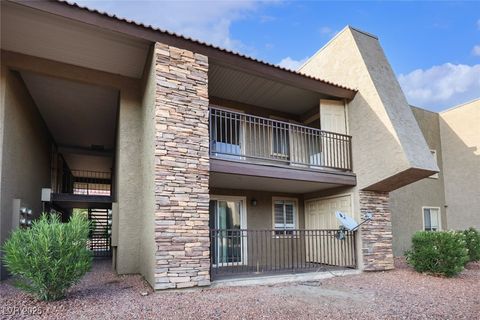
Active
$250,000
2
bds
|
2
ba
|
1,022
sqft
|
built
1995
1900 N Torrey Pines Dr, Las Vegas, NV 89108
$-711
Cash flow
-14.8%
Cash-on-Cash Return
2.3%
Cap rate
0.6%
Rent to Value Ratio

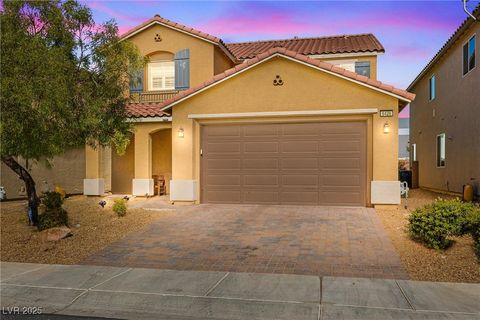
Active
$334,900
2
bds
|
2
ba
|
1,282
sqft
|
built
2002
716 Peachy Canyon Cir, Las Vegas, NV 89144
$-844
Cash flow
-13.1%
Cash-on-Cash Return
2.7%
Cap rate
0.5%
Rent to Value Ratio

Active
$544,999
4
bds
|
3
ba
|
2,007
sqft
|
built
1994
6311 American Beauty Ave, Las Vegas, NV 89142
$-1,179
Cash flow
-11.3%
Cash-on-Cash Return
3.1%
Cap rate
0.4%
Rent to Value Ratio

Active
$305,000
2
bds
|
2
ba
|
974
sqft
|
built
1992
270 E Flamingo Rd, Las Vegas, NV 89169
$-899
Cash flow
-15.4%
Cash-on-Cash Return
2.1%
Cap rate
0.6%
Rent to Value Ratio
Active
$605,000
4
bds
|
4
ba
|
2,471
sqft
|
built
2016
6426 Holland Hills St, Las Vegas, NV 89113
$-1,638
Cash flow
-14.1%
Cash-on-Cash Return
2.4%
Cap rate
0.4%
Rent to Value Ratio
Active
$462,000
4
bds
|
3
ba
|
2,011
sqft
|
built
1997
6282 Crespo Ct, Las Vegas, NV 89122
$-946
Cash flow
-10.7%
Cash-on-Cash Return
3.2%
Cap rate
0.5%
Rent to Value Ratio

Active
$560,000
5
bds
|
3
ba
|
2,467
sqft
|
built
2020
5554 Lushan St, Las Vegas, NV 89148
$-1,387
Cash flow
-12.9%
Cash-on-Cash Return
2.7%
Cap rate
0.4%
Rent to Value Ratio
Active
$480,000
5
bds
|
4
ba
|
2,642
sqft
|
built
2022
6839 Greensmen Ave, Las Vegas, NV 89156
$-938
Cash flow
-10.2%
Cash-on-Cash Return
3.3%
Cap rate
0.5%
Rent to Value Ratio

Active
$519,990
3
bds
|
3
ba
|
2,443
sqft
|
built
2001
9862 Shadow Grove Ave, Las Vegas, NV 89148
$-1,200
Cash flow
-12.0%
Cash-on-Cash Return
2.9%
Cap rate
0.4%
Rent to Value Ratio
Active
$279,000
2
bds
|
2
ba
|
1,266
sqft
|
built
1996
701 Harvest Run Dr, Las Vegas, NV 89145
$-516
Cash flow
-9.6%
Cash-on-Cash Return
3.5%
Cap rate
0.6%
Rent to Value Ratio

Active
$399,999
3
bds
|
3
ba
|
1,640
sqft
|
built
2009
10809 Mystic Shore Ave, Las Vegas, NV 89166
$-828
Cash flow
-10.8%
Cash-on-Cash Return
3.2%
Cap rate
0.5%
Rent to Value Ratio
Active
$510,000
5
bds
|
3
ba
|
2,044
sqft
|
built
1973
3113 Black Forest Dr, Las Vegas, NV 89102
$-559
Cash flow
-5.7%
Cash-on-Cash Return
4.4%
Cap rate
0.6%
Rent to Value Ratio

Active
$424,990
3
bds
|
3
ba
|
2,089
sqft
|
built
2004
7828 Ithaca Falls St, Las Vegas, NV 89149
$-767
Cash flow
-9.4%
Cash-on-Cash Return
3.5%
Cap rate
0.5%
Rent to Value Ratio
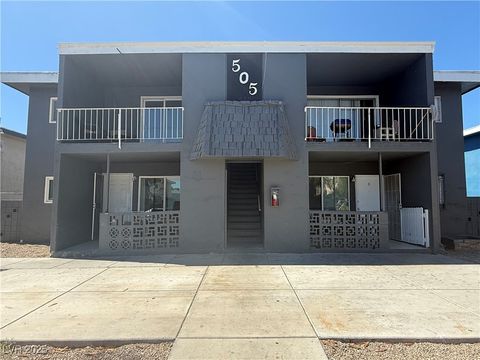
Active
$695,000
8
bds
|
0
ba
|
3,528
sqft
|
built
1963
505 Kolson Cir, Las Vegas, NV 89119
$-2,334
Cash flow
-17.5%
Cash-on-Cash Return
1.6%
Cap rate
0.2%
Rent to Value Ratio
Active
$574,900
3
bds
|
2
ba
|
1,867
sqft
|
built
1989
3040 Ocean Port Dr, Las Vegas, NV 89117
$-1,380
Cash flow
-12.5%
Cash-on-Cash Return
2.8%
Cap rate
0.4%
Rent to Value Ratio
Active
$859,900
4
bds
|
3
ba
|
3,100
sqft
|
built
2000
421 Silver Prairie Ct, Las Vegas, NV 89144
$-2,046
Cash flow
-12.4%
Cash-on-Cash Return
2.8%
Cap rate
0.4%
Rent to Value Ratio
Active
$455,000
3
bds
|
2
ba
|
1,468
sqft
|
built
2004
7025 Point Cabrillo Ct, Las Vegas, NV 89113
$-1,036
Cash flow
-11.9%
Cash-on-Cash Return
2.9%
Cap rate
0.4%
Rent to Value Ratio
Active
$469,900
3
bds
|
3
ba
|
1,468
sqft
|
built
1998
5508 Ness Ave, Las Vegas, NV 89118
$-790
Cash flow
-8.8%
Cash-on-Cash Return
3.7%
Cap rate
0.5%
Rent to Value Ratio
Active
$379,000
3
bds
|
2
ba
|
1,504
sqft
|
built
2005
4035 Misty Lilac Ct, Las Vegas, NV 89122
$-743
Cash flow
-10.2%
Cash-on-Cash Return
3.3%
Cap rate
0.5%
Rent to Value Ratio
Active
$270,000
2
bds
|
2
ba
|
1,198
sqft
|
built
2004
59 E Agate Ave, Las Vegas, NV 89123
$-707
Cash flow
-13.7%
Cash-on-Cash Return
2.5%
Cap rate
0.6%
Rent to Value Ratio
Active
$360,000
2
bds
|
2
ba
|
1,179
sqft
|
built
1987
8961 Clairton Ct, Las Vegas, NV 89117
$-828
Cash flow
-12.0%
Cash-on-Cash Return
2.9%
Cap rate
0.5%
Rent to Value Ratio
Active
$725,000
4
bds
|
3
ba
|
2,894
sqft
|
built
1999
10705 Sprucedale Ave, Las Vegas, NV 89144
$-1,949
Cash flow
-14.0%
Cash-on-Cash Return
2.5%
Cap rate
0.4%
Rent to Value Ratio
Active
$529,999
3
bds
|
2
ba
|
1,989
sqft
|
built
1980
6151 Peppermill Dr, Las Vegas, NV 89146
$-1,107
Cash flow
-10.9%
Cash-on-Cash Return
3.2%
Cap rate
0.4%
Rent to Value Ratio

Active
$509,900
3
bds
|
3
ba
|
2,051
sqft
|
built
2021
9947 Tucket Point Ct, Las Vegas, NV 89178
$-961
Cash flow
-9.8%
Cash-on-Cash Return
3.4%
Cap rate
0.5%
Rent to Value Ratio
Active
$835,000
3
bds
|
2
ba
|
3,462
sqft
|
built
2005
5603 Deer Creek Falls Ct, Las Vegas, NV 89118
$-2,031
Cash flow
-12.7%
Cash-on-Cash Return
2.8%
Cap rate
0.4%
Rent to Value Ratio

Active
$775,000
3
bds
|
3
ba
|
2,363
sqft
|
built
2022
10155 Copper Meadow Ave, Las Vegas, NV 89166
$-2,342
Cash flow
-15.8%
Cash-on-Cash Return
2.1%
Cap rate
0.4%
Rent to Value Ratio
Active
$575,000
8
bds
|
0
ba
|
2,684
sqft
|
built
1962
3801 Royal Crest St, Las Vegas, NV 89119
$-1,873
Cash flow
-17.0%
Cash-on-Cash Return
1.8%
Cap rate
0.2%
Rent to Value Ratio

Active
$435,000
3
bds
|
3
ba
|
1,608
sqft
|
built
2006
8151 Rock Meadows Dr, Las Vegas, NV 89178
$-1,066
Cash flow
-12.8%
Cash-on-Cash Return
2.7%
Cap rate
0.4%
Rent to Value Ratio
Active
$520,000
5
bds
|
3
ba
|
2,804
sqft
|
built
2016
10917 Prudhoe Bay St, Las Vegas, NV 89179
$-1,229
Cash flow
-12.3%
Cash-on-Cash Return
2.8%
Cap rate
0.5%
Rent to Value Ratio
Active
$515,000
3
bds
|
3
ba
|
2,274
sqft
|
built
2006
1695 Little Crow Ave, Las Vegas, NV 89123
$-1,127
Cash flow
-11.4%
Cash-on-Cash Return
3.1%
Cap rate
0.4%
Rent to Value Ratio
Active
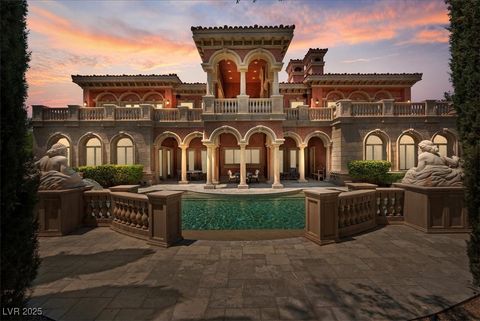
$8,678,888
6
bds
|
8
ba
|
11,787
sqft
|
built
2007
19 Eagles Landing Ln, Las Vegas, NV 89141
$-40,495
Cash flow
-24.3%
Cash-on-Cash Return
0.1%
Cap rate
0.1%
Rent to Value Ratio
Active
$388,980
3
bds
|
2
ba
|
1,238
sqft
|
built
1987
7083 Gunslinger St, Las Vegas, NV 89119
$-855
Cash flow
-11.5%
Cash-on-Cash Return
3.0%
Cap rate
0.4%
Rent to Value Ratio

Active
$495,000
4
bds
|
3
ba
|
1,972
sqft
|
built
2005
7553 Rustic Galleon St, Las Vegas, NV 89139
$-1,054
Cash flow
-11.1%
Cash-on-Cash Return
3.1%
Cap rate
0.4%
Rent to Value Ratio
Active
$399,000
3
bds
|
2
ba
|
1,620
sqft
|
built
1976
7021 Stormson Dr, Las Vegas, NV 89145
$-822
Cash flow
-10.7%
Cash-on-Cash Return
3.2%
Cap rate
0.4%
Rent to Value Ratio
Active
$1,000,000
3
bds
|
3
ba
|
2,133
sqft
|
built
1995
5875 W Post Rd, Las Vegas, NV 89118
$-2,985
Cash flow
-15.6%
Cash-on-Cash Return
2.1%
Cap rate
0.3%
Rent to Value Ratio
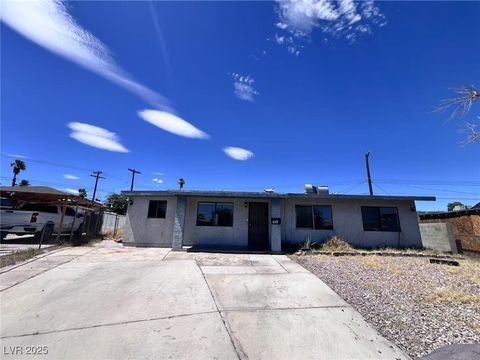
Active
$189,000
2
bds
|
2
ba
|
942
sqft
|
built
1981
425 N Lamb Blvd, Las Vegas, NV 89110
$-409
Cash flow
-11.3%
Cash-on-Cash Return
3.1%
Cap rate
0.6%
Rent to Value Ratio
Active
$255,000
1
bds
|
1
ba
|
692
sqft
|
built
1992
230 E Flamingo Rd, Las Vegas, NV 89169
$-650
Cash flow
-13.3%
Cash-on-Cash Return
2.6%
Cap rate
0.6%
Rent to Value Ratio
Active
$205,000
1
bds
|
1
ba
|
752
sqft
|
built
1991
2200 S Fort Apache Rd, Las Vegas, NV 89117
$-593
Cash flow
-15.1%
Cash-on-Cash Return
2.2%
Cap rate
0.6%
Rent to Value Ratio