Nevada Investment Properties for Sale
Browse homes for sale and investment properties in Nevada. Refine your search by price, property type, or more.
Best cash flowing properties in Nevada
Active
$175,000
2
bds
|
1
ba
|
973
sqft
|
built
1996
1405 S Nellis Blvd, Las Vegas, NV 89104
$-151
Cash flow
-4.5%
Cash-on-Cash Return
4.6%
Cap rate
0.8%
Rent to Value Ratio

Active
$219,888
2
bds
|
2
ba
|
1,029
sqft
|
built
1998
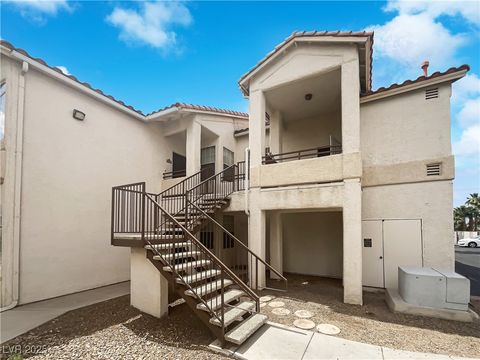
5710 E Tropicana Ave, Las Vegas, NV 89122
$-314
Cash flow
-7.5%
Cash-on-Cash Return
4.0%
Cap rate
0.6%
Rent to Value Ratio
5,259 out of 5,499 properties for sale in Nevada
Limited Results Shown
Create a free account, or log in to reveal all property listings and enjoy the complete experience.
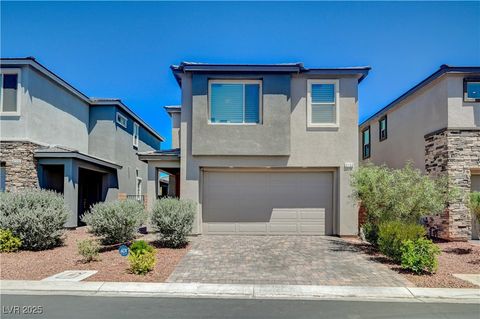
Active
$640,000
4
bds
|
4
ba
|
3,668
sqft
|
built
2007
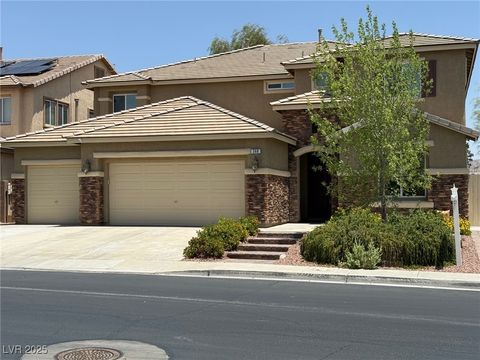
368 Misty Moonlight St, Henderson, NV 89015
$-965
Cash flow
-7.9%
Cash-on-Cash Return
3.9%
Cap rate
0.5%
Rent to Value Ratio

Active
$394,900
3
bds
|
2
ba
|
1,334
sqft
|
built
2004
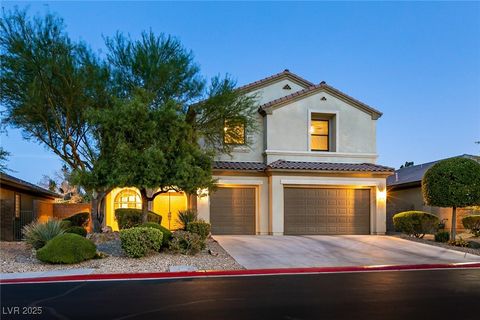
2711 Morning Break Ct, Las Vegas, NV 89142
$-918
Cash flow
-12.1%
Cash-on-Cash Return
2.9%
Cap rate
0.4%
Rent to Value Ratio

Active
$439,500
3
bds
|
3
ba
|
1,517
sqft
|
built
1994
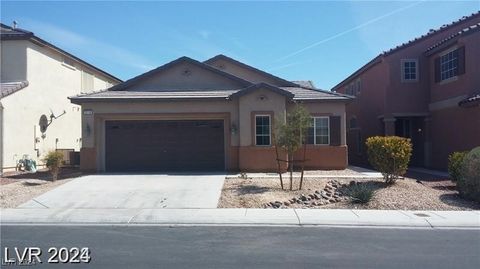
2419 Pebble Springs Ct, Henderson, NV 89074
$-760
Cash flow
-9.0%
Cash-on-Cash Return
3.6%
Cap rate
0.5%
Rent to Value Ratio

Active
$615,000
3
bds
|
3
ba
|
2,401
sqft
|
built
2005
8236 Imperial Lakes St, Las Vegas, NV 89131
$-1,567
Cash flow
-13.3%
Cash-on-Cash Return
2.6%
Cap rate
0.4%
Rent to Value Ratio
Active
$755,000
5
bds
|
4
ba
|
3,732
sqft
|
built
2007
7416 Redhead Dr, North Las Vegas, NV 89084
$-1,785
Cash flow
-12.3%
Cash-on-Cash Return
2.8%
Cap rate
0.5%
Rent to Value Ratio
Active
$439,900
4
bds
|
2
ba
|
1,647
sqft
|
built
2007
5116 Blue Rose St, North Las Vegas, NV 89081
$-1,056
Cash flow
-12.5%
Cash-on-Cash Return
2.8%
Cap rate
0.4%
Rent to Value Ratio

Active
$370,000
3
bds
|
2
ba
|
1,535
sqft
|
built
2004
5605 Midnight Breeze St, North Las Vegas, NV 89081
$-630
Cash flow
-8.9%
Cash-on-Cash Return
3.6%
Cap rate
0.5%
Rent to Value Ratio

Active
$749,900
5
bds
|
3
ba
|
2,855
sqft
|
built
2002
1540 Sabatini Dr, Henderson, NV 89052
$-2,331
Cash flow
-16.2%
Cash-on-Cash Return
1.9%
Cap rate
0.3%
Rent to Value Ratio

Active
$362,900
3
bds
|
3
ba
|
1,598
sqft
|
built
1995
9357 Golden Timber Ln, Las Vegas, NV 89117
$-598
Cash flow
-8.6%
Cash-on-Cash Return
3.7%
Cap rate
0.6%
Rent to Value Ratio

Active
$409,900
4
bds
|
3
ba
|
1,892
sqft
|
built
1965
5617 Reiter Ave, Las Vegas, NV 89108
$-632
Cash flow
-8.0%
Cash-on-Cash Return
3.8%
Cap rate
0.5%
Rent to Value Ratio

Active
$325,000
3
bds
|
2
ba
|
1,263
sqft
|
built
2000
1511 Cardinal Peak Ln, Las Vegas, NV 89144
$-551
Cash flow
-8.8%
Cash-on-Cash Return
3.6%
Cap rate
0.6%
Rent to Value Ratio

Active
$375,000
3
bds
|
2
ba
|
1,401
sqft
|
built
2003
2916 Honeysuckle Ave, North Las Vegas, NV 89031
$-688
Cash flow
-9.6%
Cash-on-Cash Return
3.5%
Cap rate
0.5%
Rent to Value Ratio
Active
$225,000
2
bds
|
2
ba
|
2,040
sqft
|
built
1970
2773 Heritage Ct, Las Vegas, NV 89121
$-384
Cash flow
-8.9%
Cash-on-Cash Return
3.6%
Cap rate
0.7%
Rent to Value Ratio
Active
$1,100,000
5
bds
|
6
ba
|
4,708
sqft
|
built
2007
2717 Mona Lisa St, Henderson, NV 89044
$-1,789
Cash flow
-8.5%
Cash-on-Cash Return
3.7%
Cap rate
0.6%
Rent to Value Ratio
Active
$599,900
5
bds
|
3
ba
|
2,977
sqft
|
built
2017
2409 W Gilmore Ave, North Las Vegas, NV 89032
$-1,301
Cash flow
-11.3%
Cash-on-Cash Return
3.1%
Cap rate
0.5%
Rent to Value Ratio

Active
$380,000
3
bds
|
2
ba
|
1,374
sqft
|
built
2006
5517 Meridian Rain St, North Las Vegas, NV 89031
$-805
Cash flow
-11.1%
Cash-on-Cash Return
3.1%
Cap rate
0.5%
Rent to Value Ratio

Active
$2,100,000
4
bds
|
5
ba
|
4,620
sqft
|
built
1998
7261 Obannon Dr, Las Vegas, NV 89117
$-5,095
Cash flow
-12.7%
Cash-on-Cash Return
2.8%
Cap rate
0.4%
Rent to Value Ratio

Active
$494,900
4
bds
|
3
ba
|
1,718
sqft
|
built
1994
5402 Night Swim Ln, Las Vegas, NV 89113
$-1,268
Cash flow
-13.4%
Cash-on-Cash Return
2.6%
Cap rate
0.4%
Rent to Value Ratio

Active
$269,000
2
bds
|
2
ba
|
962
sqft
|
built
2000
7189 S Durango Dr, Las Vegas, NV 89113
$-601
Cash flow
-11.7%
Cash-on-Cash Return
3.0%
Cap rate
0.6%
Rent to Value Ratio
Active
$426,000
3
bds
|
2
ba
|
1,727
sqft
|
built
2021
6312 Conlon St, North Las Vegas, NV 89081
$-964
Cash flow
-11.8%
Cash-on-Cash Return
3.0%
Cap rate
0.5%
Rent to Value Ratio
Active
$610,000
3
bds
|
3
ba
|
1,782
sqft
|
built
2021
4160 Elegant Chateau St, Las Vegas, NV 89135
$-1,565
Cash flow
-13.4%
Cash-on-Cash Return
2.6%
Cap rate
0.4%
Rent to Value Ratio

Active
$178,500
2
bds
|
1
ba
|
911
sqft
|
built
1984
3811 Desert Marina Dr, Laughlin, NV 89029
$-401
Cash flow
-11.7%
Cash-on-Cash Return
3.0%
Cap rate
0.7%
Rent to Value Ratio

Active
$150,000
2
bds
|
1
ba
|
810
sqft
|
built
1984
3800 Desert Marina Dr, Laughlin, NV 89029
$-326
Cash flow
-11.3%
Cash-on-Cash Return
3.1%
Cap rate
0.8%
Rent to Value Ratio
Active
$150,000
1
bds
|
1
ba
|
723
sqft
|
built
1980
1455 E Katie Ave, Las Vegas, NV 89119
$-361
Cash flow
-12.6%
Cash-on-Cash Return
2.8%
Cap rate
0.7%
Rent to Value Ratio

Active
$620,000
3
bds
|
3
ba
|
2,414
sqft
|
built
2018
8113 Misty Canyon Ave, Las Vegas, NV 89113
$-1,671
Cash flow
-14.1%
Cash-on-Cash Return
2.4%
Cap rate
0.4%
Rent to Value Ratio
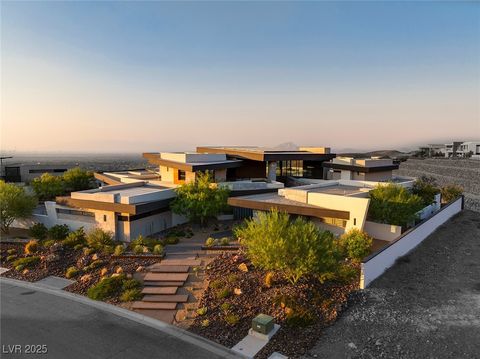
Active
$11,650,000
5
bds
|
6
ba
|
8,438
sqft
|
built
2021
6 Vista Crescent Ct, Henderson, NV 89012
$-59,079
Cash flow
-26.5%
Cash-on-Cash Return
-0.4%
Cap rate
0.0%
Rent to Value Ratio

Active
$557,000
4
bds
|
4
ba
|
2,643
sqft
|
built
2022
5709 Woodchester Ave, Las Vegas, NV 89139
$-1,169
Cash flow
-10.9%
Cash-on-Cash Return
3.2%
Cap rate
0.5%
Rent to Value Ratio
Active
$1,995,000
4
bds
|
5
ba
|
3,459
sqft
|
built
2024
104 Tre Pietre St, Henderson, NV 89011
$-8,076
Cash flow
-21.1%
Cash-on-Cash Return
0.8%
Cap rate
0.2%
Rent to Value Ratio
Active
$475,000
3
bds
|
3
ba
|
2,407
sqft
|
built
1987
6529 Bradford Ln, Las Vegas, NV 89108
$-883
Cash flow
-9.7%
Cash-on-Cash Return
3.4%
Cap rate
0.5%
Rent to Value Ratio
Active
$515,000
4
bds
|
3
ba
|
1,984
sqft
|
built
2023
4133 Golden Fleece Ave, Las Vegas, NV 89141
$-636
Cash flow
-6.4%
Cash-on-Cash Return
4.2%
Cap rate
0.6%
Rent to Value Ratio
Active
$766,800
4
bds
|
3
ba
|
2,785
sqft
|
built
2002
8134 Maddingley Ave, Las Vegas, NV 89117
$-949
Cash flow
-6.5%
Cash-on-Cash Return
4.2%
Cap rate
0.6%
Rent to Value Ratio
Active
$6,800,000
5
bds
|
6
ba
|
6,017
sqft
|
built
2022
1 Costa Del Sol Ct, Henderson, NV 89011
$-29,329
Cash flow
-22.5%
Cash-on-Cash Return
0.5%
Cap rate
0.1%
Rent to Value Ratio
Active
$398,000
3
bds
|
2
ba
|
1,839
sqft
|
built
2021
4960 Honey Locust Dr, Pahrump, NV 89061
$-593
Cash flow
-7.8%
Cash-on-Cash Return
3.9%
Cap rate
0.6%
Rent to Value Ratio
Active
$3,790,000
4
bds
|
6
ba
|
4,469
sqft
|
built
2022
2827 Richmar Ave, Henderson, NV 89074
$-15,785
Cash flow
-21.7%
Cash-on-Cash Return
0.7%
Cap rate
0.1%
Rent to Value Ratio
Active
$389,000
3
bds
|
2
ba
|
1,906
sqft
|
built
1985
2063 Avalon Dr, Laughlin, NV 89029
$-627
Cash flow
-8.4%
Cash-on-Cash Return
3.7%
Cap rate
0.5%
Rent to Value Ratio
Active
$10,990,000
6
bds
|
9
ba
|
11,861
sqft
|
built
2006
5 Wood Creek Ct, Las Vegas, NV 89141
$-51,675
Cash flow
-24.5%
Cash-on-Cash Return
0.0%
Cap rate
0.1%
Rent to Value Ratio
Active
$383,000
3
bds
|
2
ba
|
1,070
sqft
|
built
1988
7405 Saybrook Point Dr, Las Vegas, NV 89128
$-685
Cash flow
-9.3%
Cash-on-Cash Return
3.5%
Cap rate
0.5%
Rent to Value Ratio
Active
$899,900
5
bds
|
6
ba
|
4,964
sqft
|
built
2000
8809 Barium Rock Ave, Las Vegas, NV 89143
$-2,100
Cash flow
-12.2%
Cash-on-Cash Return
2.9%
Cap rate
0.4%
Rent to Value Ratio