Nevada Investment Properties for Sale
Browse homes for sale and investment properties in Nevada. Refine your search by price, property type, or more.
Best cash flowing properties in Nevada
Active
$265,000
2
bds
|
2
ba
|
1,048
sqft
|
built
1978
4338 Caliente St, Las Vegas, NV 89119
$-162
Cash flow
-3.2%
Cash-on-Cash Return
4.9%
Cap rate
0.7%
Rent to Value Ratio
Active
$160,000
1
bds
|
1
ba
|
671
sqft
|
built
1990
6800 E Lake Mead Blvd, Las Vegas, NV 89156
$-359
Cash flow
-11.7%
Cash-on-Cash Return
3.0%
Cap rate
0.6%
Rent to Value Ratio
7,839 out of 8,192 properties for sale in Nevada
Limited Results Shown
Create a free account, or log in to reveal all property listings and enjoy the complete experience.
Active under contract
$774,998
4
bds
|
3
ba
|
2,315
sqft
|
built
1998
10613 Turquoise Valley Dr, Las Vegas, NV 89144
$-2,332
Cash flow
-15.7%
Cash-on-Cash Return
2.1%
Cap rate
0.3%
Rent to Value Ratio
Active
$245,000
2
bds
|
2
ba
|
934
sqft
|
built
1997
7885 W Flamingo Rd, Las Vegas, NV 89147
$-654
Cash flow
-13.9%
Cash-on-Cash Return
2.5%
Cap rate
0.6%
Rent to Value Ratio
Active
$1,189,000
5
bds
|
5
ba
|
4,658
sqft
|
built
2000
2445 Ping Dr, Henderson, NV 89074
$-3,611
Cash flow
-15.8%
Cash-on-Cash Return
2.0%
Cap rate
0.3%
Rent to Value Ratio
Active
$420,000
3
bds
|
3
ba
|
2,280
sqft
|
built
2020
3048 Eaglesfield Ave, North Las Vegas, NV 89081
$-917
Cash flow
-11.4%
Cash-on-Cash Return
3.1%
Cap rate
0.5%
Rent to Value Ratio
Active
$445,000
3
bds
|
2
ba
|
1,530
sqft
|
built
2005
173 Calm Morning Ave, Henderson, NV 89002
$-981
Cash flow
-11.5%
Cash-on-Cash Return
3.0%
Cap rate
0.4%
Rent to Value Ratio

Active
$319,999
3
bds
|
2
ba
|
1,399
sqft
|
built
2002
81 Diamond Bar Rd, Pahrump, NV 89048
$-507
Cash flow
-8.3%
Cash-on-Cash Return
3.8%
Cap rate
0.5%
Rent to Value Ratio
Active
$475,000
4
bds
|
3
ba
|
2,283
sqft
|
built
2004
8059 Wards Ferry St, Las Vegas, NV 89139
$-929
Cash flow
-10.2%
Cash-on-Cash Return
3.3%
Cap rate
0.5%
Rent to Value Ratio
Pending
$1,150,000
4
bds
|
3
ba
|
2,984
sqft
|
built
2002
3091 Via Del Corso, Henderson, NV 89052
$-2,185
Cash flow
-9.9%
Cash-on-Cash Return
3.4%
Cap rate
0.5%
Rent to Value Ratio
Active
$488,000
3
bds
|
3
ba
|
2,034
sqft
|
built
1996
1934 Kings Beach Ave, Las Vegas, NV 89123
$-887
Cash flow
-9.5%
Cash-on-Cash Return
3.5%
Cap rate
0.5%
Rent to Value Ratio
Active
$494,900
3
bds
|
3
ba
|
2,034
sqft
|
built
2007
722 Chepstow Ave, Las Vegas, NV 89178
$-1,035
Cash flow
-10.9%
Cash-on-Cash Return
3.2%
Cap rate
0.4%
Rent to Value Ratio
Active
$660,000
4
bds
|
3
ba
|
2,350
sqft
|
built
2000
129 Sapodilla Ln, Las Vegas, NV 89144
$-1,768
Cash flow
-14.0%
Cash-on-Cash Return
2.5%
Cap rate
0.4%
Rent to Value Ratio
Active
$699,999
5
bds
|
3
ba
|
3,222
sqft
|
built
2009
640 Finch Island Ave, Henderson, NV 89015
$-842
Cash flow
-6.3%
Cash-on-Cash Return
4.2%
Cap rate
0.6%
Rent to Value Ratio

Pending
$445,000
3
bds
|
3
ba
|
2,129
sqft
|
built
1995
9021 Canyon Magic Ave, Las Vegas, NV 89129
$-807
Cash flow
-9.5%
Cash-on-Cash Return
3.5%
Cap rate
0.5%
Rent to Value Ratio
Active
$715,000
5
bds
|
3
ba
|
2,779
sqft
|
built
2018
2947 Caxton Grove Dr, Henderson, NV 89052
$-1,735
Cash flow
-12.7%
Cash-on-Cash Return
2.8%
Cap rate
0.4%
Rent to Value Ratio
Active
$730,000
4
bds
|
3
ba
|
2,756
sqft
|
built
2001
10381 Walking View Ct, Las Vegas, NV 89135
$-1,698
Cash flow
-12.1%
Cash-on-Cash Return
2.9%
Cap rate
0.4%
Rent to Value Ratio

Active
$410,000
4
bds
|
3
ba
|
1,618
sqft
|
built
2005
11164 African Sunset St, Henderson, NV 89052
$-739
Cash flow
-9.4%
Cash-on-Cash Return
3.5%
Cap rate
0.5%
Rent to Value Ratio
Active
$419,900
3
bds
|
3
ba
|
1,764
sqft
|
built
2015
5634 Bishop Flowers St, Las Vegas, NV 89130
$-946
Cash flow
-11.8%
Cash-on-Cash Return
3.0%
Cap rate
0.5%
Rent to Value Ratio

Active
$247,777
2
bds
|
2
ba
|
1,136
sqft
|
built
1990
928 Rockview Dr, Las Vegas, NV 89128
$-497
Cash flow
-10.5%
Cash-on-Cash Return
3.3%
Cap rate
0.6%
Rent to Value Ratio

Active
$974,999
5
bds
|
5
ba
|
4,834
sqft
|
built
2019
6257 Olde Lockford Ct, Las Vegas, NV 89139
$-2,113
Cash flow
-11.3%
Cash-on-Cash Return
3.1%
Cap rate
0.5%
Rent to Value Ratio
Active
$224,900
2
bds
|
1
ba
|
957
sqft
|
built
1995
7950 W Flamingo Rd, Las Vegas, NV 89147
$-393
Cash flow
-9.1%
Cash-on-Cash Return
3.6%
Cap rate
0.6%
Rent to Value Ratio
Pending
$485,000
3
bds
|
2
ba
|
1,703
sqft
|
built
2002
208 Lynbrook St, Henderson, NV 89012
$-961
Cash flow
-10.3%
Cash-on-Cash Return
3.3%
Cap rate
0.5%
Rent to Value Ratio
Active
$390,000
3
bds
|
2
ba
|
1,370
sqft
|
built
2001
5353 Dandelion Ct, North Las Vegas, NV 89031
$-796
Cash flow
-10.6%
Cash-on-Cash Return
3.2%
Cap rate
0.5%
Rent to Value Ratio
Pending
$505,000
4
bds
|
2
ba
|
2,033
sqft
|
built
1990
1185 Ponce De Leon Ave, Las Vegas, NV 89123
$-789
Cash flow
-8.2%
Cash-on-Cash Return
3.8%
Cap rate
0.5%
Rent to Value Ratio
Active
$925,000
4
bds
|
3
ba
|
3,151
sqft
|
built
2000
812 Eaglewood Dr, Las Vegas, NV 89144
$-2,413
Cash flow
-13.6%
Cash-on-Cash Return
2.5%
Cap rate
0.4%
Rent to Value Ratio
Active
$615,000
4
bds
|
3
ba
|
2,468
sqft
|
built
1990
950 Eagle Mountain Dr, Las Vegas, NV 89123
$-945
Cash flow
-8.0%
Cash-on-Cash Return
3.8%
Cap rate
0.5%
Rent to Value Ratio
Active
$495,000
4
bds
|
3
ba
|
1,971
sqft
|
built
2021
637 Honesty Ct, Henderson, NV 89011
$-1,166
Cash flow
-12.3%
Cash-on-Cash Return
2.9%
Cap rate
0.5%
Rent to Value Ratio
Active
$790,000
5
bds
|
3
ba
|
3,004
sqft
|
built
1979
6995 Rogers St, Las Vegas, NV 89118
$-2,199
Cash flow
-14.5%
Cash-on-Cash Return
2.3%
Cap rate
0.3%
Rent to Value Ratio
Active
$533,000
3
bds
|
3
ba
|
2,114
sqft
|
built
2015
7613 Pulpit Rock Ct, Las Vegas, NV 89166
$-1,368
Cash flow
-13.4%
Cash-on-Cash Return
2.6%
Cap rate
0.4%
Rent to Value Ratio
Active
$500,000
5
bds
|
2
ba
|
2,430
sqft
|
built
1978
5268 Caspian Dr, Las Vegas, NV 89118
$-839
Cash flow
-8.8%
Cash-on-Cash Return
3.7%
Cap rate
0.5%
Rent to Value Ratio
Active
$8,250,000
4
bds
|
6
ba
|
6,917
sqft
|
built
2017
1491 Reims Dr, Henderson, NV 89012
$-34,143
Cash flow
-21.6%
Cash-on-Cash Return
0.7%
Cap rate
0.1%
Rent to Value Ratio

Active
$630,000
3
bds
|
4
ba
|
2,034
sqft
|
built
2022
728 Omaggio Pl, Henderson, NV 89011
$-1,293
Cash flow
-10.7%
Cash-on-Cash Return
3.2%
Cap rate
0.5%
Rent to Value Ratio

Active
$569,888
3
bds
|
2
ba
|
1,988
sqft
|
built
1941
650 Arizona St, Boulder City, NV 89005
$-1,070
Cash flow
-9.8%
Cash-on-Cash Return
3.4%
Cap rate
0.4%
Rent to Value Ratio
Active
$605,000
4
bds
|
3
ba
|
2,467
sqft
|
built
2020
8432 Alder Rain St, Las Vegas, NV 89113
$-1,575
Cash flow
-13.6%
Cash-on-Cash Return
2.6%
Cap rate
0.4%
Rent to Value Ratio
Active
$680,000
4
bds
|
4
ba
|
3,122
sqft
|
built
2022
9993 Birch Knoll Ave, Las Vegas, NV 89166
$-1,615
Cash flow
-12.4%
Cash-on-Cash Return
2.8%
Cap rate
0.5%
Rent to Value Ratio
Active
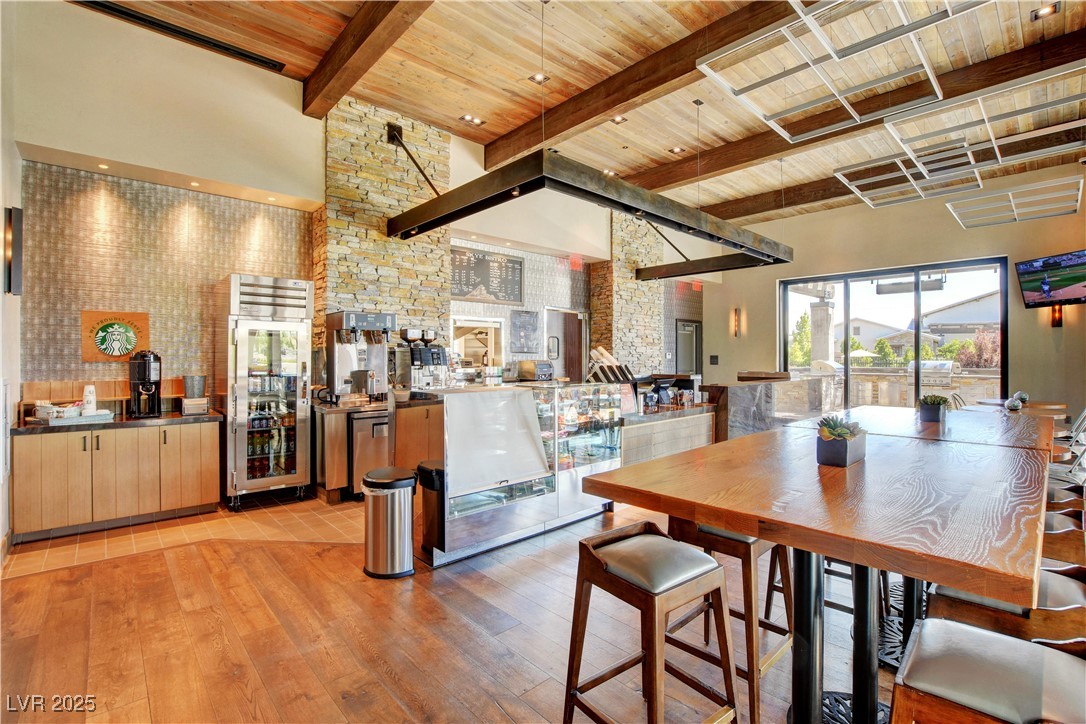
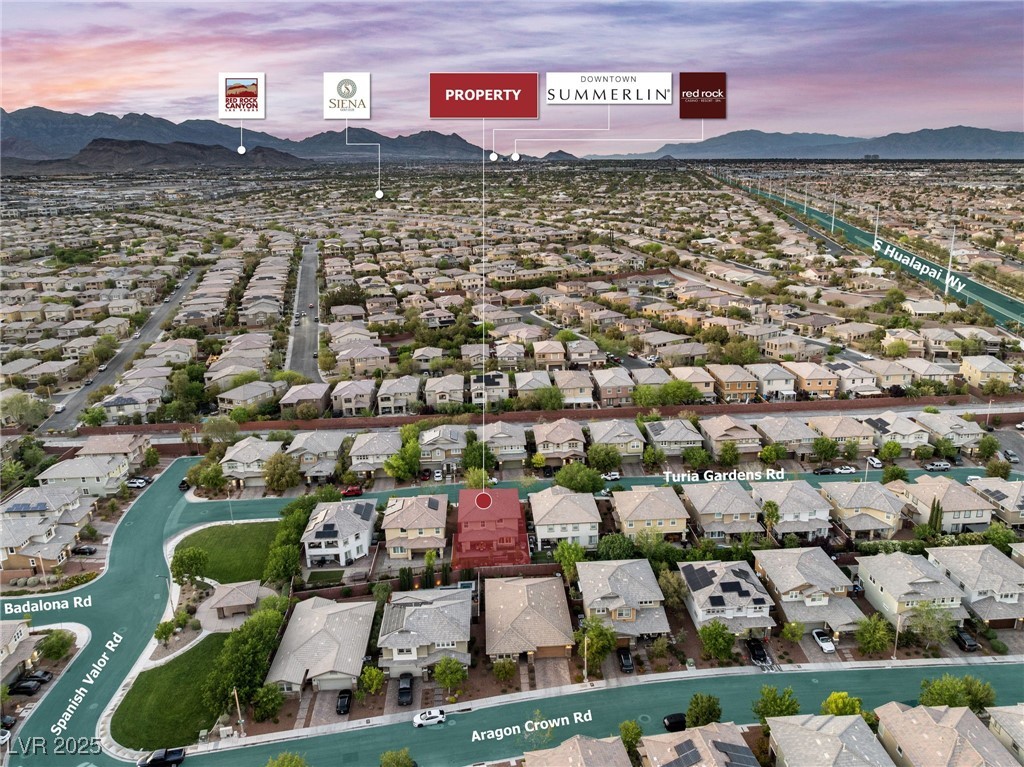
$722,000
3
bds
|
3
ba
|
2,395
sqft
|
built
2013
10305 Turia Gardens Rd, Las Vegas, NV 89135
$-1,367
Cash flow
-9.9%
Cash-on-Cash Return
3.4%
Cap rate
0.5%
Rent to Value Ratio
Active
$265,000
2
bds
|
2
ba
|
1,048
sqft
|
built
1978
4338 Caliente St, Las Vegas, NV 89119
$-162
Cash flow
-3.2%
Cash-on-Cash Return
4.9%
Cap rate
0.7%
Rent to Value Ratio
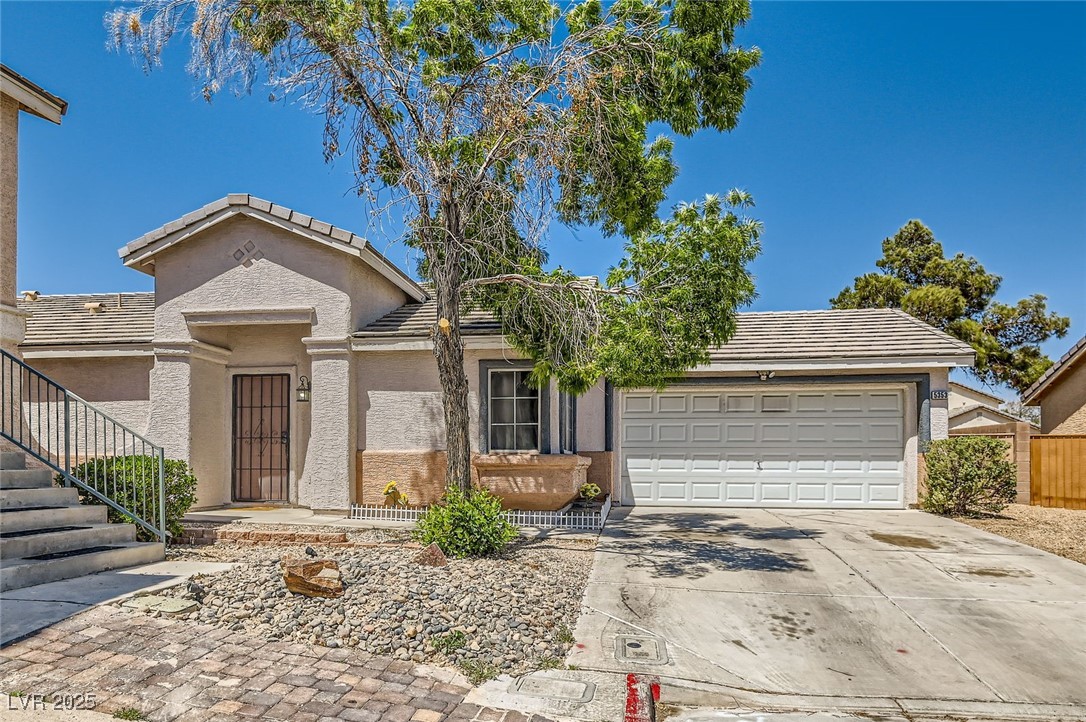
Active
$385,000
3
bds
|
3
ba
|
1,520
sqft
|
built
2022
6952 Skyline Blue St, North Las Vegas, NV 89086
$-577
Cash flow
-7.8%
Cash-on-Cash Return
3.9%
Cap rate
0.6%
Rent to Value Ratio

Active under contract
$440,000
4
bds
|
3
ba
|
2,302
sqft
|
built
2007
5060 Blue Rose St, North Las Vegas, NV 89081
$-929
Cash flow
-11.0%
Cash-on-Cash Return
3.1%
Cap rate
0.5%
Rent to Value Ratio
Active
$160,000
1
bds
|
1
ba
|
671
sqft
|
built
1990
6800 E Lake Mead Blvd, Las Vegas, NV 89156
$-359
Cash flow
-11.7%
Cash-on-Cash Return
3.0%
Cap rate
0.6%
Rent to Value Ratio

Active
$369,900
3
bds
|
3
ba
|
1,665
sqft
|
built
2022
2765 Frosted Teal Ave, North Las Vegas, NV 89086
$-932
Cash flow
-13.1%
Cash-on-Cash Return
2.7%
Cap rate
0.5%
Rent to Value Ratio