Nevada Investment Properties for Sale
Browse homes for sale and investment properties in Nevada. Refine your search by price, property type, or more.
Best cash flowing properties in Nevada
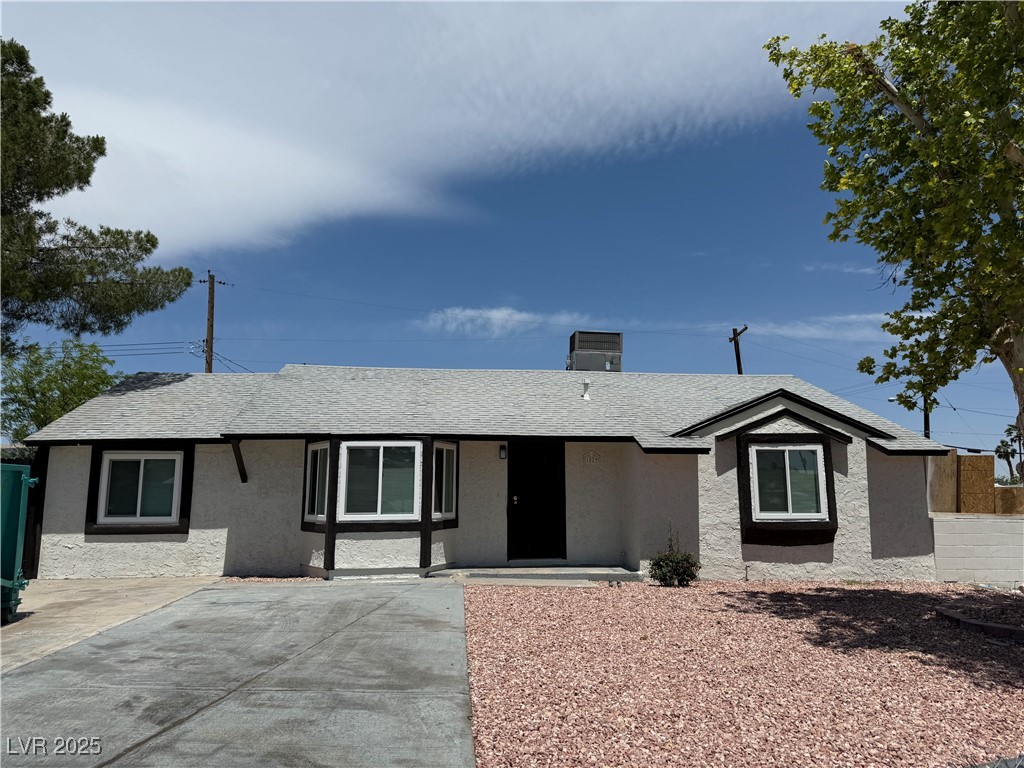
Active
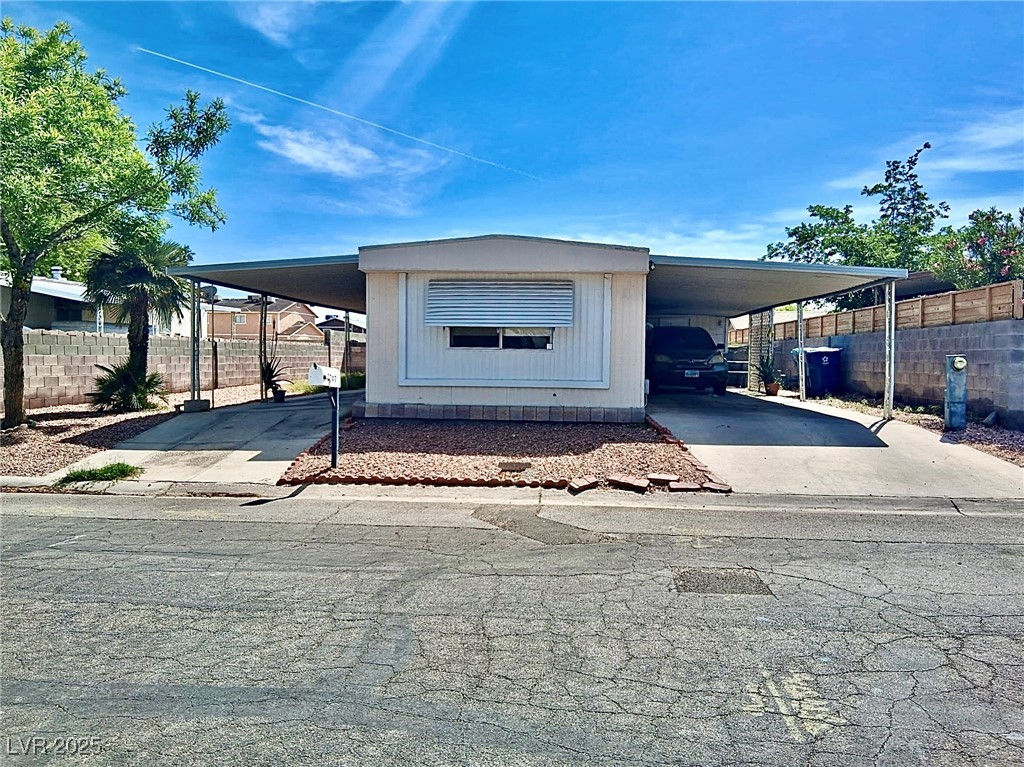
$229,000
2
bds
|
2
ba
|
986
sqft
|
built
1973
438 Las Casitas Way, Las Vegas, NV 89121
$-81
Cash flow
-1.8%
Cash-on-Cash Return
5.3%
Cap rate
0.8%
Rent to Value Ratio
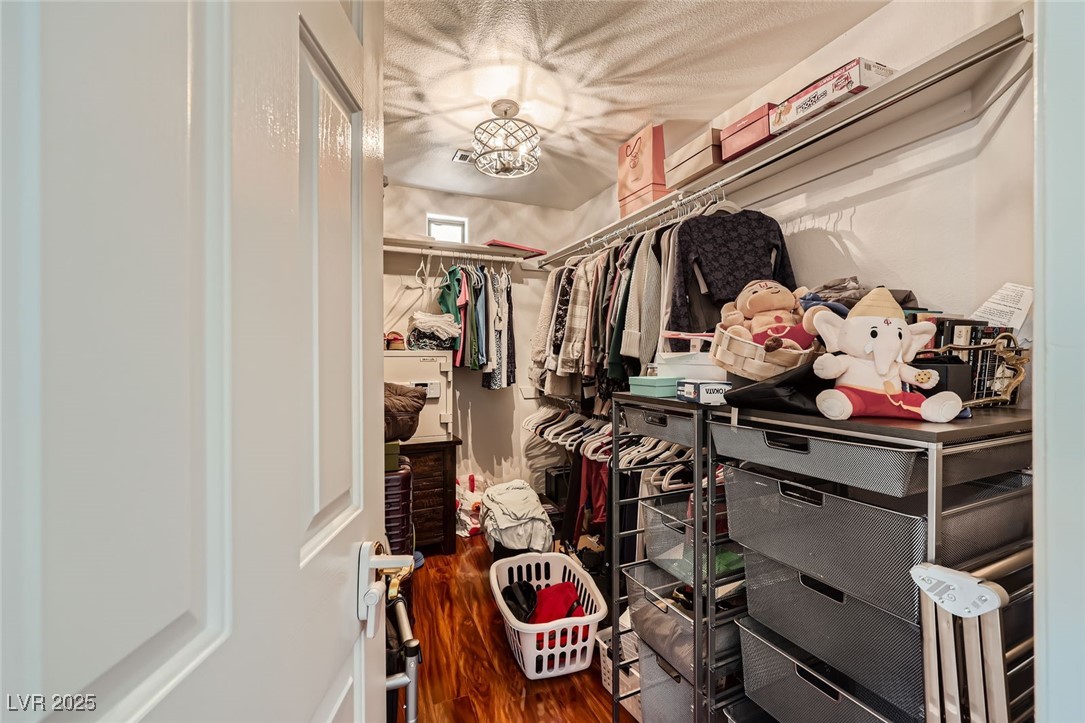
Active under contract
$237,000
2
bds
|
1
ba
|
952
sqft
|
built
1977
3747 Pecan Ln, Las Vegas, NV 89115
$-111
Cash flow
-2.4%
Cash-on-Cash Return
5.1%
Cap rate
0.6%
Rent to Value Ratio
7,777 out of 8,128 properties for sale in Nevada
Limited Results Shown
Create a free account, or log in to reveal all property listings and enjoy the complete experience.
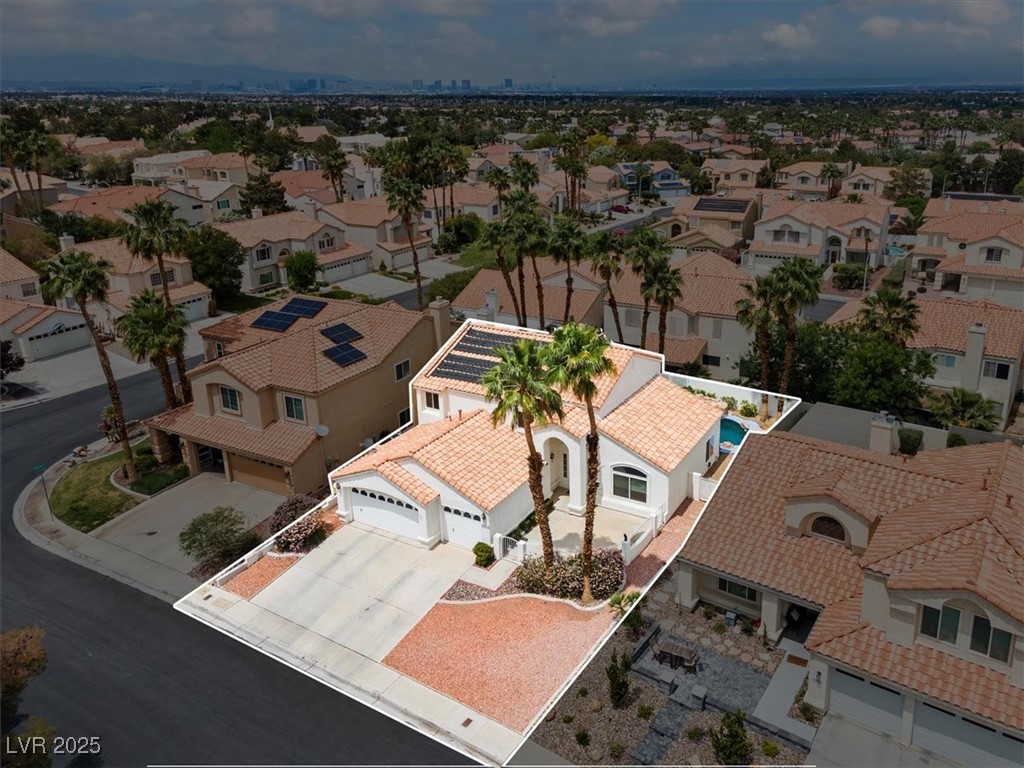
Active
$760,000
4
bds
|
3
ba
|
2,881
sqft
|
built
1995
7800 Four Seasons Dr, Las Vegas, NV 89129
$-1,467
Cash flow
-10.1%
Cash-on-Cash Return
3.4%
Cap rate
0.5%
Rent to Value Ratio
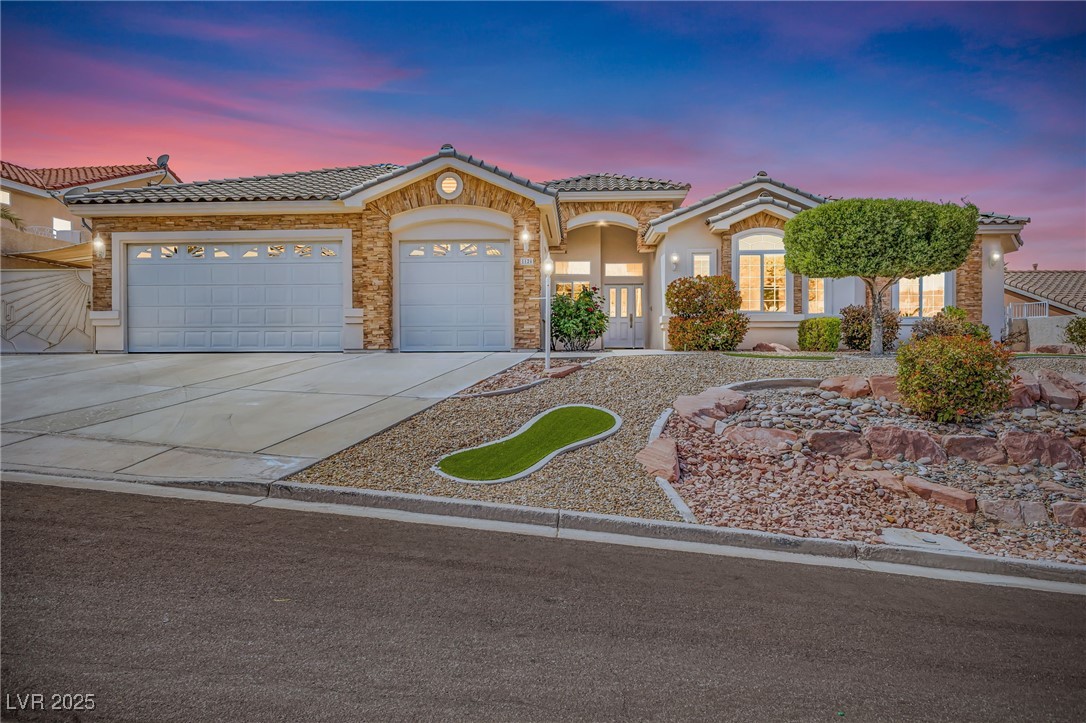
Active
$525,000
3
bds
|
2
ba
|
1,744
sqft
|
built
2000
3029 Paseo Hills Way, Henderson, NV 89052
$-1,287
Cash flow
-12.8%
Cash-on-Cash Return
2.7%
Cap rate
0.4%
Rent to Value Ratio
Active under contract
$385,000
2
bds
|
3
ba
|
1,609
sqft
|
built
2001
10798 Muscari Way, Las Vegas, NV 89141
$-675
Cash flow
-9.1%
Cash-on-Cash Return
3.6%
Cap rate
0.5%
Rent to Value Ratio
Active
$2,198,000
4
bds
|
5
ba
|
3,775
sqft
|
built
2023
11895 Skyline Arch Ct, Las Vegas, NV 89138
$-7,838
Cash flow
-18.6%
Cash-on-Cash Return
1.4%
Cap rate
0.3%
Rent to Value Ratio

Active under contract
$334,900
2
bds
|
2
ba
|
1,661
sqft
|
built
1990
3637 Laguna Del Sol Dr, Las Vegas, NV 89121
$-590
Cash flow
-9.2%
Cash-on-Cash Return
3.6%
Cap rate
0.6%
Rent to Value Ratio
Active
$548,888
3
bds
|
2
ba
|
1,894
sqft
|
built
2004
8836 Martin Downs Pl, Las Vegas, NV 89131
$-1,364
Cash flow
-13.0%
Cash-on-Cash Return
2.7%
Cap rate
0.4%
Rent to Value Ratio
Active
$982,000
6
bds
|
5
ba
|
3,935
sqft
|
built
2002
2647 Hourglass Dr, Henderson, NV 89052
$-2,523
Cash flow
-13.4%
Cash-on-Cash Return
2.6%
Cap rate
0.4%
Rent to Value Ratio
Pending
$329,900
3
bds
|
1
ba
|
1,085
sqft
|
built
1954
1829 E Saint Louis Ave, Las Vegas, NV 89104
$-787
Cash flow
-12.4%
Cash-on-Cash Return
2.8%
Cap rate
0.4%
Rent to Value Ratio
Active
$229,000
2
bds
|
2
ba
|
986
sqft
|
built
1973
438 Las Casitas Way, Las Vegas, NV 89121
$-81
Cash flow
-1.8%
Cash-on-Cash Return
5.3%
Cap rate
0.8%
Rent to Value Ratio
Active
$659,000
3
bds
|
3
ba
|
2,373
sqft
|
built
2001
521 Dawn Cove Dr, Henderson, NV 89052
$-1,343
Cash flow
-10.6%
Cash-on-Cash Return
3.2%
Cap rate
0.5%
Rent to Value Ratio
Active
$600,000
4
bds
|
3
ba
|
2,443
sqft
|
built
1992
2024 Spruce Brook Dr, Henderson, NV 89074
$-1,153
Cash flow
-10.0%
Cash-on-Cash Return
3.4%
Cap rate
0.5%
Rent to Value Ratio
Active
$916,900
3
bds
|
5
ba
|
2,828
sqft
|
built
2002
1124 Whistle Ct, Henderson, NV 89011
$-2,261
Cash flow
-12.9%
Cash-on-Cash Return
2.7%
Cap rate
0.4%
Rent to Value Ratio
Active
$710,000
4
bds
|
3
ba
|
2,600
sqft
|
built
2017
8318 Sonora Del Sol St, Las Vegas, NV 89113
$-1,707
Cash flow
-12.5%
Cash-on-Cash Return
2.8%
Cap rate
0.5%
Rent to Value Ratio
Active
$334,900
0
bds
|
1
ba
|
537
sqft
|
built
2007
3726 Las Vegas Blvd S, Las Vegas, NV 89158
$-1,254
Cash flow
-19.5%
Cash-on-Cash Return
1.2%
Cap rate
0.6%
Rent to Value Ratio
Active
$519,900
4
bds
|
3
ba
|
2,144
sqft
|
built
2003
9460 Magnificent Ave, Las Vegas, NV 89148
$-1,402
Cash flow
-14.1%
Cash-on-Cash Return
2.4%
Cap rate
0.4%
Rent to Value Ratio
Active
$928,000
4
bds
|
3
ba
|
2,390
sqft
|
built
2020
12413 Alpenglow Ct, Las Vegas, NV 89138
$-2,318
Cash flow
-13.0%
Cash-on-Cash Return
2.7%
Cap rate
0.4%
Rent to Value Ratio
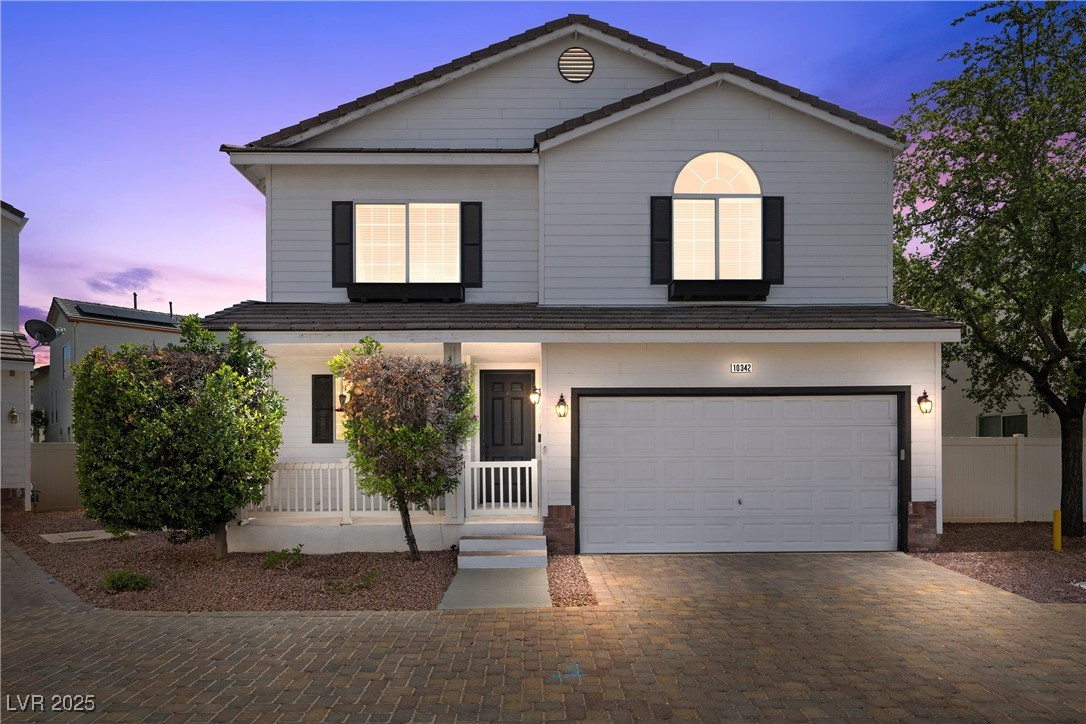
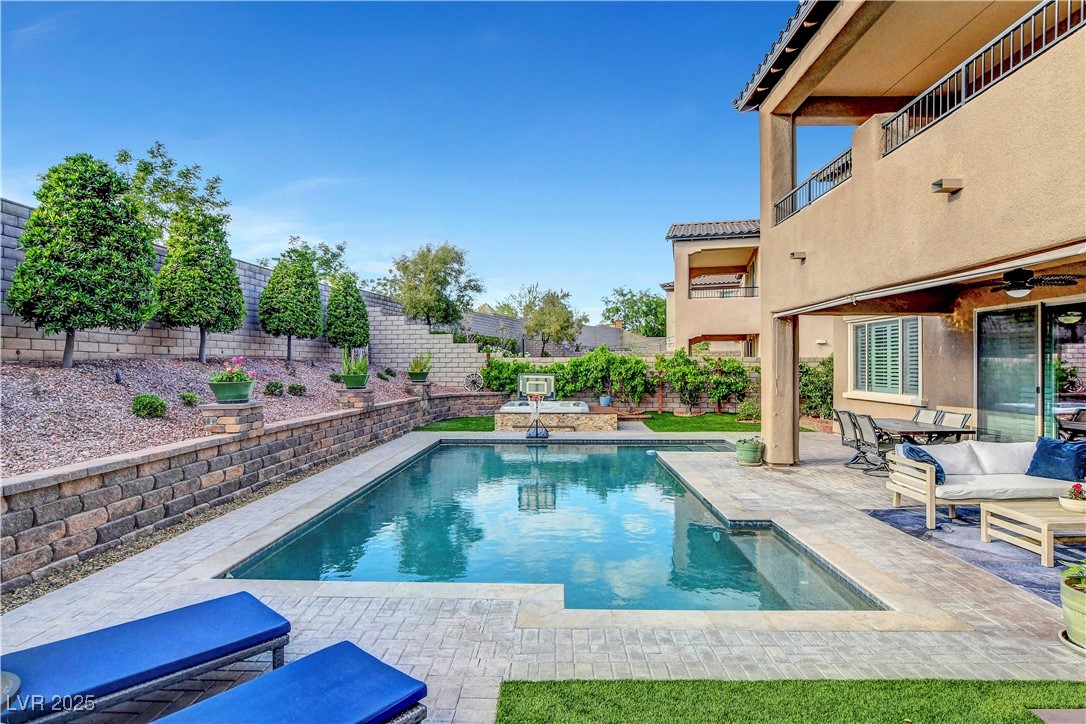
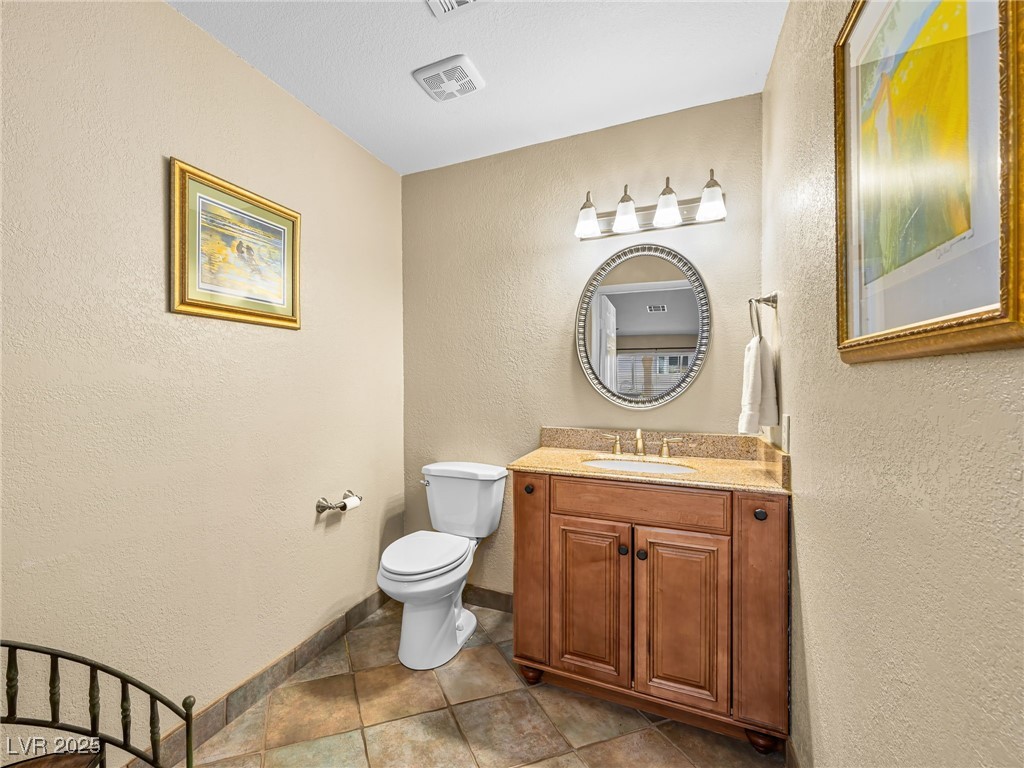
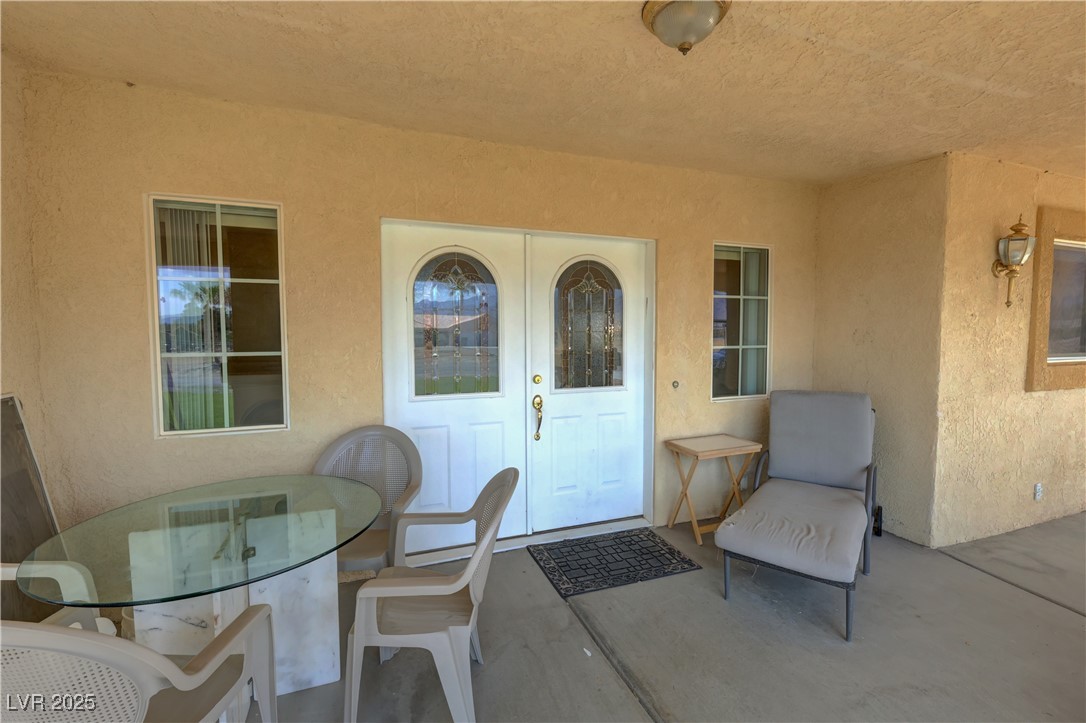
Active
$468,000
4
bds
|
3
ba
|
1,735
sqft
|
built
2001
10342 Cherry Brook St, Las Vegas, NV 89183
$-753
Cash flow
-8.4%
Cash-on-Cash Return
3.7%
Cap rate
0.5%
Rent to Value Ratio
Active under contract
$1,149,999
4
bds
|
4
ba
|
2,989
sqft
|
built
2016
305 Rezzo St, Las Vegas, NV 89138
$-3,146
Cash flow
-14.3%
Cash-on-Cash Return
2.4%
Cap rate
0.4%
Rent to Value Ratio
Active
$765,000
4
bds
|
3
ba
|
2,640
sqft
|
built
1992
2212 Marble Gorge Dr, Las Vegas, NV 89117
$-1,880
Cash flow
-12.8%
Cash-on-Cash Return
2.7%
Cap rate
0.4%
Rent to Value Ratio
Active
$399,900
3
bds
|
3
ba
|
2,023
sqft
|
built
2002
3110 National Ave, Pahrump, NV 89048
$-524
Cash flow
-6.8%
Cash-on-Cash Return
4.1%
Cap rate
0.6%
Rent to Value Ratio
Active
$799,900
4
bds
|
3
ba
|
2,822
sqft
|
built
2017
8440 Footpath St, Las Vegas, NV 89166
$-2,077
Cash flow
-13.5%
Cash-on-Cash Return
2.6%
Cap rate
0.4%
Rent to Value Ratio
Active
$445,000
3
bds
|
3
ba
|
1,470
sqft
|
built
1988
2046 Waverly Cir, Henderson, NV 89014
$-967
Cash flow
-11.3%
Cash-on-Cash Return
3.1%
Cap rate
0.4%
Rent to Value Ratio
Active
$725,000
3
bds
|
3
ba
|
3,125
sqft
|
built
1977
2017 Plaza De Cielo, Las Vegas, NV 89102
$-1,657
Cash flow
-11.9%
Cash-on-Cash Return
2.9%
Cap rate
0.5%
Rent to Value Ratio
Active
$630,000
4
bds
|
3
ba
|
2,313
sqft
|
built
1997
7404 Dry Corral Ln, Las Vegas, NV 89113
$-1,272
Cash flow
-10.5%
Cash-on-Cash Return
3.3%
Cap rate
0.4%
Rent to Value Ratio
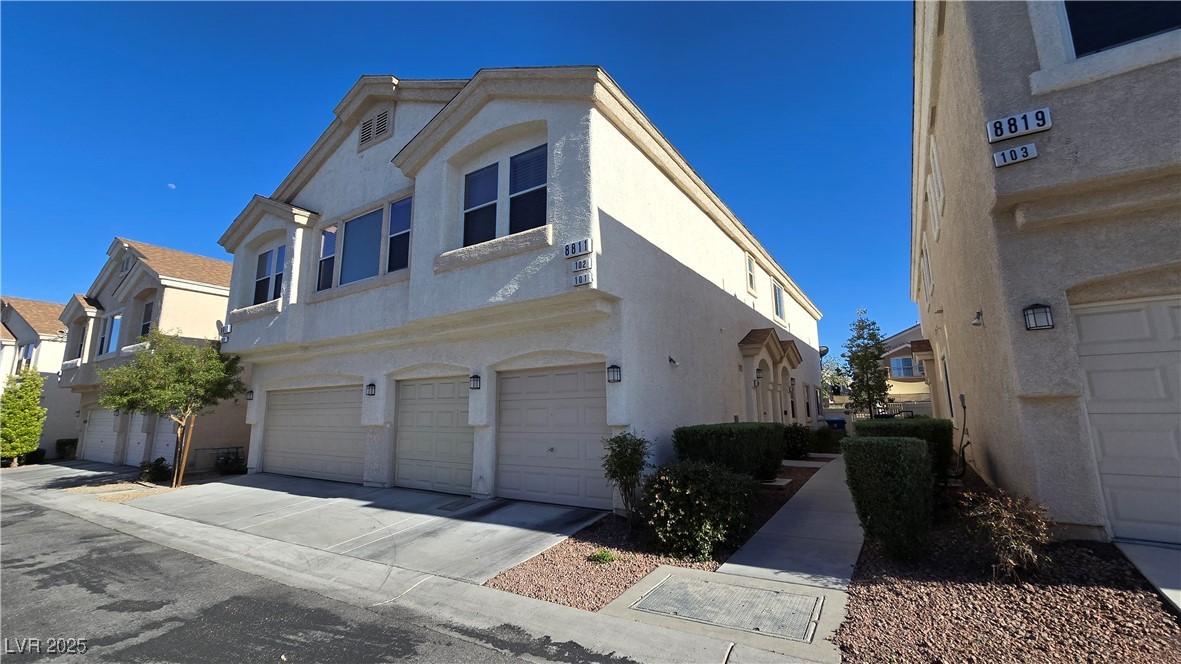
Active
$305,500
2
bds
|
2
ba
|
1,060
sqft
|
built
2006
8811 Tomnitz Ave, Las Vegas, NV 89178
$-413
Cash flow
-7.1%
Cash-on-Cash Return
4.1%
Cap rate
0.6%
Rent to Value Ratio
Pending
$290,000
3
bds
|
1
ba
|
1,008
sqft
|
built
1955
1643 E St, Las Vegas, NV 89106
$-390
Cash flow
-7.0%
Cash-on-Cash Return
4.1%
Cap rate
0.5%
Rent to Value Ratio
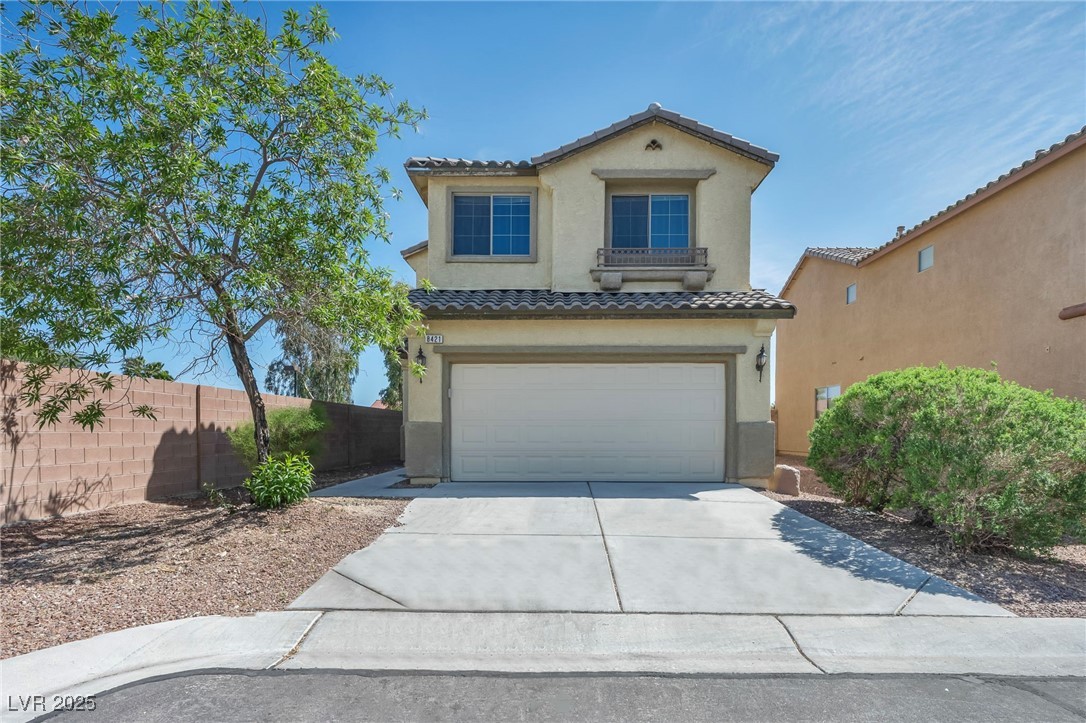
Active
$430,000
5
bds
|
3
ba
|
2,118
sqft
|
built
2004
8421 Cheerful Brook Ave, Las Vegas, NV 89143
$-781
Cash flow
-9.5%
Cash-on-Cash Return
3.5%
Cap rate
0.5%
Rent to Value Ratio
Active
$509,999
3
bds
|
3
ba
|
1,671
sqft
|
built
1999
10400 Beachwalk Pl, Las Vegas, NV 89144
$-936
Cash flow
-9.6%
Cash-on-Cash Return
3.5%
Cap rate
0.5%
Rent to Value Ratio
Active
$610,000
4
bds
|
3
ba
|
2,266
sqft
|
built
1988
4732 Illustrious St, Las Vegas, NV 89147
$-749
Cash flow
-6.4%
Cash-on-Cash Return
4.2%
Cap rate
0.6%
Rent to Value Ratio
Pending
$775,888
4
bds
|
3
ba
|
2,419
sqft
|
built
1989
8320 Opal Cove Dr, Las Vegas, NV 89128
$-2,093
Cash flow
-14.1%
Cash-on-Cash Return
2.4%
Cap rate
0.4%
Rent to Value Ratio
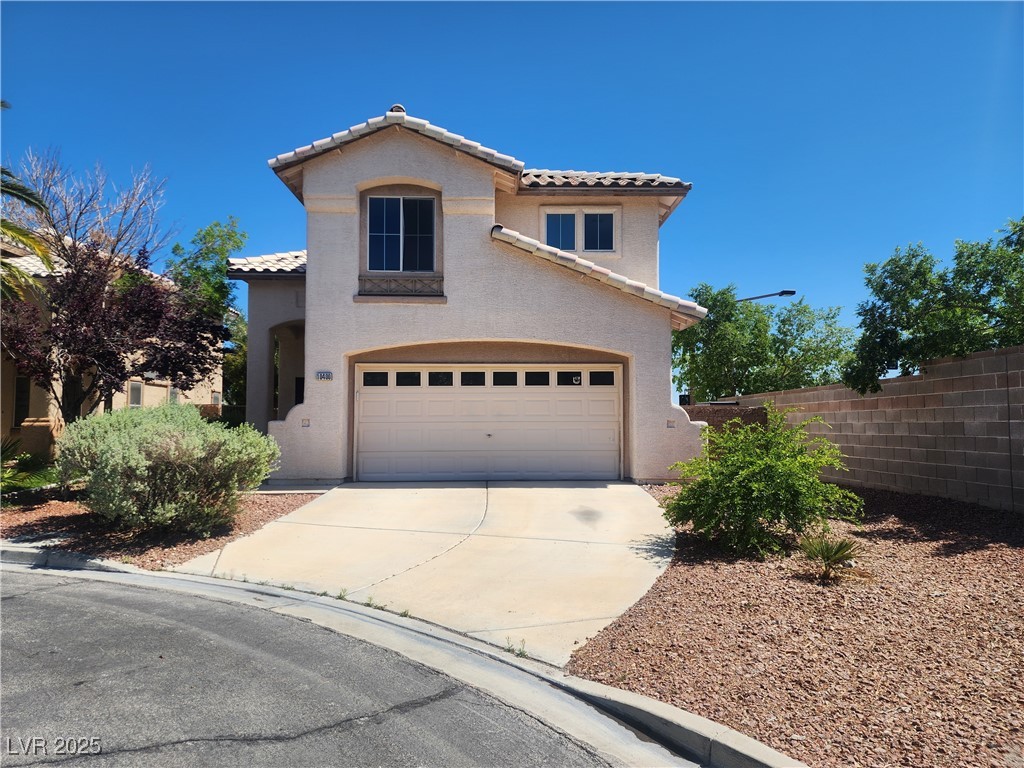
Active
$355,000
3
bds
|
3
ba
|
1,387
sqft
|
built
2002
9958 Fragile Fields St, Las Vegas, NV 89183
$-617
Cash flow
-9.1%
Cash-on-Cash Return
3.6%
Cap rate
0.5%
Rent to Value Ratio
Active
$839,000
4
bds
|
3
ba
|
2,709
sqft
|
built
1993
2909 Sterling Cove Dr, Las Vegas, NV 89128
$-2,085
Cash flow
-13.0%
Cash-on-Cash Return
2.7%
Cap rate
0.4%
Rent to Value Ratio

Active
$120,000
1
bds
|
1
ba
|
671
sqft
|
built
1970
1420 Vegas Valley Dr, Las Vegas, NV 89169
$-275
Cash flow
-12.0%
Cash-on-Cash Return
2.9%
Cap rate
0.8%
Rent to Value Ratio
Active under contract
$237,000
2
bds
|
1
ba
|
952
sqft
|
built
1977
3747 Pecan Ln, Las Vegas, NV 89115
$-111
Cash flow
-2.4%
Cash-on-Cash Return
5.1%
Cap rate
0.6%
Rent to Value Ratio
Active
$190,000
1
bds
|
1
ba
|
722
sqft
|
built
1996
1150 N Buffalo Dr, Las Vegas, NV 89128
$-409
Cash flow
-11.2%
Cash-on-Cash Return
3.1%
Cap rate
0.6%
Rent to Value Ratio
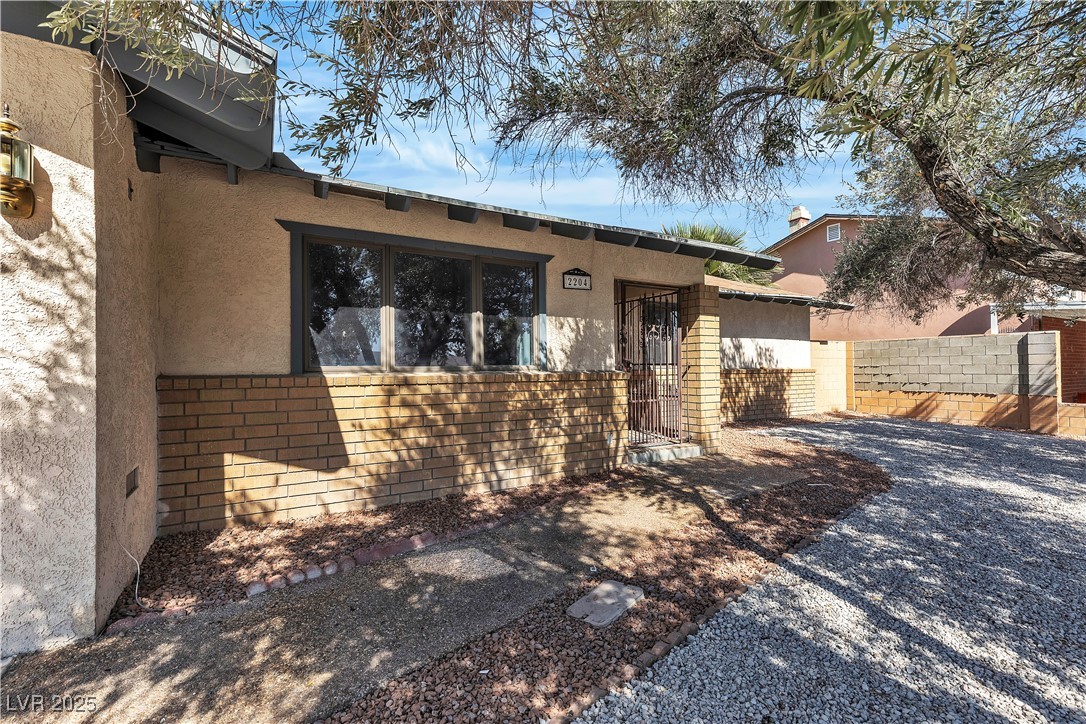
Active
$435,000
5
bds
|
3
ba
|
2,098
sqft
|
built
1976
2204 Monterey Ave, Las Vegas, NV 89104
$-793
Cash flow
-9.5%
Cash-on-Cash Return
3.5%
Cap rate
0.5%
Rent to Value Ratio
Active under contract
$774,998
4
bds
|
3
ba
|
2,315
sqft
|
built
1998
10613 Turquoise Valley Dr, Las Vegas, NV 89144
$-2,332
Cash flow
-15.7%
Cash-on-Cash Return
2.1%
Cap rate
0.3%
Rent to Value Ratio
Active
$245,000
2
bds
|
2
ba
|
934
sqft
|
built
1997
7885 W Flamingo Rd, Las Vegas, NV 89147
$-654
Cash flow
-13.9%
Cash-on-Cash Return
2.5%
Cap rate
0.6%
Rent to Value Ratio
Active
$1,189,000
5
bds
|
5
ba
|
4,658
sqft
|
built
2000
2445 Ping Dr, Henderson, NV 89074
$-3,611
Cash flow
-15.8%
Cash-on-Cash Return
2.0%
Cap rate
0.3%
Rent to Value Ratio
Active
$420,000
3
bds
|
3
ba
|
2,280
sqft
|
built
2020
3048 Eaglesfield Ave, North Las Vegas, NV 89081
$-917
Cash flow
-11.4%
Cash-on-Cash Return
3.1%
Cap rate
0.5%
Rent to Value Ratio