Oakland Park, FL Investment Properties for Sale
Browse homes for sale and investment properties in Oakland Park, FL. Refine your search by price, property type, or more.
Best cash flowing properties in Oakland Park, FL
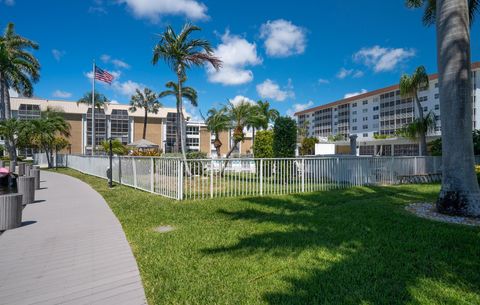
Active
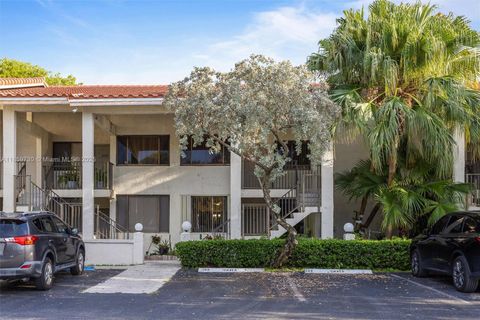
$225,000
2
bds
|
2
ba
|
1,250
sqft
|
built
1982
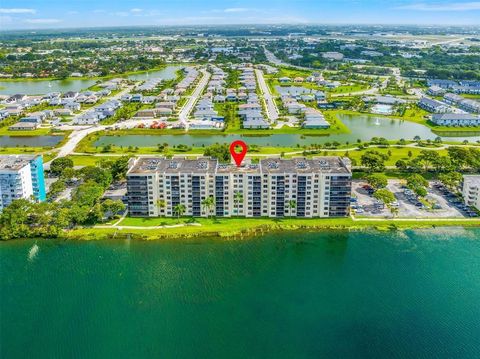
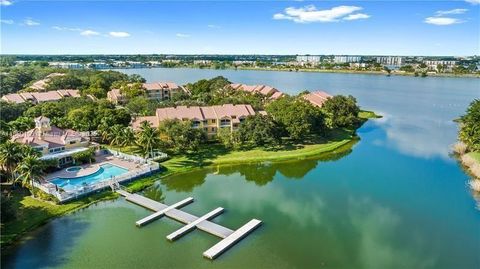
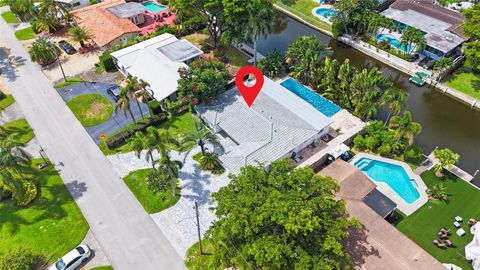
105 Lake Emerald Dr, Oakland Park, FL 33309
$43
Cash flow
1.0%
Cash-on-Cash Return
6.4%
Cap rate
1.4%
Rent to Value Ratio
Active
$559,000
3
bds
|
2
ba
|
1,312
sqft
|
built
1963
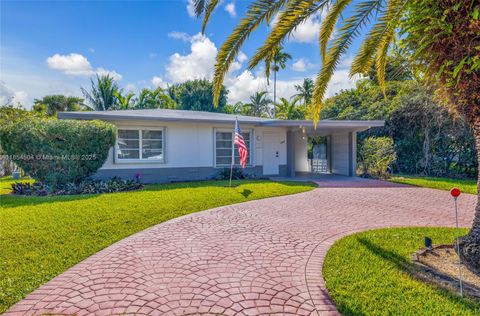
2020 NW 33rd Ct, Oakland Park, FL 33309
$-77
Cash flow
-0.7%
Cash-on-Cash Return
6.0%
Cap rate
0.8%
Rent to Value Ratio
227 out of 253 properties for sale in Oakland Park, FL
Limited Results Shown
Create a free account, or log in to reveal all property listings and enjoy the complete experience.
Active
$739,000
bds
|
0
ba
|
2,716
sqft
|
built
1976
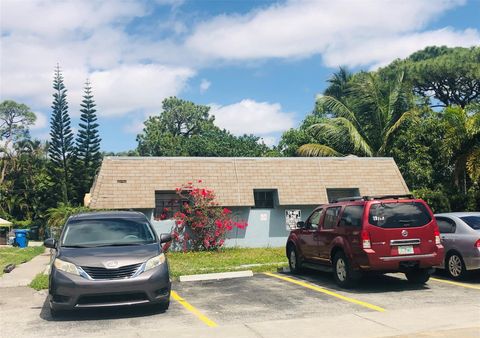
575 NW 41st St, Oakland Park, FL 33309
$-3,536
Cash flow
-25.0%
Cash-on-Cash Return
0.4%
Cap rate
0.2%
Rent to Value Ratio
Active
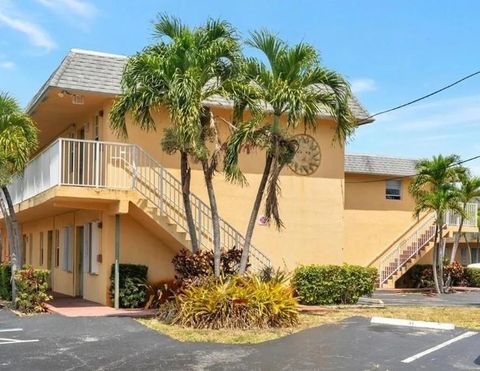
$229,800
2
bds
|
2
ba
|
920
sqft
|
built
1986
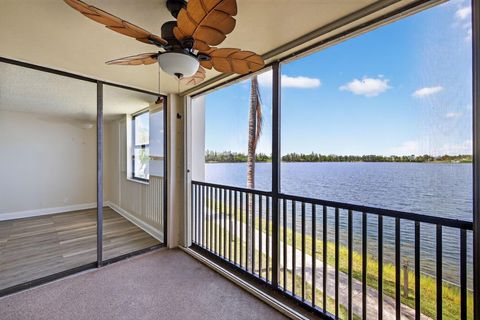
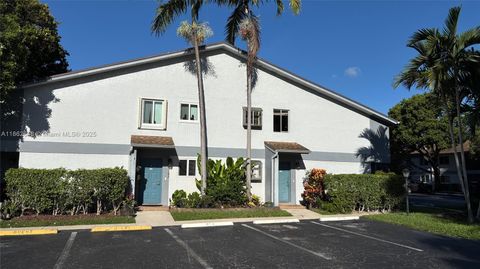
117 Lake Emerald Dr, Oakland Park, FL 33309
$-609
Cash flow
-13.8%
Cash-on-Cash Return
3.0%
Cap rate
0.9%
Rent to Value Ratio
Active
$950,000
4
bds
|
3
ba
|
2,050
sqft
|
built
1963
1301 NE 42nd St, Oakland Park, FL 33334
$-2,243
Cash flow
-12.3%
Cash-on-Cash Return
3.3%
Cap rate
0.6%
Rent to Value Ratio
Active
$465,000
3
bds
|
2
ba
|
1,956
sqft
|
built
1962
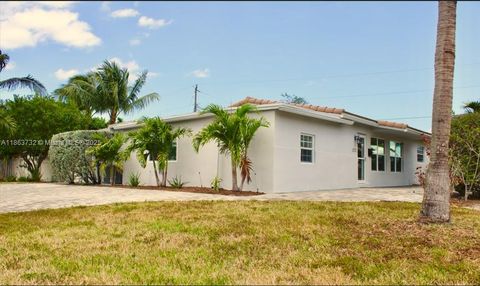
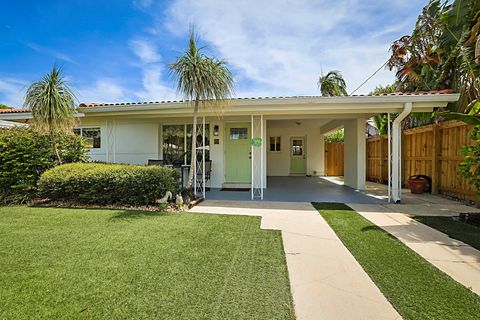
4221 NW 16th Ave, Oakland Park, FL 33309
$-107
Cash flow
-1.2%
Cash-on-Cash Return
5.9%
Cap rate
0.8%
Rent to Value Ratio
Active
$839,000
3
bds
|
3
ba
|
1,717
sqft
|
built
1959
4120 NE 20th Ave, Oakland Park, FL 33308
$-1,364
Cash flow
-8.5%
Cash-on-Cash Return
4.2%
Cap rate
0.6%
Rent to Value Ratio
Active
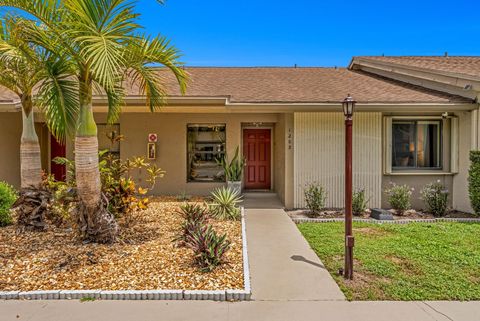
$238,000
2
bds
|
1
ba
|
900
sqft
|
built
1984
2761 S Oakland Forest Dr, Oakland Park, FL 33309
$-533
Cash flow
-11.7%
Cash-on-Cash Return
3.5%
Cap rate
0.8%
Rent to Value Ratio

Active
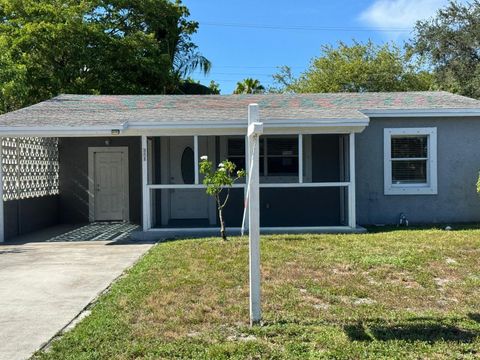
$175,000
2
bds
|
1
ba
|
609
sqft
|
built
1978
5162 NE 6th Ave, Oakland Park, FL 33334
$-394
Cash flow
-11.7%
Cash-on-Cash Return
3.4%
Cap rate
1.0%
Rent to Value Ratio
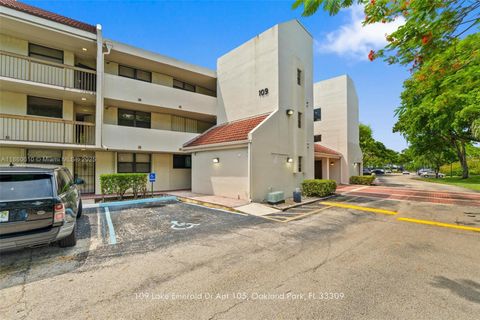
Active
$247,000
2
bds
|
2
ba
|
1,120
sqft
|
built
1981
109 Lake Emerald Dr, Oakland Park, FL 33309
$-719
Cash flow
-15.2%
Cash-on-Cash Return
2.7%
Cap rate
0.9%
Rent to Value Ratio
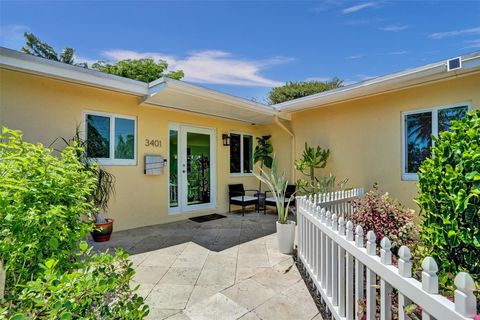
Active
$649,000
3
bds
|
3
ba
|
1,716
sqft
|
built
1953
3401 NE 17th Ave, Oakland Park, FL 33334
$-965
Cash flow
-7.8%
Cash-on-Cash Return
4.4%
Cap rate
0.6%
Rent to Value Ratio
Active
$295,000
2
bds
|
2
ba
|
978
sqft
|
built
1986
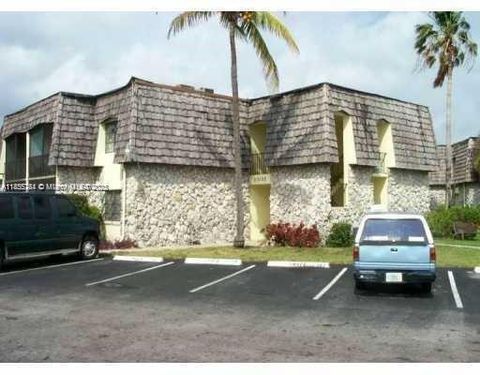
3072 S Oakland Forest Dr, Oakland Park, FL 33309
$-583
Cash flow
-10.3%
Cash-on-Cash Return
3.8%
Cap rate
0.7%
Rent to Value Ratio
Active
$330,000
2
bds
|
2
ba
|
912
sqft
|
built
1972
3050 NE 16th Ave, Oakland Park, FL 33334
$-1,501
Cash flow
-23.7%
Cash-on-Cash Return
0.7%
Cap rate
0.7%
Rent to Value Ratio
Active
$269,999
2
bds
|
2
ba
|
1,241
sqft
|
built
1991
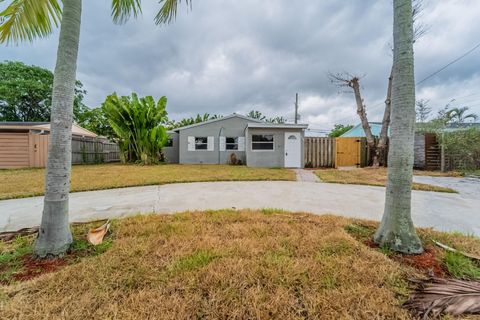
2647 NW 33rd St, Oakland Park, FL 33309
$-532
Cash flow
-10.3%
Cash-on-Cash Return
3.8%
Cap rate
0.9%
Rent to Value Ratio
Active
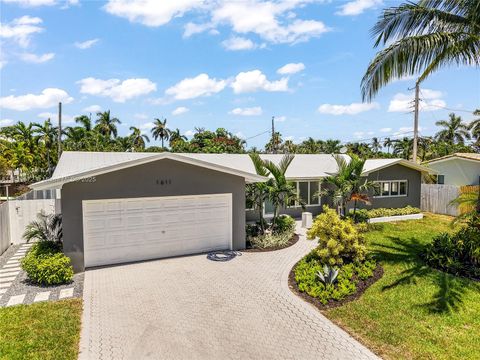
$1,000,000
3
bds
|
2
ba
|
1,792
sqft
|
built
1961
1611 NE 40th Pl, Oakland Park, FL 33334
$-3,705
Cash flow
-19.3%
Cash-on-Cash Return
1.7%
Cap rate
0.4%
Rent to Value Ratio

Active
$145,000
1
bds
|
1
ba
|
760
sqft
|
built
1974
3101 Oakland Shores Dr, Oakland Park, FL 33309
$-158
Cash flow
-5.7%
Cash-on-Cash Return
4.8%
Cap rate
1.1%
Rent to Value Ratio
Active
$885,000
3
bds
|
2
ba
|
1,267
sqft
|
built
1958
4410 NE 15th Ter, Oakland Park, FL 33334
$-2,523
Cash flow
-14.9%
Cash-on-Cash Return
2.7%
Cap rate
0.6%
Rent to Value Ratio
Active
$724,900
3
bds
|
2
ba
|
1,468
sqft
|
built
1959
4687 NE 18th Ave, Oakland Park, FL 33334
$-2,188
Cash flow
-15.7%
Cash-on-Cash Return
2.5%
Cap rate
0.5%
Rent to Value Ratio
Active
$500,000
2
bds
|
1
ba
|
1,212
sqft
|
built
1957
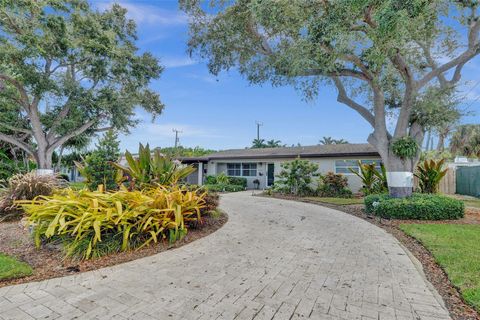
846 NE 34th St, Oakland Park, FL 33334
$-897
Cash flow
-9.4%
Cash-on-Cash Return
4.0%
Cap rate
0.6%
Rent to Value Ratio
Active
$451,000
4
bds
|
2
ba
|
1,208
sqft
|
built
1959
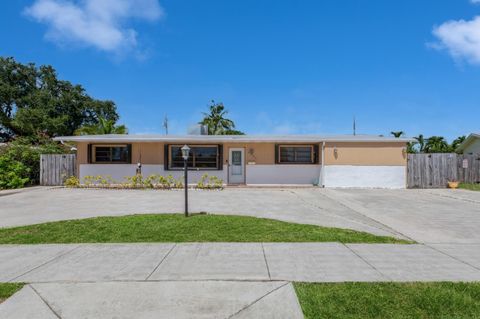
620 NE 57th St, Oakland Park, FL 33334
$-1,059
Cash flow
-12.3%
Cash-on-Cash Return
3.3%
Cap rate
0.6%
Rent to Value Ratio
Active
$380,000
3
bds
|
3
ba
|
1,504
sqft
|
built
2009
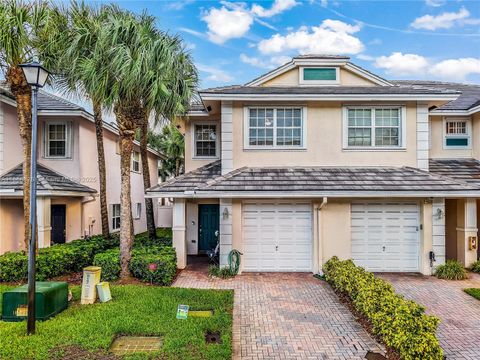
3087 NW 30th Pl, Oakland Park, FL 33311
$-786
Cash flow
-10.8%
Cash-on-Cash Return
3.7%
Cap rate
0.7%
Rent to Value Ratio
Active
$435,000
3
bds
|
2
ba
|
1,048
sqft
|
built
1960
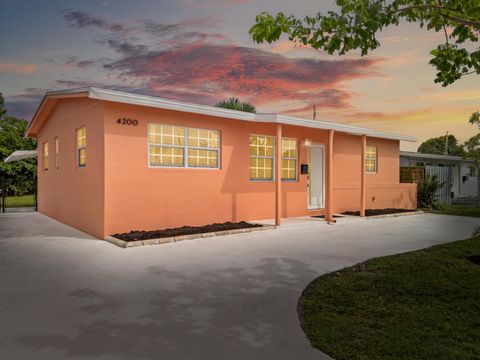
4200 NW 12th Ave, Oakland Park, FL 33309
$-840
Cash flow
-10.1%
Cash-on-Cash Return
3.8%
Cap rate
0.6%
Rent to Value Ratio
Active
$219,900
2
bds
|
2
ba
|
1,075
sqft
|
built
1988
3300 NW 46th St, Oakland Park, FL 33309
$-550
Cash flow
-13.0%
Cash-on-Cash Return
3.1%
Cap rate
0.9%
Rent to Value Ratio
Active
$140,000
2
bds
|
1
ba
|
650
sqft
|
built
1972
4061 N Dixie Hwy, Oakland Park, FL 33334
$-78
Cash flow
-2.9%
Cash-on-Cash Return
5.5%
Cap rate
1.3%
Rent to Value Ratio
Active
$283,000
2
bds
|
2
ba
|
960
sqft
|
built
1985
3086 S Oakland Forest Dr, Oakland Park, FL 33309
$-672
Cash flow
-12.4%
Cash-on-Cash Return
3.3%
Cap rate
0.8%
Rent to Value Ratio
Active
$375,000
2
bds
|
1
ba
|
1,105
sqft
|
built
1961
341 NW 55th St, Oakland Park, FL 33309
$-654
Cash flow
-9.1%
Cash-on-Cash Return
4.1%
Cap rate
0.7%
Rent to Value Ratio
Active
$399,000
3
bds
|
3
ba
|
1,514
sqft
|
built
2010
3257 NW 31st Ter, Oakland Park, FL 33309
$-944
Cash flow
-12.3%
Cash-on-Cash Return
3.3%
Cap rate
0.7%
Rent to Value Ratio
Active
$750,000
3
bds
|
2
ba
|
1,769
sqft
|
built
1993
3264 NW 22nd Ave, Oakland Park, FL 33309
$-1,747
Cash flow
-12.2%
Cash-on-Cash Return
3.4%
Cap rate
0.5%
Rent to Value Ratio
Active
$195,000
1
bds
|
2
ba
|
775
sqft
|
built
1966
4025 N Federal Hwy, Oakland Park, FL 33308
$-789
Cash flow
-21.1%
Cash-on-Cash Return
1.3%
Cap rate
0.9%
Rent to Value Ratio
Active
$209,900
2
bds
|
2
ba
|
975
sqft
|
built
1974
120 Royal Park Dr, Oakland Park, FL 33309
$-853
Cash flow
-21.2%
Cash-on-Cash Return
1.3%
Cap rate
1.0%
Rent to Value Ratio
Active
$279,000
2
bds
|
2
ba
|
960
sqft
|
built
1985
3060 S Oakland Forest Dr, Oakland Park, FL 33309
$-854
Cash flow
-16.0%
Cash-on-Cash Return
2.5%
Cap rate
0.8%
Rent to Value Ratio
Active
$865,000
4
bds
|
2
ba
|
2,042
sqft
|
built
1959
4351 NE 15th Ter, Oakland Park, FL 33334
$-1,723
Cash flow
-10.4%
Cash-on-Cash Return
3.8%
Cap rate
0.7%
Rent to Value Ratio
Active
$179,000
2
bds
|
2
ba
|
1,075
sqft
|
built
1987
3100 NW 46th St, Oakland Park, FL 33309
$-364
Cash flow
-10.6%
Cash-on-Cash Return
3.7%
Cap rate
1.2%
Rent to Value Ratio
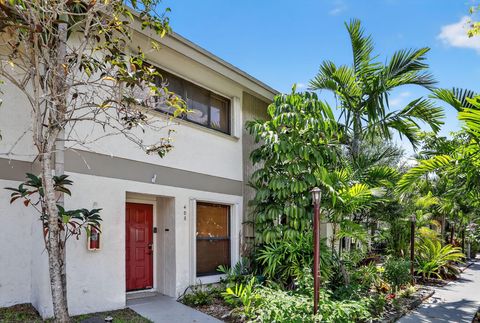
Active
$199,000
2
bds
|
2
ba
|
920
sqft
|
built
1981
109 Lake Emerald Dr, Oakland Park, FL 33309
$-875
Cash flow
-22.9%
Cash-on-Cash Return
0.9%
Cap rate
0.9%
Rent to Value Ratio
Active
$169,999
2
bds
|
1
ba
|
850
sqft
|
built
1965
2990 NE 16th Ave, Oakland Park, FL 33334
$-296
Cash flow
-9.1%
Cash-on-Cash Return
4.1%
Cap rate
1.2%
Rent to Value Ratio
Active
$169,900
1
bds
|
1
ba
|
760
sqft
|
built
1974
3123 Oakland Shores Dr, Oakland Park, FL 33309
$-433
Cash flow
-13.3%
Cash-on-Cash Return
3.1%
Cap rate
0.9%
Rent to Value Ratio
Active
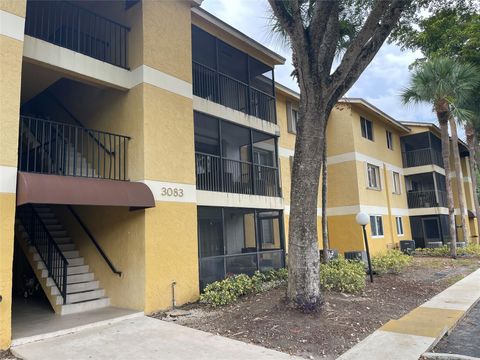
$235,000
3
bds
|
2
ba
|
1,150
sqft
|
built
1986
3083 N Oakland Forest Dr, Oakland Park, FL 33309
$-202
Cash flow
-4.5%
Cash-on-Cash Return
5.1%
Cap rate
0.9%
Rent to Value Ratio
Active
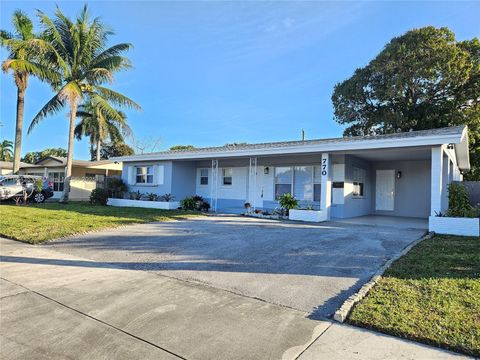
$575,000
4
bds
|
3
ba
|
1,840
sqft
|
built
1956
770 NW 38th St, Oakland Park, FL 33309
$-1,681
Cash flow
-15.3%
Cash-on-Cash Return
2.6%
Cap rate
0.5%
Rent to Value Ratio
Active
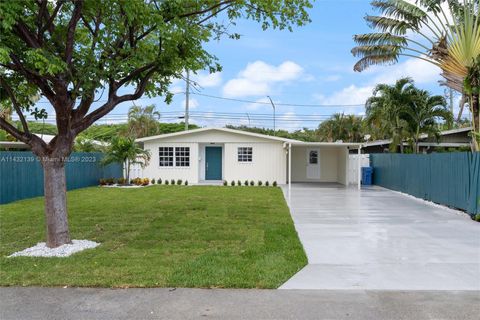
$467,000
3
bds
|
2
ba
|
1,563
sqft
|
built
1972
377 NW 49th St, Oakland Park, FL 33309
$-413
Cash flow
-4.6%
Cash-on-Cash Return
5.1%
Cap rate
0.8%
Rent to Value Ratio
Active
$420,000
3
bds
|
1
ba
|
966
sqft
|
built
1957
121 NW 53rd Ct, Oakland Park, FL 33309
$-435
Cash flow
-5.4%
Cash-on-Cash Return
4.9%
Cap rate
0.8%
Rent to Value Ratio