Ocala, FL Investment Properties for Sale
Browse homes for sale and investment properties in Ocala, FL. Refine your search by price, property type, or more.
Best cash flowing properties in Ocala, FL
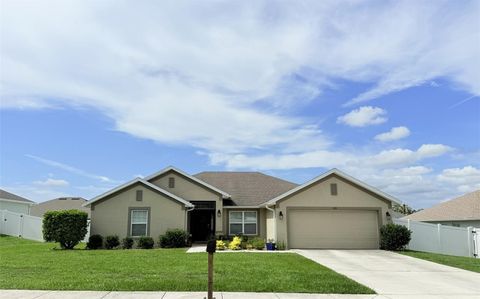
Active
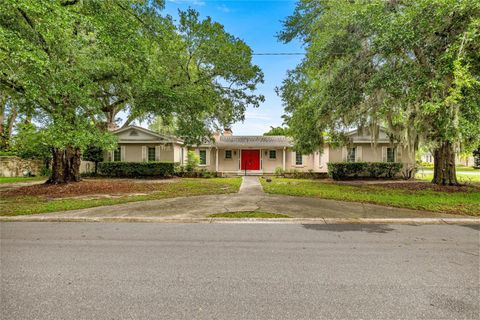
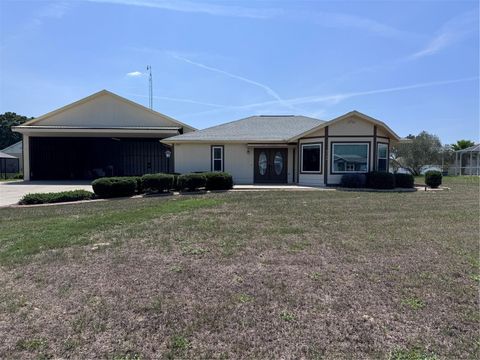
$250,000
3
bds
|
3
ba
|
2,792
sqft
|
built
1962
4025 NE 18th St, Ocala, FL 34470
$263
Cash flow
5.5%
Cash-on-Cash Return
7.4%
Cap rate
1.0%
Rent to Value Ratio
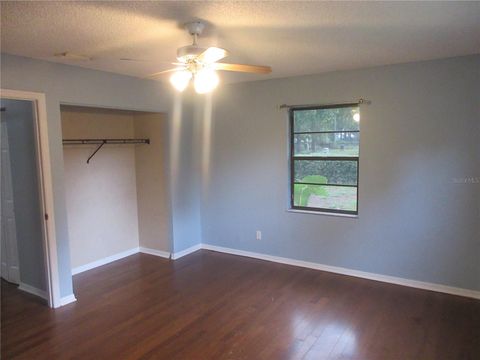
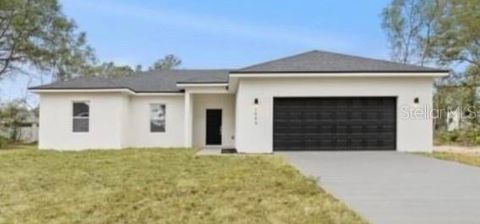
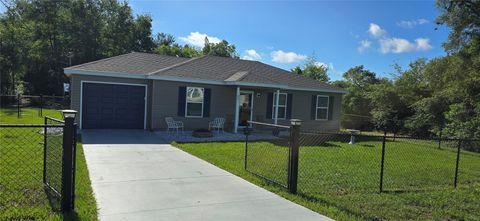
Active
$179,000
2
bds
|
2
ba
|
1,086
sqft
|
built
1983
6141 NW 64th Ct, Ocala, FL 34482
$109
Cash flow
3.2%
Cash-on-Cash Return
7.0%
Cap rate
0.9%
Rent to Value Ratio
692 out of 702 properties for sale in Ocala, FL
Limited Results Shown
Create a free account, or log in to reveal all property listings and enjoy the complete experience.
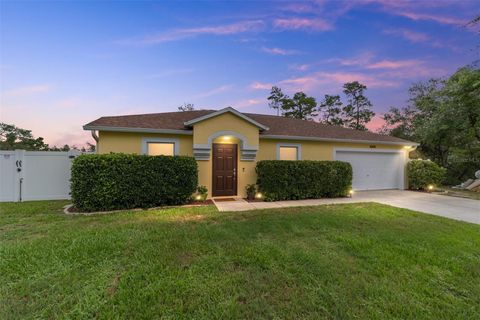
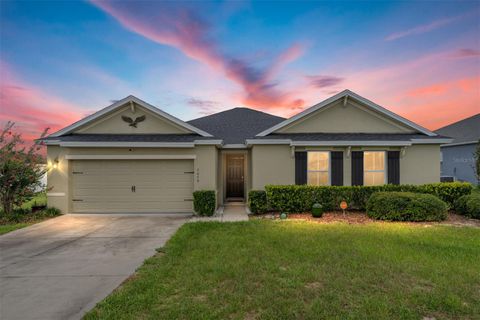
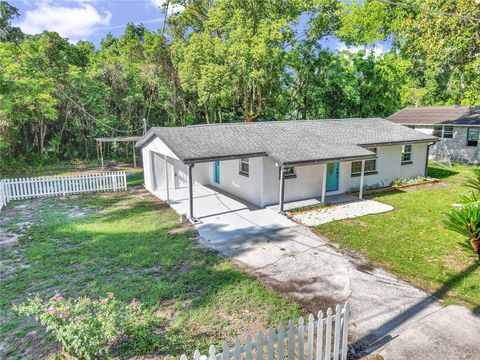
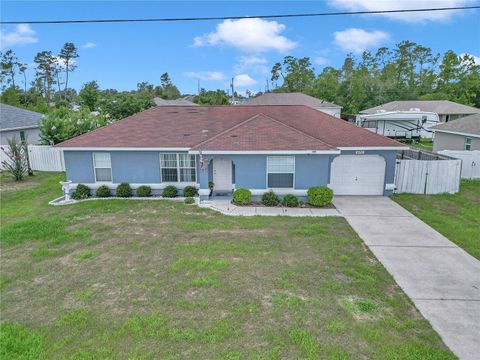
Active
$249,900
3
bds
|
2
ba
|
1,410
sqft
|
built
2008
16605 SW 31st Cir, Ocala, FL 34473
$-183
Cash flow
-3.8%
Cash-on-Cash Return
5.3%
Cap rate
0.7%
Rent to Value Ratio
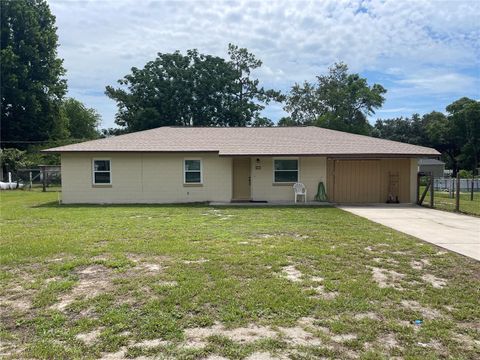
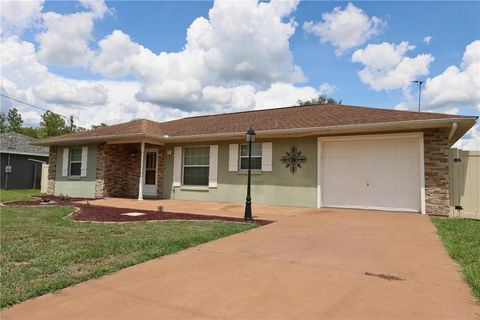
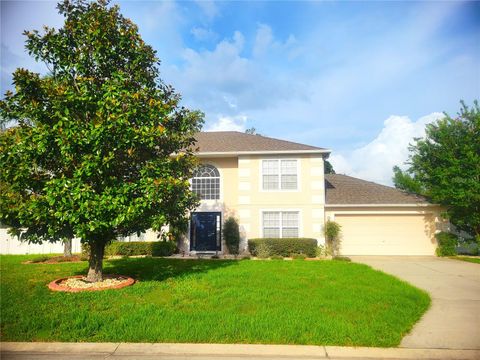
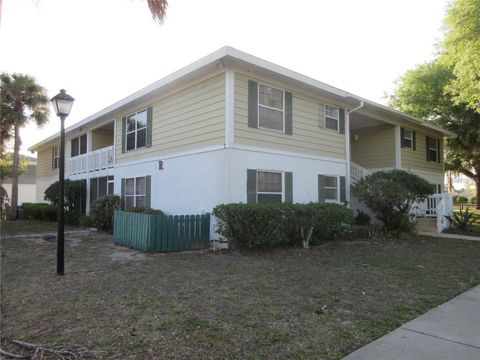
Active
$189,900
2
bds
|
1
ba
|
1,134
sqft
|
built
1982
145 NE 71st Ave, Ocala, FL 34470
$-74
Cash flow
-2.0%
Cash-on-Cash Return
5.7%
Cap rate
0.7%
Rent to Value Ratio
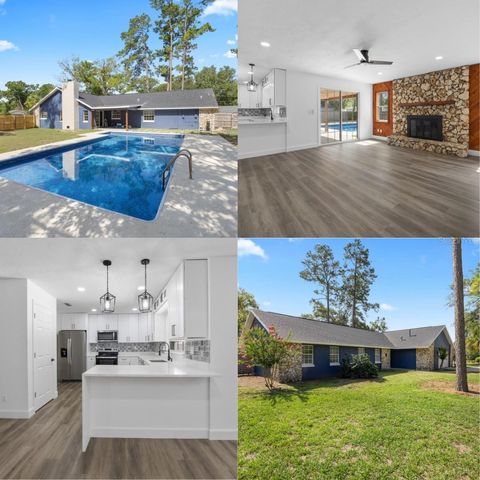
Active
$375,000
3
bds
|
2
ba
|
2,110
sqft
|
built
2019
186 NW 44th St, Ocala, FL 34475
$-641
Cash flow
-8.9%
Cash-on-Cash Return
4.1%
Cap rate
0.6%
Rent to Value Ratio
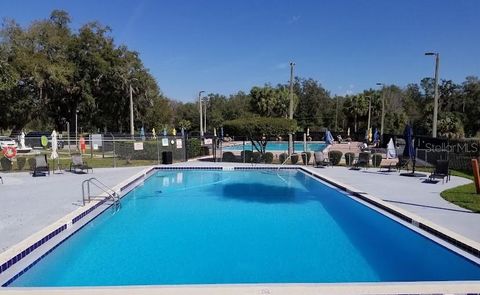
Active
$314,900
4
bds
|
2
ba
|
2,206
sqft
|
built
2023
1686 SW 168th Loop, Ocala, FL 34473
$-414
Cash flow
-6.9%
Cash-on-Cash Return
4.6%
Cap rate
0.7%
Rent to Value Ratio
Active
$394,900
4
bds
|
2
ba
|
2,319
sqft
|
built
2014
6646 SW 64th Ave, Ocala, FL 34476
$-583
Cash flow
-7.7%
Cash-on-Cash Return
4.4%
Cap rate
0.6%
Rent to Value Ratio
Active
$244,900
3
bds
|
2
ba
|
1,732
sqft
|
built
1996
7 Pecan Drive Loop, Ocala, FL 34472
$-237
Cash flow
-5.0%
Cash-on-Cash Return
5.1%
Cap rate
0.7%
Rent to Value Ratio
Active
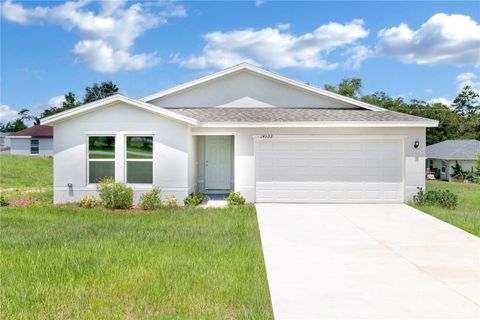
$269,990
3
bds
|
2
ba
|
1,477
sqft
|
built
2023
14322 SW 28th Ave, Ocala, FL 34473
$-555
Cash flow
-10.7%
Cash-on-Cash Return
3.7%
Cap rate
0.6%
Rent to Value Ratio
Active
$465,000
4
bds
|
3
ba
|
2,360
sqft
|
built
1963
1732 SW 6th St, Ocala, FL 34471
$-1,145
Cash flow
-12.8%
Cash-on-Cash Return
3.2%
Cap rate
0.4%
Rent to Value Ratio
Active
$799,900
3
bds
|
4
ba
|
3,185
sqft
|
built
2007
3986 SE 43rd Cir, Ocala, FL 34480
$-1,820
Cash flow
-11.9%
Cash-on-Cash Return
3.5%
Cap rate
0.6%
Rent to Value Ratio
Active
$169,000
2
bds
|
3
ba
|
1,134
sqft
|
built
2005
4429 SW 49th Ave, Ocala, FL 34474
$-391
Cash flow
-12.1%
Cash-on-Cash Return
3.4%
Cap rate
0.8%
Rent to Value Ratio
Active
$529,000
2
bds
|
2
ba
|
1,640
sqft
|
built
1988
9700 SE 72nd Ave, Ocala, FL 34472
$-1,506
Cash flow
-14.9%
Cash-on-Cash Return
2.8%
Cap rate
0.4%
Rent to Value Ratio
Active
$225,000
3
bds
|
2
ba
|
1,014
sqft
|
built
2022
35 Olive Circle Loop, Ocala, FL 34472
$-70
Cash flow
-1.6%
Cash-on-Cash Return
5.9%
Cap rate
0.8%
Rent to Value Ratio
Active
$195,000
3
bds
|
1
ba
|
864
sqft
|
built
1972
1636 SW 5th Pl, Ocala, FL 34471
$-267
Cash flow
-7.1%
Cash-on-Cash Return
4.5%
Cap rate
0.6%
Rent to Value Ratio
Active
$425,000
3
bds
|
3
ba
|
2,336
sqft
|
built
2006
3223 SW 41st Ave, Ocala, FL 34474
$-1,072
Cash flow
-13.2%
Cash-on-Cash Return
3.1%
Cap rate
0.5%
Rent to Value Ratio
Active
$1,300,000
3
bds
|
0
ba
|
3,549
sqft
|
built
2009
485 NW 71st Ave, Ocala, FL 34482
$-5,270
Cash flow
-21.2%
Cash-on-Cash Return
1.3%
Cap rate
0.2%
Rent to Value Ratio
Active
$280,000
3
bds
|
2
ba
|
1,441
sqft
|
built
2024
51 Fir Dr, Ocala, FL 34472
$-174
Cash flow
-3.2%
Cash-on-Cash Return
5.5%
Cap rate
0.7%
Rent to Value Ratio
Active
$300,000
4
bds
|
2
ba
|
1,827
sqft
|
built
2021
8685 SW 49th Cir, Ocala, FL 34476
$-413
Cash flow
-7.2%
Cash-on-Cash Return
4.5%
Cap rate
0.8%
Rent to Value Ratio
Active
$418,000
3
bds
|
2
ba
|
2,119
sqft
|
built
2009
13741 SW 73rd St, Ocala, FL 34481
$-440
Cash flow
-5.5%
Cash-on-Cash Return
4.9%
Cap rate
0.7%
Rent to Value Ratio
Active
$297,900
3
bds
|
2
ba
|
1,355
sqft
|
built
1991
6142 SE 37th Ter, Ocala, FL 34480
$-624
Cash flow
-10.9%
Cash-on-Cash Return
3.6%
Cap rate
0.6%
Rent to Value Ratio
Active
$399,999
4
bds
|
3
ba
|
2,311
sqft
|
built
2007
8628 SW 133rd Lane Rd, Ocala, FL 34473
$-978
Cash flow
-12.8%
Cash-on-Cash Return
3.2%
Cap rate
0.6%
Rent to Value Ratio
Active
$229,900
3
bds
|
2
ba
|
1,204
sqft
|
built
1965
3709 NE 4th St, Ocala, FL 34470
$-285
Cash flow
-6.5%
Cash-on-Cash Return
4.7%
Cap rate
0.7%
Rent to Value Ratio
Active
$774,900
4
bds
|
3
ba
|
2,963
sqft
|
built
2006
2151 SE 59th St, Ocala, FL 34480
$-2,328
Cash flow
-15.7%
Cash-on-Cash Return
2.5%
Cap rate
0.4%
Rent to Value Ratio
Active
$599,999
9
bds
|
4
ba
|
4,666
sqft
|
built
1975
1910 NW 13th Pl, Ocala, FL 34475
$-1,438
Cash flow
-12.5%
Cash-on-Cash Return
3.3%
Cap rate
0.5%
Rent to Value Ratio
Active
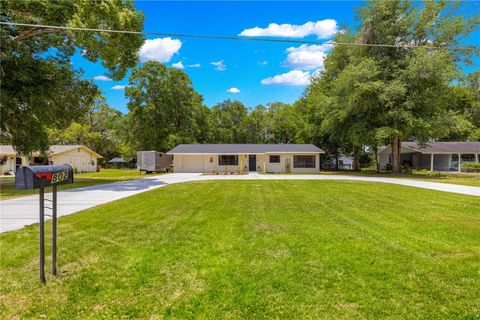
$335,000
4
bds
|
2
ba
|
1,566
sqft
|
built
1963
802 NE 39th Ct, Ocala, FL 34470
$-593
Cash flow
-9.2%
Cash-on-Cash Return
4.0%
Cap rate
0.6%
Rent to Value Ratio
Active
$294,900
3
bds
|
2
ba
|
1,248
sqft
|
built
1996
4250 NW 26th Ter, Ocala, FL 34475
$-625
Cash flow
-11.1%
Cash-on-Cash Return
3.6%
Cap rate
0.5%
Rent to Value Ratio
Active
$213,500
3
bds
|
2
ba
|
1,230
sqft
|
built
1999
329 Larch Rd, Ocala, FL 34480
$-197
Cash flow
-4.8%
Cash-on-Cash Return
5.0%
Cap rate
0.7%
Rent to Value Ratio
Active
$699,000
4
bds
|
3
ba
|
3,070
sqft
|
built
1988
2640 SW 36th Ln, Ocala, FL 34471
$-1,934
Cash flow
-14.4%
Cash-on-Cash Return
2.8%
Cap rate
0.5%
Rent to Value Ratio
Active
$299,900
4
bds
|
2
ba
|
2,088
sqft
|
built
2006
4531 SE 27th St, Ocala, FL 34480
$-438
Cash flow
-7.6%
Cash-on-Cash Return
4.4%
Cap rate
0.8%
Rent to Value Ratio
Active
$695,000
4
bds
|
3
ba
|
2,576
sqft
|
built
2016
3993 SE 10th Ave, Ocala, FL 34480
$-1,462
Cash flow
-11.0%
Cash-on-Cash Return
3.6%
Cap rate
0.6%
Rent to Value Ratio
Active
$329,000
3
bds
|
3
ba
|
1,984
sqft
|
built
1953
4609 NE 7th St, Ocala, FL 34470
$-861
Cash flow
-13.7%
Cash-on-Cash Return
3.0%
Cap rate
0.5%
Rent to Value Ratio
Active
$240,000
3
bds
|
2
ba
|
1,070
sqft
|
built
2001
14762 SW 22nd Court Rd, Ocala, FL 34473
$-357
Cash flow
-7.8%
Cash-on-Cash Return
4.4%
Cap rate
0.7%
Rent to Value Ratio
Active
$477,900
4
bds
|
2
ba
|
2,311
sqft
|
built
1983
327 SE 50th Ave, Ocala, FL 34471
$-1,229
Cash flow
-13.4%
Cash-on-Cash Return
3.1%
Cap rate
0.5%
Rent to Value Ratio
Active
$129,900
2
bds
|
2
ba
|
885
sqft
|
built
1989
8134 Fairways Cir, Ocala, FL 34472
$-216
Cash flow
-8.7%
Cash-on-Cash Return
4.1%
Cap rate
1.0%
Rent to Value Ratio
Active
$290,000
3
bds
|
2
ba
|
1,939
sqft
|
built
1978
543 Silver Crse, Ocala, FL 34472
$-422
Cash flow
-7.6%
Cash-on-Cash Return
4.4%
Cap rate
0.6%
Rent to Value Ratio
Active
$169,900
2
bds
|
2
ba
|
1,126
sqft
|
built
1989
329 Marion Oaks Blvd, Ocala, FL 34473
$-190
Cash flow
-5.8%
Cash-on-Cash Return
4.8%
Cap rate
0.9%
Rent to Value Ratio
Active
$265,900
3
bds
|
2
ba
|
1,670
sqft
|
built
2021
613 Hickory Course Loop, Ocala, FL 34472
$-507
Cash flow
-9.9%
Cash-on-Cash Return
3.9%
Cap rate
0.7%
Rent to Value Ratio

Active
$280,000
3
bds
|
2
ba
|
1,715
sqft
|
built
1990
5 Bahia Circle Pl, Ocala, FL 34472
$-487
Cash flow
-9.1%
Cash-on-Cash Return
4.1%
Cap rate
0.6%
Rent to Value Ratio
Active
$234,900
3
bds
|
2
ba
|
1,335
sqft
|
built
1997
2404 SW 20th Ter, Ocala, FL 34471
$-489
Cash flow
-10.9%
Cash-on-Cash Return
3.6%
Cap rate
0.8%
Rent to Value Ratio