Ocala, FL Investment Properties for Sale
Browse homes for sale and investment properties in Ocala, FL. Refine your search by price, property type, or more.
Best cash flowing properties in Ocala, FL
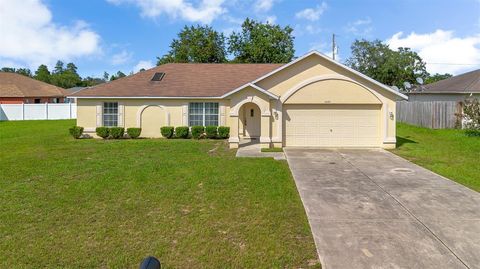
Active
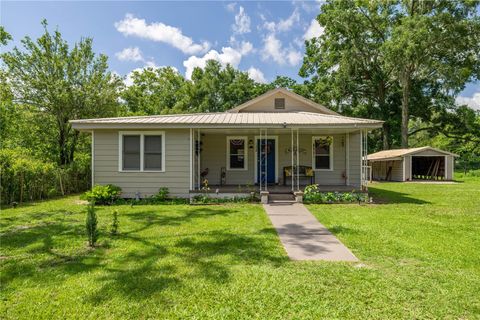
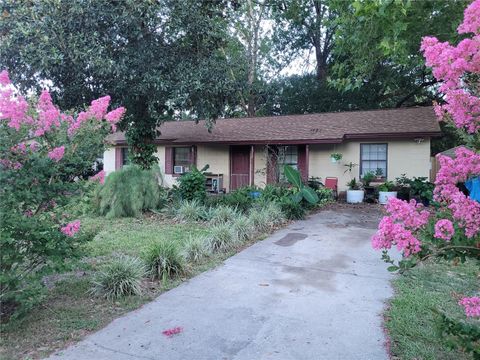
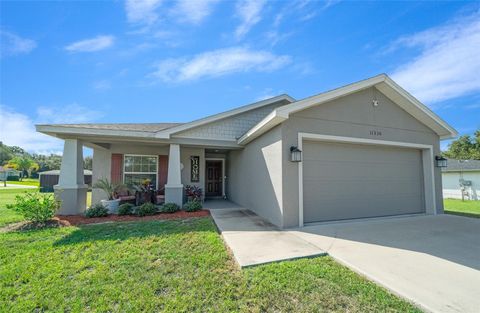
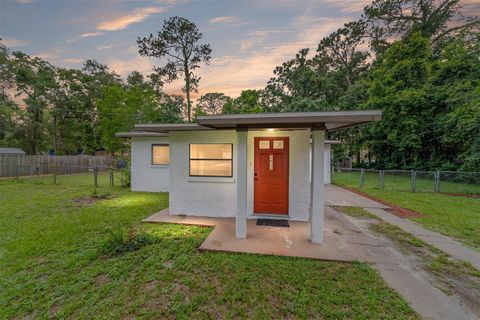
$210,000
3
bds
|
1
ba
|
1,210
sqft
|
built
1948
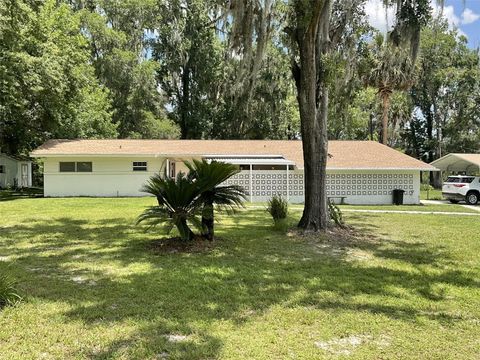
1330 NE 55th St, Ocala, FL 34479
$30
Cash flow
0.7%
Cash-on-Cash Return
6.3%
Cap rate
0.9%
Rent to Value Ratio
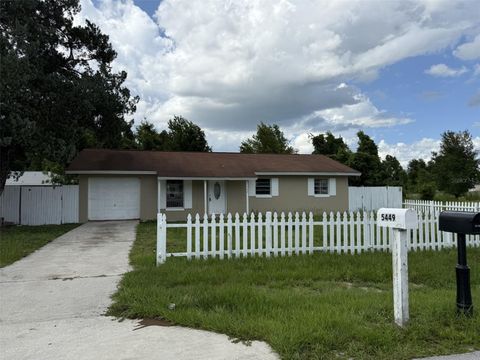
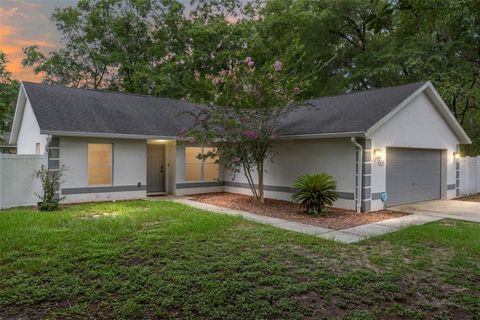
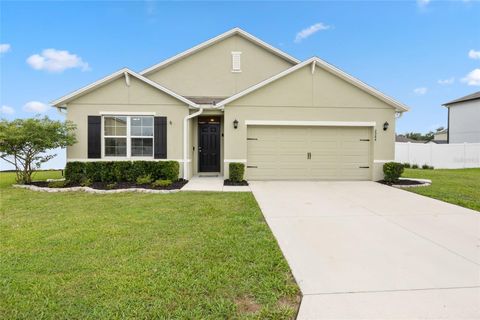
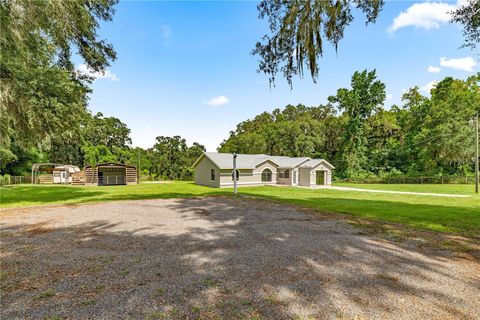
Active
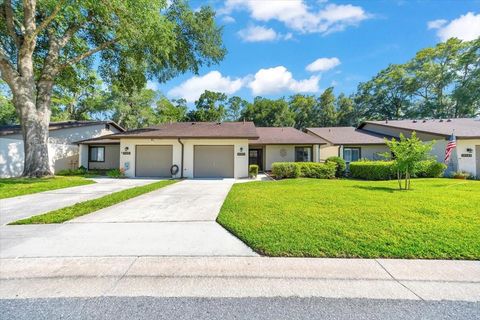
$159,500
3
bds
|
2
ba
|
936
sqft
|
built
1973
5449 NW 2nd St, Ocala, FL 34482
$-60
Cash flow
-2.0%
Cash-on-Cash Return
5.8%
Cap rate
0.9%
Rent to Value Ratio
682 out of 692 properties for sale in Ocala, FL
Limited Results Shown
Create a free account, or log in to reveal all property listings and enjoy the complete experience.
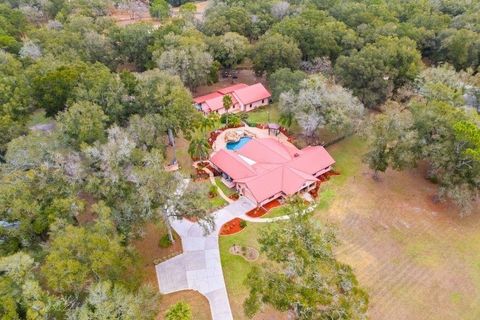
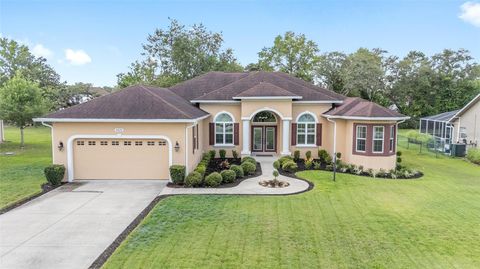
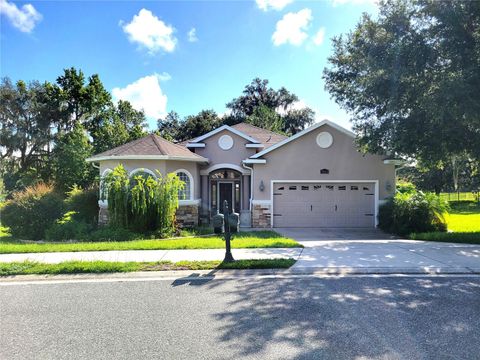
Active
$949,000
5
bds
|
4
ba
|
3,656
sqft
|
built
1990
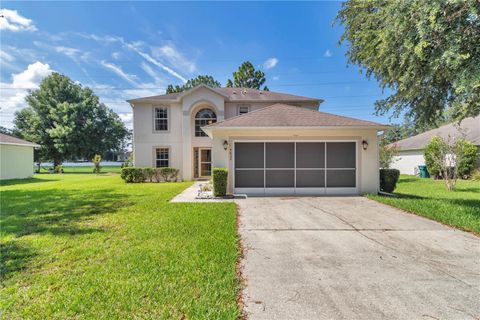
7141 SW 97th Pl, Ocala, FL 34476
$-2,164
Cash flow
-11.9%
Cash-on-Cash Return
3.4%
Cap rate
0.5%
Rent to Value Ratio
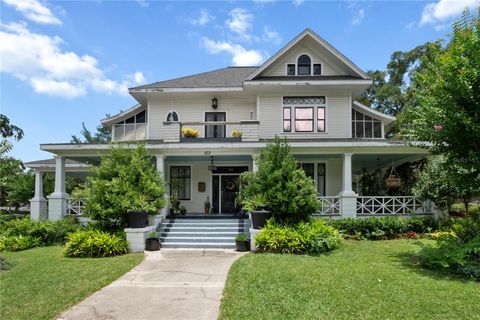
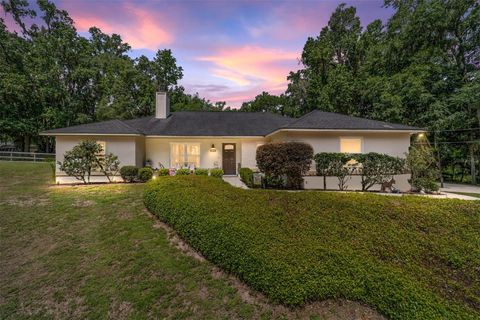
Active
$1,535,000
6
bds
|
5
ba
|
6,711
sqft
|
built
1910
103 SE Tuscawilla Ave, Ocala, FL 34471
$-6,453
Cash flow
-21.9%
Cash-on-Cash Return
1.2%
Cap rate
0.2%
Rent to Value Ratio
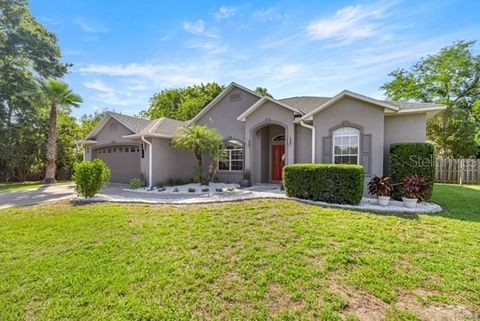
Active
$260,000
3
bds
|
2
ba
|
1,563
sqft
|
built
2005
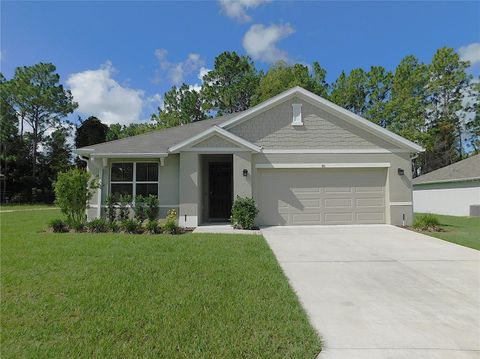
14091 SW 32nd Terrace Rd, Ocala, FL 34473
$-510
Cash flow
-10.2%
Cash-on-Cash Return
3.8%
Cap rate
0.6%
Rent to Value Ratio

Active
$425,000
3
bds
|
2
ba
|
1,810
sqft
|
built
2021
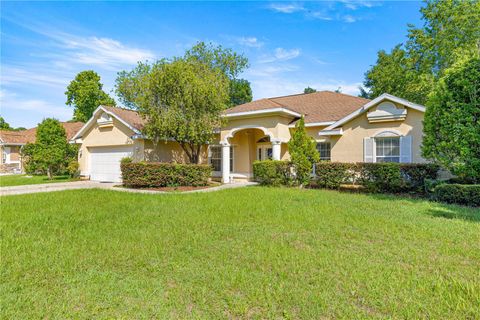
3948 SE 4th Ter, Ocala, FL 34480
$-1,232
Cash flow
-15.1%
Cash-on-Cash Return
2.7%
Cap rate
0.5%
Rent to Value Ratio
Active
$245,000
3
bds
|
2
ba
|
1,384
sqft
|
built
2006
5430 NW 55th Pl, Ocala, FL 34482
$-343
Cash flow
-7.3%
Cash-on-Cash Return
4.5%
Cap rate
0.7%
Rent to Value Ratio
Active
$539,000
3
bds
|
3
ba
|
2,652
sqft
|
built
2017
5024 SW 114th Street Rd, Ocala, FL 34476
$-1,356
Cash flow
-13.1%
Cash-on-Cash Return
3.1%
Cap rate
0.5%
Rent to Value Ratio
Active
$325,000
3
bds
|
2
ba
|
1,566
sqft
|
built
1994
3880 SW 6th Ave, Ocala, FL 34471
$-546
Cash flow
-8.8%
Cash-on-Cash Return
4.1%
Cap rate
0.6%
Rent to Value Ratio
Active
$575,000
3
bds
|
2
ba
|
2,597
sqft
|
built
2003
2908 SE 22nd Ave, Ocala, FL 34471
$-1,494
Cash flow
-13.6%
Cash-on-Cash Return
3.0%
Cap rate
0.5%
Rent to Value Ratio
Active
$270,000
3
bds
|
2
ba
|
1,704
sqft
|
built
1973
5500 SE 2nd Pl, Ocala, FL 34480
$-380
Cash flow
-7.3%
Cash-on-Cash Return
4.5%
Cap rate
0.7%
Rent to Value Ratio
Active
$219,900
3
bds
|
2
ba
|
1,155
sqft
|
built
1993
5862 SW 160th Ct, Ocala, FL 34481
$-190
Cash flow
-4.5%
Cash-on-Cash Return
5.1%
Cap rate
0.7%
Rent to Value Ratio
Active
$289,000
3
bds
|
3
ba
|
1,706
sqft
|
built
1963
2340 NE 14th Ave, Ocala, FL 34470
$-454
Cash flow
-8.2%
Cash-on-Cash Return
4.3%
Cap rate
0.6%
Rent to Value Ratio
Active
$185,000
3
bds
|
2
ba
|
988
sqft
|
built
1979
2312 NE 37th St, Ocala, FL 34479
$-83
Cash flow
-2.3%
Cash-on-Cash Return
5.6%
Cap rate
0.8%
Rent to Value Ratio
Active
$210,000
3
bds
|
2
ba
|
1,535
sqft
|
built
1987
3707 NE 17th St, Ocala, FL 34470
$-147
Cash flow
-3.7%
Cash-on-Cash Return
5.3%
Cap rate
0.9%
Rent to Value Ratio
Active
$429,000
3
bds
|
2
ba
|
1,962
sqft
|
built
2013
3803 SE 6th Ave, Ocala, FL 34480
$-810
Cash flow
-9.9%
Cash-on-Cash Return
3.9%
Cap rate
0.7%
Rent to Value Ratio
Active
$419,000
3
bds
|
2
ba
|
2,056
sqft
|
built
2001
2418 SE 22nd Pl, Ocala, FL 34471
$-972
Cash flow
-12.1%
Cash-on-Cash Return
3.4%
Cap rate
0.5%
Rent to Value Ratio
Active
$319,900
3
bds
|
2
ba
|
1,988
sqft
|
built
1999
5347 Pecan Rd, Ocala, FL 34472
$-243
Cash flow
-4.0%
Cash-on-Cash Return
5.2%
Cap rate
0.7%
Rent to Value Ratio
Active
$329,500
3
bds
|
2
ba
|
2,339
sqft
|
built
1990
13506 SW 43rd Cir, Ocala, FL 34473
$-454
Cash flow
-7.2%
Cash-on-Cash Return
4.5%
Cap rate
0.6%
Rent to Value Ratio
Active
$294,500
4
bds
|
2
ba
|
2,188
sqft
|
built
2005
8414 SW 136th Pl, Ocala, FL 34473
$-515
Cash flow
-9.1%
Cash-on-Cash Return
4.1%
Cap rate
0.7%
Rent to Value Ratio
Active
$379,000
3
bds
|
2
ba
|
1,572
sqft
|
built
1987
6773 SE 87th St, Ocala, FL 34472
$-822
Cash flow
-11.3%
Cash-on-Cash Return
3.5%
Cap rate
0.5%
Rent to Value Ratio
Active
$220,000
2
bds
|
3
ba
|
1,161
sqft
|
built
2005
4426 SW 49th Ave, Ocala, FL 34474
$-618
Cash flow
-14.7%
Cash-on-Cash Return
2.8%
Cap rate
0.7%
Rent to Value Ratio
Active
$330,000
3
bds
|
2
ba
|
2,114
sqft
|
built
2006
4420 SW 100th St, Ocala, FL 34476
$-689
Cash flow
-10.9%
Cash-on-Cash Return
3.7%
Cap rate
0.6%
Rent to Value Ratio
Active
$289,900
3
bds
|
2
ba
|
1,370
sqft
|
built
2005
8187 SW 60th Ter, Ocala, FL 34476
$-223
Cash flow
-4.0%
Cash-on-Cash Return
5.2%
Cap rate
0.7%
Rent to Value Ratio
Active
$724,900
4
bds
|
2
ba
|
2,685
sqft
|
built
1962
1922 SE 13th St, Ocala, FL 34471
$-1,712
Cash flow
-12.3%
Cash-on-Cash Return
3.3%
Cap rate
0.5%
Rent to Value Ratio
Active
$680,000
3
bds
|
3
ba
|
2,721
sqft
|
built
2003
733 SE 67th Ln, Ocala, FL 34480
$-1,949
Cash flow
-15.0%
Cash-on-Cash Return
2.7%
Cap rate
0.5%
Rent to Value Ratio
Active
$349,900
3
bds
|
3
ba
|
2,165
sqft
|
built
1992
3650 SE 55th Ct, Ocala, FL 34480
$-481
Cash flow
-7.2%
Cash-on-Cash Return
4.5%
Cap rate
0.7%
Rent to Value Ratio
Active
$420,000
4
bds
|
2
ba
|
2,322
sqft
|
built
2018
9562 SW 45th Ave, Ocala, FL 34476
$-843
Cash flow
-10.5%
Cash-on-Cash Return
3.7%
Cap rate
0.5%
Rent to Value Ratio
Active
$240,000
3
bds
|
2
ba
|
1,178
sqft
|
built
2019
5740 NW 61st St, Ocala, FL 34482
$-292
Cash flow
-6.3%
Cash-on-Cash Return
4.7%
Cap rate
0.8%
Rent to Value Ratio
Active
$359,000
3
bds
|
3
ba
|
2,220
sqft
|
built
2005
4602 SE 28th St, Ocala, FL 34480
$-377
Cash flow
-5.5%
Cash-on-Cash Return
4.9%
Cap rate
0.7%
Rent to Value Ratio
Active
$389,000
4
bds
|
3
ba
|
2,406
sqft
|
built
2006
4555 NW 6th Cir, Ocala, FL 34475
$-745
Cash flow
-10.0%
Cash-on-Cash Return
3.8%
Cap rate
0.6%
Rent to Value Ratio
Active
$295,000
3
bds
|
2
ba
|
1,672
sqft
|
built
2022
80 Hickory Crse, Ocala, FL 34472
$-372
Cash flow
-6.6%
Cash-on-Cash Return
4.6%
Cap rate
0.7%
Rent to Value Ratio

Active
$550,000
3
bds
|
2
ba
|
0
sqft
|
built
2024
13822 SW 61st Place Rd, Ocala, FL 34481
$-1,398
Cash flow
-13.3%
Cash-on-Cash Return
3.1%
Cap rate
0.4%
Rent to Value Ratio
Active
$299,950
3
bds
|
2
ba
|
1,464
sqft
|
built
1964
1523 SE 80th St, Ocala, FL 34480
$-480
Cash flow
-8.3%
Cash-on-Cash Return
4.2%
Cap rate
0.6%
Rent to Value Ratio
Active
$328,000
3
bds
|
2
ba
|
1,541
sqft
|
built
2021
11330 SW 61st Cir, Ocala, FL 34476
$-403
Cash flow
-6.4%
Cash-on-Cash Return
4.7%
Cap rate
0.7%
Rent to Value Ratio
Active
$349,900
4
bds
|
2
ba
|
1,827
sqft
|
built
2019
2984 NE 43rd Rd, Ocala, FL 34470
$-646
Cash flow
-9.6%
Cash-on-Cash Return
3.9%
Cap rate
0.7%
Rent to Value Ratio
Active
$397,000
4
bds
|
3
ba
|
2,193
sqft
|
built
2007
3858 SW 161st St, Ocala, FL 34473
$-1,038
Cash flow
-13.6%
Cash-on-Cash Return
3.0%
Cap rate
0.5%
Rent to Value Ratio
Active
$250,000
3
bds
|
1
ba
|
1,373
sqft
|
built
1965
1143 NE 23rd St, Ocala, FL 34470
$-360
Cash flow
-7.5%
Cash-on-Cash Return
4.4%
Cap rate
0.6%
Rent to Value Ratio
Active
$188,500
3
bds
|
1
ba
|
1,092
sqft
|
built
1963
2602 NE 2nd Ave, Ocala, FL 34470
$-244
Cash flow
-6.8%
Cash-on-Cash Return
4.6%
Cap rate
0.7%
Rent to Value Ratio
Active
$500,000
4
bds
|
2
ba
|
2,163
sqft
|
built
1994
14171 SW 8th Ave, Ocala, FL 34473
$-784
Cash flow
-8.2%
Cash-on-Cash Return
4.3%
Cap rate
0.6%
Rent to Value Ratio