Ocklawaha, FL Investment Properties for Sale
Browse homes for sale and investment properties in Ocklawaha, FL. Refine your search by price, property type, or more.
Best cash flowing properties in Ocklawaha, FL
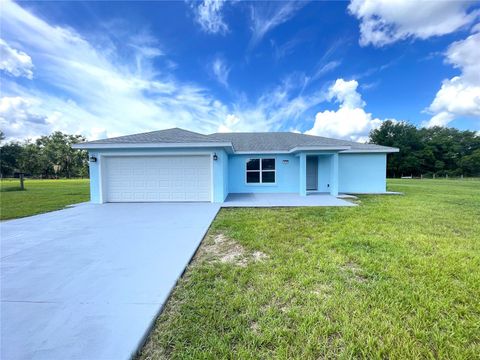
Active
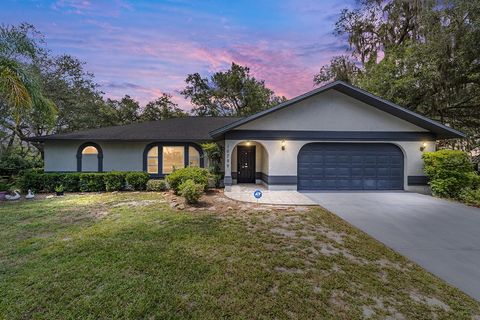
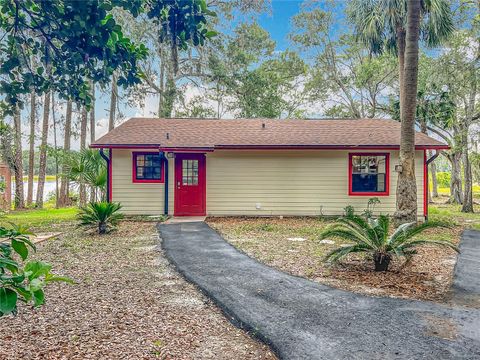
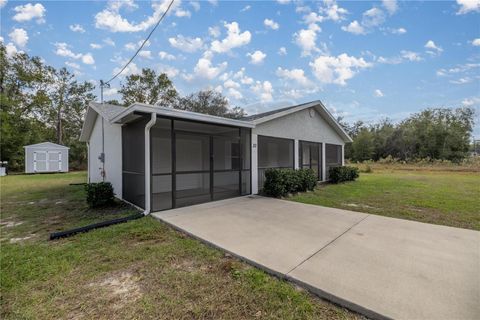
$248,000
3
bds
|
2
ba
|
1,326
sqft
|
built
1974
12351 SE Maricamp Rd, Ocklawaha, FL 32179
$-89
Cash flow
-1.9%
Cash-on-Cash Return
5.7%
Cap rate
0.7%
Rent to Value Ratio
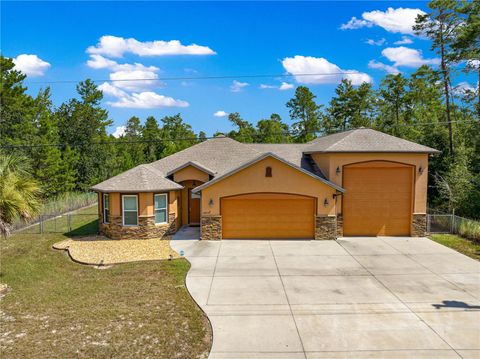
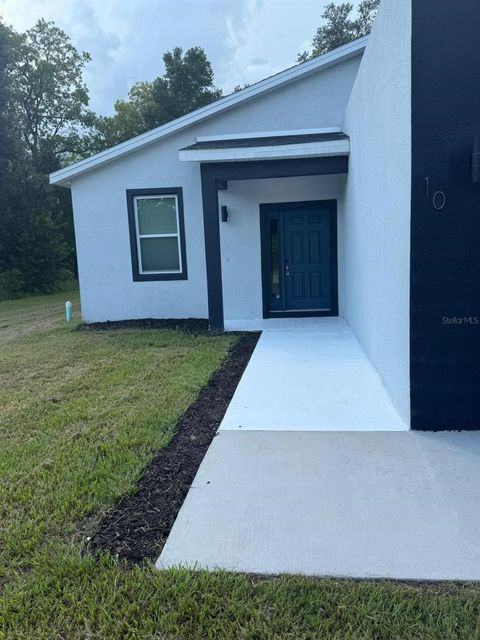
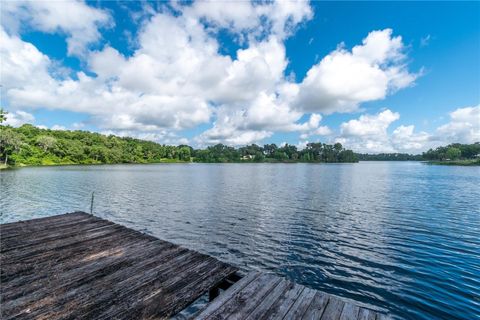
Active
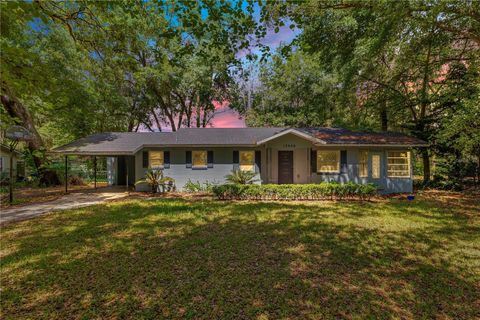
$244,449
3
bds
|
2
ba
|
1,350
sqft
|
built
2024
5 Fisher Loop Ct, Ocklawaha, FL 32179
$-163
Cash flow
-3.5%
Cash-on-Cash Return
5.3%
Cap rate
0.7%
Rent to Value Ratio
19 out of 22 properties for sale in Ocklawaha, FL
Limited Results Shown
Create a free account, or log in to reveal all property listings and enjoy the complete experience.
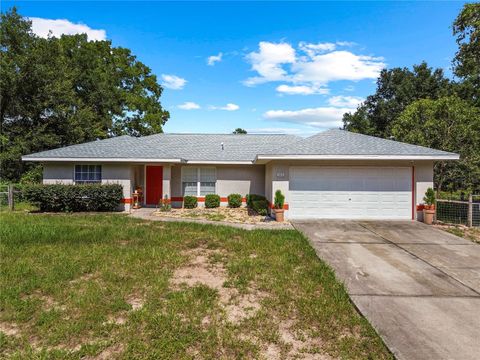
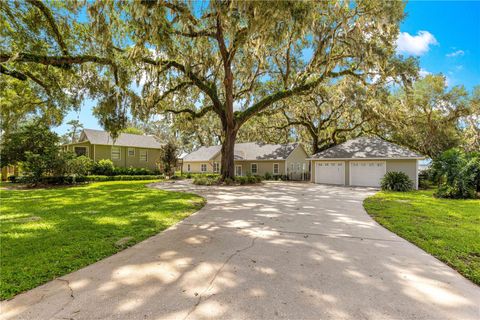
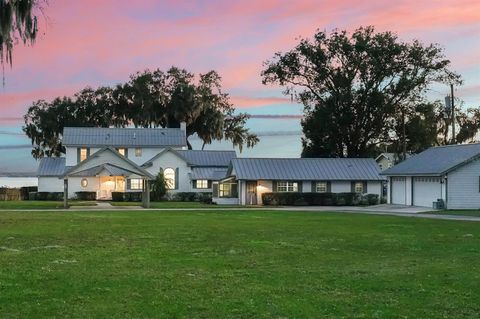
Active
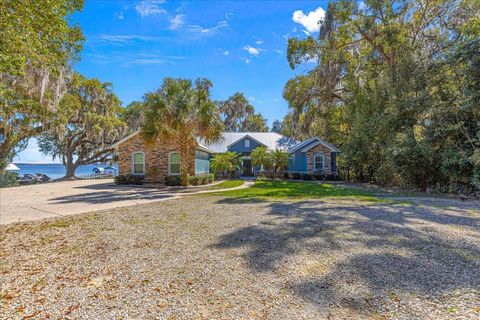
$260,000
2
bds
|
2
ba
|
1,080
sqft
|
built
1974
5989 SE 159th Ct, Ocklawaha, FL 32179
$-268
Cash flow
-5.4%
Cash-on-Cash Return
4.9%
Cap rate
0.7%
Rent to Value Ratio
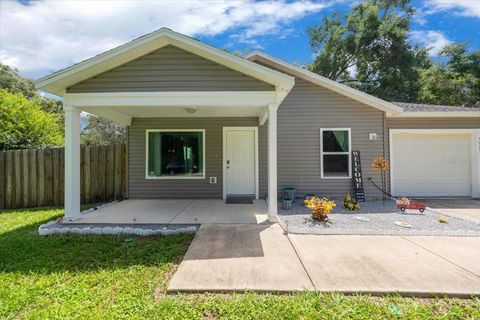
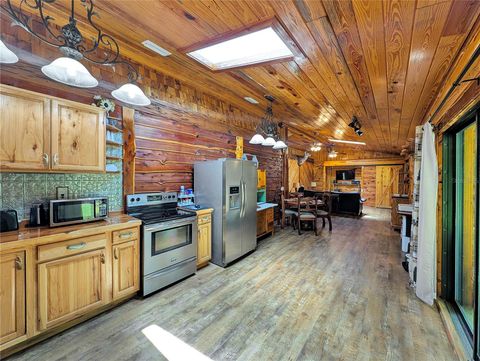
Active
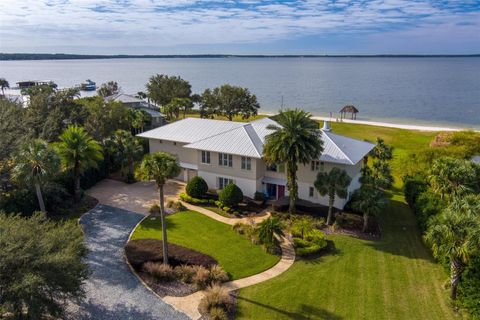
$305,000
3
bds
|
2
ba
|
0
sqft
|
built
2023
11338 Orange Rd, Ocklawaha, FL 32179
$-717
Cash flow
-12.3%
Cash-on-Cash Return
3.3%
Cap rate
0.5%
Rent to Value Ratio
Active
$309,750
3
bds
|
2
ba
|
2,106
sqft
|
built
1990
16789 SE 69th Ln, Ocklawaha, FL 32179
$-395
Cash flow
-6.7%
Cash-on-Cash Return
4.6%
Cap rate
0.7%
Rent to Value Ratio
Active
$494,492
3
bds
|
2
ba
|
2,449
sqft
|
built
2017
3 Bay Ln, Ocklawaha, FL 32179
$-1,068
Cash flow
-11.3%
Cash-on-Cash Return
3.6%
Cap rate
0.6%
Rent to Value Ratio
Active
$335,000
3
bds
|
2
ba
|
1,362
sqft
|
built
2007
113 Guava Ter, Ocklawaha, FL 32179
$-524
Cash flow
-8.2%
Cash-on-Cash Return
4.3%
Cap rate
0.6%
Rent to Value Ratio
Active
$230,000
3
bds
|
2
ba
|
1,084
sqft
|
built
2021
5515 SE 171st Ct, Ocklawaha, FL 32179
$-249
Cash flow
-5.6%
Cash-on-Cash Return
4.8%
Cap rate
0.7%
Rent to Value Ratio
Active
$264,900
3
bds
|
2
ba
|
1,546
sqft
|
built
2023
10 Guava Lane Crse, Ocklawaha, FL 32179
$-458
Cash flow
-9.0%
Cash-on-Cash Return
4.1%
Cap rate
0.7%
Rent to Value Ratio
Active
$1,500,000
4
bds
|
4
ba
|
3,578
sqft
|
built
1998
12360 E Highway 25, Ocklawaha, FL 32179
$-6,513
Cash flow
-22.7%
Cash-on-Cash Return
0.9%
Cap rate
0.2%
Rent to Value Ratio
Active
$380,000
3
bds
|
2
ba
|
1,327
sqft
|
built
2020
10758 SE Highway 464 C, Ocklawaha, FL 32179
$-1,053
Cash flow
-14.5%
Cash-on-Cash Return
2.8%
Cap rate
0.4%
Rent to Value Ratio
Active
$260,000
1
bds
|
1
ba
|
1,056
sqft
|
built
2021
5630 SE 183rd Avenue Rd, Ocklawaha, FL 32179
$-607
Cash flow
-12.2%
Cash-on-Cash Return
3.3%
Cap rate
0.5%
Rent to Value Ratio
Active
$209,000
2
bds
|
1
ba
|
1,296
sqft
|
built
1986
16621 SE 57th Pl, Ocklawaha, FL 32179
$-340
Cash flow
-8.5%
Cash-on-Cash Return
4.2%
Cap rate
0.7%
Rent to Value Ratio
Active
$220,000
3
bds
|
1
ba
|
1,116
sqft
|
built
1963
12046 SE 135th Ave, Ocklawaha, FL 32179
$-238
Cash flow
-5.6%
Cash-on-Cash Return
4.8%
Cap rate
0.7%
Rent to Value Ratio
Active
$1,200,000
3
bds
|
3
ba
|
2,846
sqft
|
built
2016
12336 E Highway 25, Ocklawaha, FL 32179
$-5,017
Cash flow
-21.8%
Cash-on-Cash Return
1.1%
Cap rate
0.3%
Rent to Value Ratio
Active
$1,595,000
4
bds
|
4
ba
|
3,910
sqft
|
built
2013
12757 SE 143rd Ave, Ocklawaha, FL 32179
$-4,839
Cash flow
-15.8%
Cash-on-Cash Return
2.5%
Cap rate
0.4%
Rent to Value Ratio
Active
$235,999
3
bds
|
2
ba
|
1,380
sqft
|
built
2021
30 Maple Crse, Ocklawaha, FL 32179
$-369
Cash flow
-8.2%
Cash-on-Cash Return
4.3%
Cap rate
0.7%
Rent to Value Ratio
Active
$600,000
3
bds
|
2
ba
|
2,071
sqft
|
built
1976
15669 SE 112th Ln, Ocklawaha, FL 32179
$-1,634
Cash flow
-14.2%
Cash-on-Cash Return
2.9%
Cap rate
0.5%
Rent to Value Ratio
Active
$1,950,000
6
bds
|
7
ba
|
4,954
sqft
|
built
1948
12730 E Highway 25, Ocklawaha, FL 32179
$-7,718
Cash flow
-20.7%
Cash-on-Cash Return
1.4%
Cap rate
0.3%
Rent to Value Ratio