Fairfield County Investment Properties for Sale
Browse homes for sale and investment properties in Fairfield County. Refine your search by price, property type, or more.
Best cash flowing properties in Fairfield County
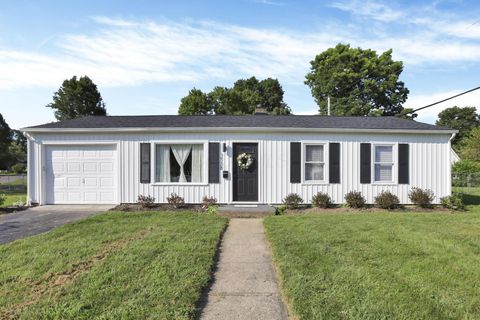
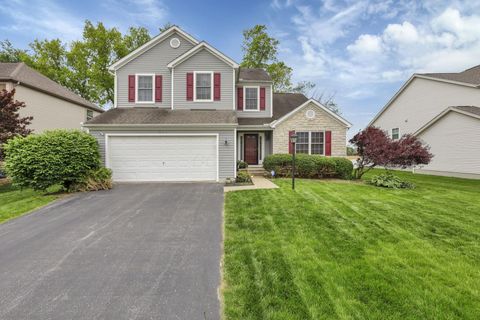
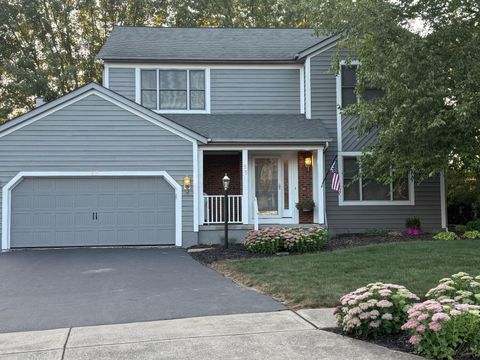
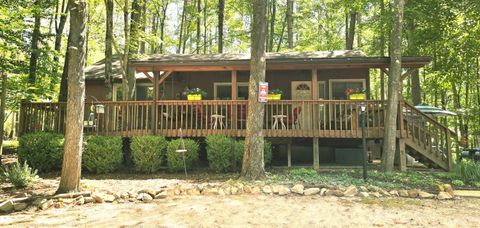
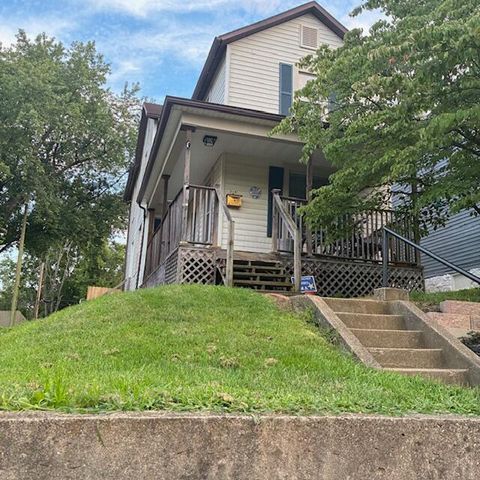
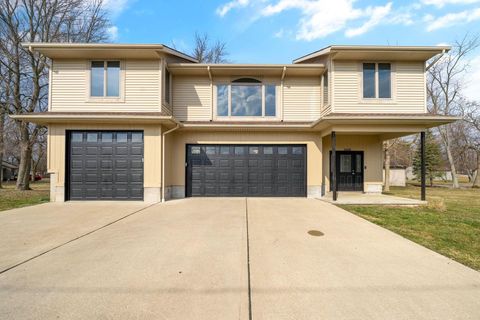
Active
$239,900
3
bds
|
1
ba
|
925
sqft
|
built
1958
1738 W Mulberry St, Lancaster, OH 43130
$278
Cash flow
6.0%
Cash-on-Cash Return
7.1%
Cap rate
0.9%
Rent to Value Ratio
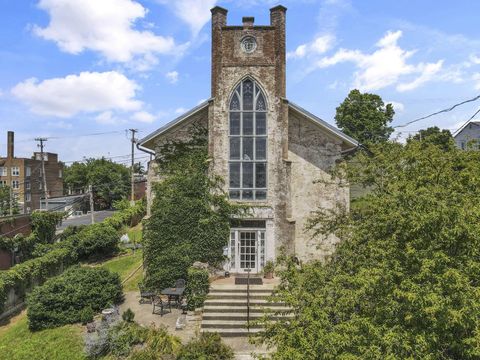
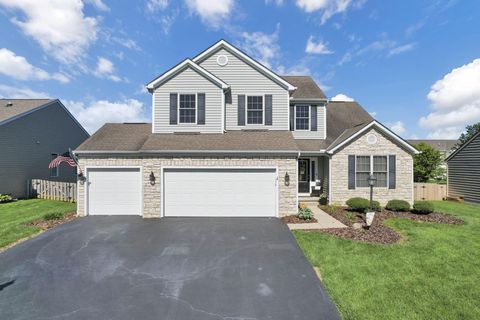
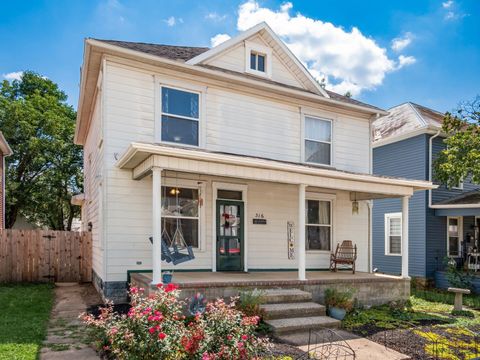
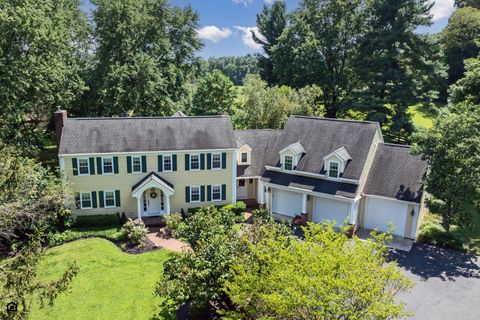
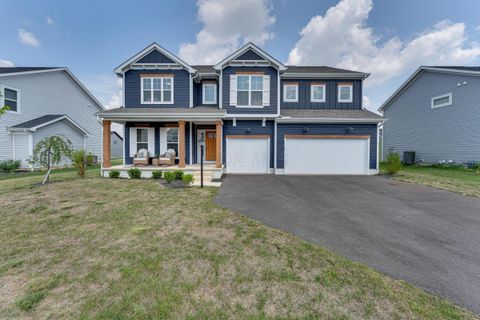
Active
$399,900
4
bds
|
2
ba
|
4,284
sqft
|
built
1900
131 E Chestnut St, Lancaster, OH 43130
$256
Cash flow
3.3%
Cash-on-Cash Return
6.4%
Cap rate
0.9%
Rent to Value Ratio
59 out of 238 properties for sale in Fairfield County
Limited Results Shown
Create a free account, or log in to reveal all property listings and enjoy the complete experience.
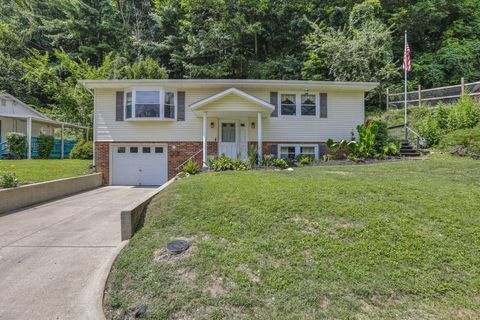
Active
$240,000
2
bds
|
1
ba
|
960
sqft
|
built
1954
5636 Old Logan Rd SE, Lancaster, OH 43130
$-189
Cash flow
-4.1%
Cash-on-Cash Return
4.7%
Cap rate
0.7%
Rent to Value Ratio

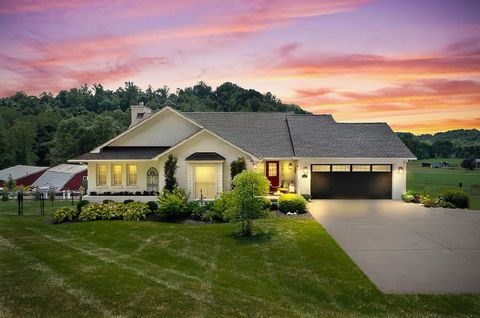
Active
$499,800
3
bds
|
3
ba
|
2,522
sqft
|
built
2019
12181 Prairie View Dr NW, Pickerington, OH 43147
$-1,008
Cash flow
-10.5%
Cash-on-Cash Return
3.3%
Cap rate
0.6%
Rent to Value Ratio

Active
$437,900
4
bds
|
3
ba
|
3,000
sqft
|
built
2006
3291 Oak Leaf Ln, Rushville, OH 43150
$-629
Cash flow
-7.5%
Cash-on-Cash Return
4.0%
Cap rate
0.6%
Rent to Value Ratio
Active
$240,000
2
bds
|
2
ba
|
1,368
sqft
|
built
1922
1125 Olds Ave, Lancaster, OH 43130
$-191
Cash flow
-4.2%
Cash-on-Cash Return
4.7%
Cap rate
0.7%
Rent to Value Ratio

Active
$469,900
3
bds
|
3
ba
|
2,179
sqft
|
built
1983
8950 Easton Dr, Pickerington, OH 43147
$-1,022
Cash flow
-11.3%
Cash-on-Cash Return
3.1%
Cap rate
0.5%
Rent to Value Ratio
Active
$449,000
4
bds
|
4
ba
|
2,662
sqft
|
built
2003
318 Linden Cir, Pickerington, OH 43147
$-677
Cash flow
-7.9%
Cash-on-Cash Return
3.9%
Cap rate
0.6%
Rent to Value Ratio
Active
$499,900
5
bds
|
4
ba
|
3,196
sqft
|
built
2006
217 Balsam Dr, Pickerington, OH 43147
$-806
Cash flow
-8.4%
Cash-on-Cash Return
3.7%
Cap rate
0.6%
Rent to Value Ratio
Active
$559,000
3
bds
|
2
ba
|
2,010
sqft
|
built
1993
10959 Heimberger Rd NW, Baltimore, OH 43105
$-1,118
Cash flow
-10.4%
Cash-on-Cash Return
3.3%
Cap rate
0.5%
Rent to Value Ratio
Active
$279,000
3
bds
|
3
ba
|
1,463
sqft
|
built
1900
249 N Pearl Ave, Lancaster, OH 43130
$-65
Cash flow
-1.2%
Cash-on-Cash Return
5.4%
Cap rate
0.7%
Rent to Value Ratio
Active
$424,900
4
bds
|
3
ba
|
2,299
sqft
|
built
1999
55 Gayle Dr, Pickerington, OH 43147
$-584
Cash flow
-7.2%
Cash-on-Cash Return
4.0%
Cap rate
0.6%
Rent to Value Ratio
Active
$237,500
3
bds
|
2
ba
|
2,214
sqft
|
built
1900
316 Reber Ave, Lancaster, OH 43130
$83
Cash flow
1.8%
Cash-on-Cash Return
6.1%
Cap rate
0.8%
Rent to Value Ratio

Active
$439,900
4
bds
|
3
ba
|
2,256
sqft
|
built
2005
1893 Beaver Ln, Sugar Grove, OH 43155
$-647
Cash flow
-7.7%
Cash-on-Cash Return
3.9%
Cap rate
0.7%
Rent to Value Ratio

Active
$415,000
4
bds
|
3
ba
|
2,553
sqft
|
built
1986
13048 Coventry Ave, Pickerington, OH 43147
$-470
Cash flow
-5.9%
Cash-on-Cash Return
4.3%
Cap rate
0.7%
Rent to Value Ratio
Active
$225,000
3
bds
|
2
ba
|
1,708
sqft
|
built
1975
255 School St, Bremen, OH 43107
$25
Cash flow
0.6%
Cash-on-Cash Return
5.8%
Cap rate
0.8%
Rent to Value Ratio

Active
$490,000
3
bds
|
2
ba
|
2,006
sqft
|
built
1959
330 W Columbus St, Lithopolis, OH 43136
$-1,244
Cash flow
-13.2%
Cash-on-Cash Return
2.6%
Cap rate
0.4%
Rent to Value Ratio
Active
$879,900
3
bds
|
3
ba
|
2,293
sqft
|
built
1994
1531 Tarkiln Rd SE, Lancaster, OH 43130
$-2,986
Cash flow
-17.7%
Cash-on-Cash Return
1.6%
Cap rate
0.3%
Rent to Value Ratio

Active
$474,900
5
bds
|
4
ba
|
3,207
sqft
|
built
1994
135 Mac Kenzie Dr, Pickerington, OH 43147
$-525
Cash flow
-5.8%
Cash-on-Cash Return
4.4%
Cap rate
0.7%
Rent to Value Ratio
Active
$265,000
2
bds
|
1
ba
|
988
sqft
|
built
1962
324 Winnebago Ln, Bremen, OH 43107
$-589
Cash flow
-11.6%
Cash-on-Cash Return
3.0%
Cap rate
0.6%
Rent to Value Ratio

Active
$685,900
5
bds
|
4
ba
|
3,916
sqft
|
built
1999
1129 Stone Run Ct, Lancaster, OH 43130
$-1,329
Cash flow
-10.1%
Cash-on-Cash Return
3.4%
Cap rate
0.6%
Rent to Value Ratio
Active
$2,199,900
4
bds
|
4
ba
|
4,366
sqft
|
built
1971
5701 Lancaster Circleville Rd SW, Lancaster, OH 43130
$-10,633
Cash flow
-25.2%
Cash-on-Cash Return
-0.1%
Cap rate
0.1%
Rent to Value Ratio
Active
$249,900
3
bds
|
2
ba
|
1,478
sqft
|
built
1900
530 E Wheeling St, Lancaster, OH 43130
$-89
Cash flow
-1.9%
Cash-on-Cash Return
5.3%
Cap rate
0.7%
Rent to Value Ratio
Active
$269,900
3
bds
|
2
ba
|
1,620
sqft
|
built
1998
6895 Heigle Rd SW, Amanda, OH 43102
$-486
Cash flow
-9.4%
Cash-on-Cash Return
3.5%
Cap rate
0.5%
Rent to Value Ratio
Active
$210,000
3
bds
|
2
ba
|
1,340
sqft
|
built
1900
356 E Mulberry St, Lancaster, OH 43130
$43
Cash flow
1.1%
Cash-on-Cash Return
5.9%
Cap rate
0.8%
Rent to Value Ratio

Active
$550,000
4
bds
|
4
ba
|
2,547
sqft
|
built
1998
1350 Leonard Rd NW, Baltimore, OH 43105
$-1,343
Cash flow
-12.7%
Cash-on-Cash Return
2.7%
Cap rate
0.4%
Rent to Value Ratio
Active
$599,000
4
bds
|
4
ba
|
3,920
sqft
|
built
2023
116 Kohler St, Pickerington, OH 43147
$-1,177
Cash flow
-10.3%
Cash-on-Cash Return
3.3%
Cap rate
0.6%
Rent to Value Ratio
Active
$559,900
4
bds
|
3
ba
|
3,892
sqft
|
built
2021
12644 Prairie View Dr NW, Pickerington, OH 43147
$-1,236
Cash flow
-11.5%
Cash-on-Cash Return
3.0%
Cap rate
0.5%
Rent to Value Ratio
Active
$420,000
4
bds
|
3
ba
|
2,070
sqft
|
built
1990
964 Dunmore Ct, Pickerington, OH 43147
$-702
Cash flow
-8.7%
Cash-on-Cash Return
3.7%
Cap rate
0.6%
Rent to Value Ratio
Active
$345,000
3
bds
|
2
ba
|
1,600
sqft
|
built
1976
484 Hilltop Dr, Pickerington, OH 43147
$-405
Cash flow
-6.1%
Cash-on-Cash Return
4.3%
Cap rate
0.6%
Rent to Value Ratio
Active
$439,900
4
bds
|
3
ba
|
2,016
sqft
|
built
2016
504 Longview St, Pickerington, OH 43147
$-807
Cash flow
-9.6%
Cash-on-Cash Return
3.5%
Cap rate
0.6%
Rent to Value Ratio
Active
$311,000
3
bds
|
2
ba
|
1,276
sqft
|
built
1994
7489 Crooked Stick Dr, Pickerington, OH 43147
$-249
Cash flow
-4.2%
Cash-on-Cash Return
4.7%
Cap rate
0.7%
Rent to Value Ratio
Active
$255,000
3
bds
|
2
ba
|
1,728
sqft
|
built
1956
1150 E Fair Ave, Lancaster, OH 43130
$-19
Cash flow
-0.4%
Cash-on-Cash Return
5.6%
Cap rate
0.8%
Rent to Value Ratio
Active
$329,999
4
bds
|
3
ba
|
2,052
sqft
|
built
1978
1669 Lexington Dr, Lancaster, OH 43130
$-213
Cash flow
-3.4%
Cash-on-Cash Return
4.9%
Cap rate
0.7%
Rent to Value Ratio
Active
$327,000
4
bds
|
2
ba
|
1,660
sqft
|
built
1954
1304 E Allen St, Lancaster, OH 43130
$-515
Cash flow
-8.2%
Cash-on-Cash Return
3.8%
Cap rate
0.6%
Rent to Value Ratio
Active
$449,900
3
bds
|
3
ba
|
2,919
sqft
|
built
2021
12281 Rooster Tail Dr, Pickerington, OH 43147
$-615
Cash flow
-7.1%
Cash-on-Cash Return
4.0%
Cap rate
0.6%
Rent to Value Ratio
Active
$365,900
4
bds
|
3
ba
|
3,327
sqft
|
built
2005
1889 Salt Lick Dr, Lancaster, OH 43130
$-276
Cash flow
-3.9%
Cash-on-Cash Return
4.8%
Cap rate
0.7%
Rent to Value Ratio
Active
$395,000
3
bds
|
3
ba
|
1,736
sqft
|
built
2004
4468 N Bank Rd NE, Millersport, OH 43046
$-209
Cash flow
-2.8%
Cash-on-Cash Return
5.0%
Cap rate
0.7%
Rent to Value Ratio
Active
$649,000
5
bds
|
2
ba
|
2,380
sqft
|
built
1977
12345 Cherry Ln, Millersport, OH 43046
$-1,880
Cash flow
-15.1%
Cash-on-Cash Return
2.2%
Cap rate
0.3%
Rent to Value Ratio
Active
$598,900
3
bds
|
3
ba
|
3,166
sqft
|
built
1993
3520 Baltimore Somerset Rd NE, Millersport, OH 43046
$-1,292
Cash flow
-11.3%
Cash-on-Cash Return
3.1%
Cap rate
0.5%
Rent to Value Ratio