Hocking County Investment Properties for Sale
Browse homes for sale and investment properties in Hocking County. Refine your search by price, property type, or more.
Best cash flowing properties in Hocking County
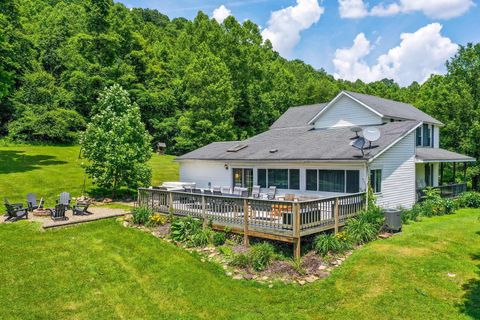
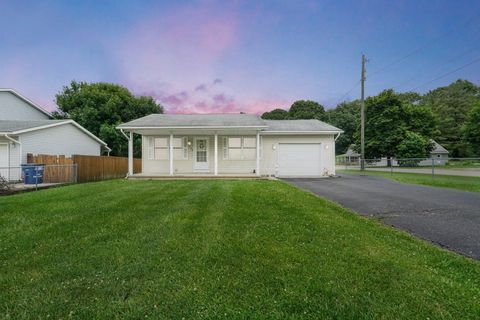
Active
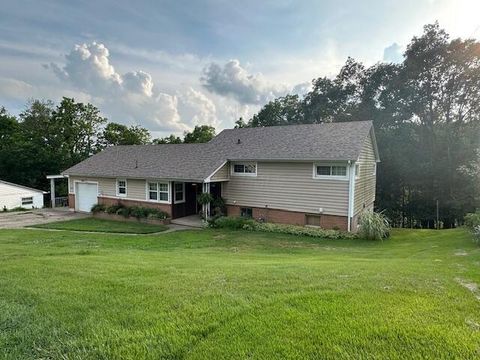
$214,900
3
bds
|
1
ba
|
1,144
sqft
|
built
1963
16251 State Route 678, Rockbridge, OH 43149
$25
Cash flow
0.6%
Cash-on-Cash Return
5.8%
Cap rate
0.7%
Rent to Value Ratio
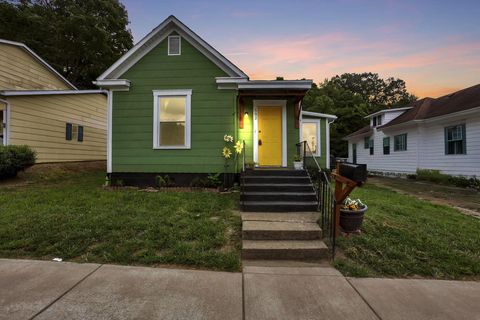
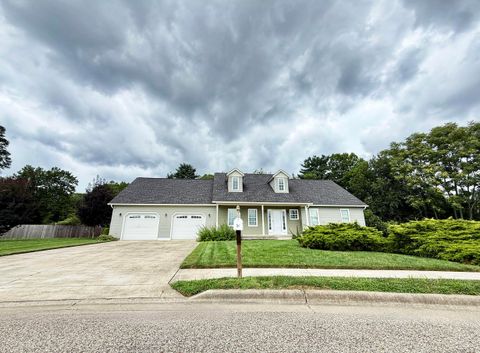
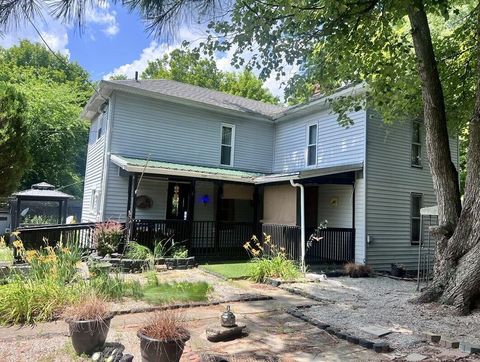
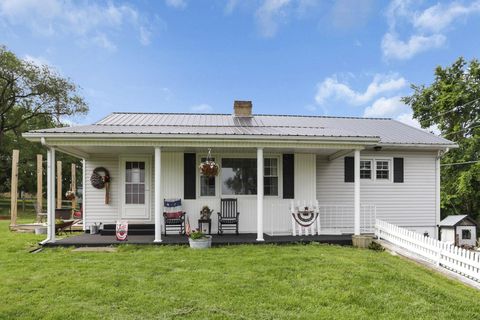
Active
$210,000
3
bds
|
1
ba
|
1,424
sqft
|
built
582 N Walnut St, Logan, OH 43138
$1
Cash flow
0.0%
Cash-on-Cash Return
5.7%
Cap rate
0.8%
Rent to Value Ratio
37 out of 99 properties for sale in Hocking County
Limited Results Shown
Create a free account, or log in to reveal all property listings and enjoy the complete experience.
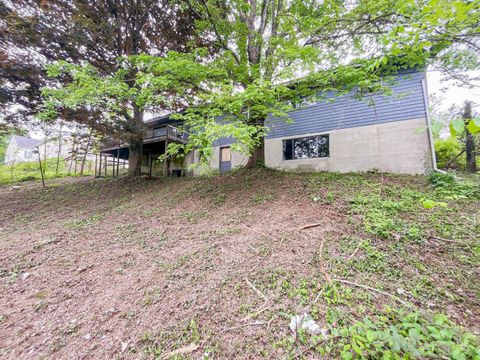
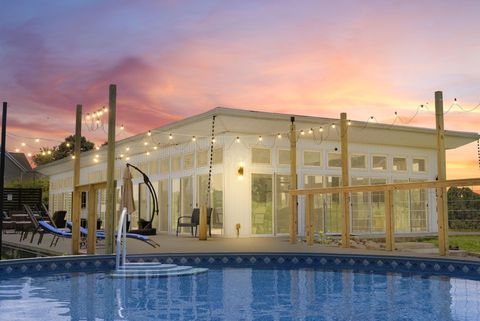
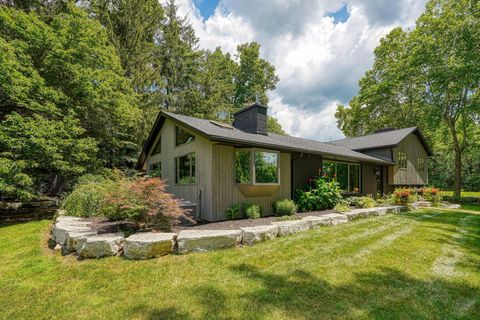
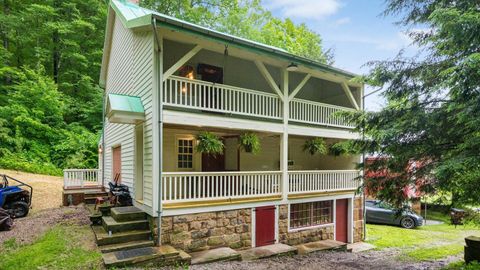
Active
$679,800
2
bds
|
1
ba
|
989
sqft
|
built
2023
14972 Cohagen Rd, Logan, OH 43138
$-1,769
Cash flow
-13.6%
Cash-on-Cash Return
2.6%
Cap rate
0.4%
Rent to Value Ratio
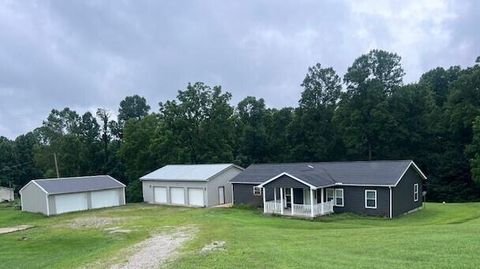
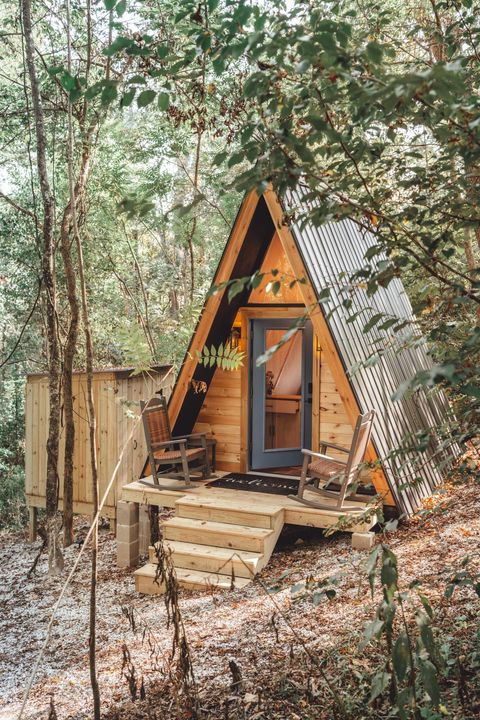
Active
$1,710,000
5
bds
|
3
ba
|
4,160
sqft
|
built
2014
20572 Buena Vista Rd, Rockbridge, OH 43149
$-7,039
Cash flow
-21.5%
Cash-on-Cash Return
0.7%
Cap rate
0.2%
Rent to Value Ratio

Active
$875,000
4
bds
|
2
ba
|
2,504
sqft
|
built
1965
13299 Marshall Rd, Rockbridge, OH 43149
$-2,502
Cash flow
-14.9%
Cash-on-Cash Return
2.2%
Cap rate
0.3%
Rent to Value Ratio
Active
$389,900
2
bds
|
1
ba
|
1,098
sqft
|
built
1979
23087 Bigham Rd, Rockbridge, OH 43149
$-846
Cash flow
-11.3%
Cash-on-Cash Return
3.1%
Cap rate
0.4%
Rent to Value Ratio
Active
$367,900
2
bds
|
2
ba
|
1,200
sqft
|
built
1999
19531 Kalklosch Rd, Logan, OH 43138
$-509
Cash flow
-7.2%
Cash-on-Cash Return
4.0%
Cap rate
0.5%
Rent to Value Ratio
Active
$349,900
3
bds
|
2
ba
|
960
sqft
|
built
1988
11461 Highland Park, Logan, OH 43138
$-318
Cash flow
-4.7%
Cash-on-Cash Return
4.6%
Cap rate
0.6%
Rent to Value Ratio
Active
$620,000
3
bds
|
2
ba
|
1,530
sqft
|
built
2000
10297 Frasure Helber Rd, Logan, OH 43138
$-1,670
Cash flow
-14.1%
Cash-on-Cash Return
2.4%
Cap rate
0.4%
Rent to Value Ratio
Active
$315,000
3
bds
|
2
ba
|
1,836
sqft
|
built
1959
737 Glenwood Dr, Logan, OH 43138
$-470
Cash flow
-7.8%
Cash-on-Cash Return
3.9%
Cap rate
0.5%
Rent to Value Ratio
Active
$1,299,000
3
bds
|
2
ba
|
2,160
sqft
|
built
2022
19718 Feathers Rd, Logan, OH 43138
$-4,133
Cash flow
-16.6%
Cash-on-Cash Return
1.9%
Cap rate
0.3%
Rent to Value Ratio
Active
$385,000
3
bds
|
3
ba
|
2,716
sqft
|
built
2015
741 Huntley Ave, Logan, OH 43138
$-607
Cash flow
-8.2%
Cash-on-Cash Return
3.8%
Cap rate
0.6%
Rent to Value Ratio
Active
$399,900
3
bds
|
2
ba
|
1,512
sqft
|
built
2003
37259 Davis Chapel Rd, Logan, OH 43138
$-969
Cash flow
-12.6%
Cash-on-Cash Return
2.8%
Cap rate
0.4%
Rent to Value Ratio
Active
$795,000
5
bds
|
2
ba
|
2,256
sqft
|
built
1908
26110 Big Pine Rd, Rockbridge, OH 43149
$-1,698
Cash flow
-11.1%
Cash-on-Cash Return
3.1%
Cap rate
0.4%
Rent to Value Ratio
Active
$264,900
3
bds
|
2
ba
|
2,112
sqft
|
built
1867
27380 Miller Rd, Rockbridge, OH 43149
$-115
Cash flow
-2.3%
Cash-on-Cash Return
5.2%
Cap rate
0.7%
Rent to Value Ratio
Active
$228,500
4
bds
|
2
ba
|
1,196
sqft
|
built
1910
940 3rd St, Logan, OH 43138
$-229
Cash flow
-5.2%
Cash-on-Cash Return
4.5%
Cap rate
0.6%
Rent to Value Ratio
Active
$875,500
3
bds
|
4
ba
|
3,470
sqft
|
built
1967
1300 Dannie Dr, Logan, OH 43138
$-1,935
Cash flow
-11.5%
Cash-on-Cash Return
3.0%
Cap rate
0.4%
Rent to Value Ratio
Active
$210,000
3
bds
|
1
ba
|
1,134
sqft
|
built
1996
1138 Ohio Ave, Logan, OH 43138
$-122
Cash flow
-3.0%
Cash-on-Cash Return
5.0%
Cap rate
0.7%
Rent to Value Ratio
Active
$339,000
3
bds
|
1
ba
|
2,308
sqft
|
built
1959
17519 Thompson Ridge Rd, Laurelville, OH 43135
$-578
Cash flow
-8.9%
Cash-on-Cash Return
3.6%
Cap rate
0.5%
Rent to Value Ratio
Active
$789,900
2
bds
|
3
ba
|
1,500
sqft
|
built
1998
24000 State Route 180, Rockbridge, OH 43149
$-1,846
Cash flow
-12.2%
Cash-on-Cash Return
2.9%
Cap rate
0.4%
Rent to Value Ratio
Active
$1,499,900
7
bds
|
5
ba
|
3,123
sqft
|
built
1996
16360 Kreashbaum Rd, Rockbridge, OH 43149
$-5,774
Cash flow
-20.1%
Cash-on-Cash Return
1.1%
Cap rate
0.2%
Rent to Value Ratio
Active
$899,000
3
bds
|
2
ba
|
1,528
sqft
|
built
1974
14572 Hock Hocking Rd, Logan, OH 43138
$-3,129
Cash flow
-18.2%
Cash-on-Cash Return
1.5%
Cap rate
0.2%
Rent to Value Ratio
Active
$550,000
2
bds
|
2
ba
|
1,700
sqft
|
built
2002
22916 Sams Creek Rd, Laurelville, OH 43135
$-1,354
Cash flow
-12.8%
Cash-on-Cash Return
2.7%
Cap rate
0.4%
Rent to Value Ratio
Active
$2,150,000
5
bds
|
4
ba
|
6,200
sqft
|
built
1999
29002 Rockstull Rd, Sugar Grove, OH 43155
$-9,355
Cash flow
-22.7%
Cash-on-Cash Return
0.5%
Cap rate
0.1%
Rent to Value Ratio
Active
$228,000
2
bds
|
1
ba
|
1,040
sqft
|
built
1961
12151 State Route 93 N, Logan, OH 43138
$-224
Cash flow
-5.1%
Cash-on-Cash Return
4.5%
Cap rate
0.6%
Rent to Value Ratio
Active
$475,000
3
bds
|
2
ba
|
1,728
sqft
|
built
2005
23587 Woltz Rd, Rockbridge, OH 43149
$-1,189
Cash flow
-13.1%
Cash-on-Cash Return
2.7%
Cap rate
0.4%
Rent to Value Ratio
Active
$6,800,000
8
bds
|
14
ba
|
13,800
sqft
|
built
2022
16012 State Route 678, Rockbridge, OH 43149
$-29,213
Cash flow
-22.4%
Cash-on-Cash Return
0.5%
Cap rate
0.1%
Rent to Value Ratio
Active
$699,900
2
bds
|
1
ba
|
1,196
sqft
|
built
2011
20913 Cotterman Rd, Logan, OH 43138
$-1,442
Cash flow
-10.7%
Cash-on-Cash Return
3.2%
Cap rate
0.4%
Rent to Value Ratio
Active
$2,970,000
8
bds
|
6
ba
|
6,500
sqft
|
built
1988
14485 Jack Run Rd, Rockbridge, OH 43149
$-12,931
Cash flow
-22.7%
Cash-on-Cash Return
0.5%
Cap rate
0.1%
Rent to Value Ratio
Active
$602,000
3
bds
|
2
ba
|
1,800
sqft
|
built
2019
24796 E Fork Rd, Laurelville, OH 43135
$-1,614
Cash flow
-14.0%
Cash-on-Cash Return
2.5%
Cap rate
0.4%
Rent to Value Ratio
Active
$695,000
4
bds
|
4
ba
|
3,520
sqft
|
built
1997
15574 Long Run Rd, Laurelville, OH 43135
$-1,551
Cash flow
-11.6%
Cash-on-Cash Return
3.0%
Cap rate
0.5%
Rent to Value Ratio
Active
$699,000
5
bds
|
4
ba
|
2,813
sqft
|
built
1983
6723 Zwickle Rd, Logan, OH 43138
$-1,772
Cash flow
-13.2%
Cash-on-Cash Return
2.6%
Cap rate
0.4%
Rent to Value Ratio
Active
$535,000
3
bds
|
1
ba
|
1,360
sqft
|
built
2021
19970 Thompson Ridge Rd, Laurelville, OH 43135
$-1,155
Cash flow
-11.3%
Cash-on-Cash Return
3.1%
Cap rate
0.4%
Rent to Value Ratio
Active
$1,199,900
5
bds
|
3
ba
|
2,742
sqft
|
built
1990
1048 Parkway Dr, Logan, OH 43138
$-4,130
Cash flow
-18.0%
Cash-on-Cash Return
1.5%
Cap rate
0.2%
Rent to Value Ratio
Active
$779,000
1
bds
|
1
ba
|
950
sqft
|
built
1991
23411 State Route 327, Laurelville, OH 43135
$-2,551
Cash flow
-17.1%
Cash-on-Cash Return
1.7%
Cap rate
0.3%
Rent to Value Ratio
Active
$950,000
4
bds
|
3
ba
|
2,236
sqft
|
built
1998
19248 State Route 328, New Plymouth, OH 45654
$-2,471
Cash flow
-13.6%
Cash-on-Cash Return
2.6%
Cap rate
0.4%
Rent to Value Ratio
Active
$277,400
1
bds
|
1
ba
|
768
sqft
|
built
2011
13207 Clapper Hollow Rd, Rockbridge, OH 43149
$-319
Cash flow
-6.0%
Cash-on-Cash Return
4.3%
Cap rate
0.6%
Rent to Value Ratio