Tulsa County Investment Properties for Sale
Browse homes for sale and investment properties in Tulsa County. Refine your search by price, property type, or more.
Best cash flowing properties in Tulsa County

Active
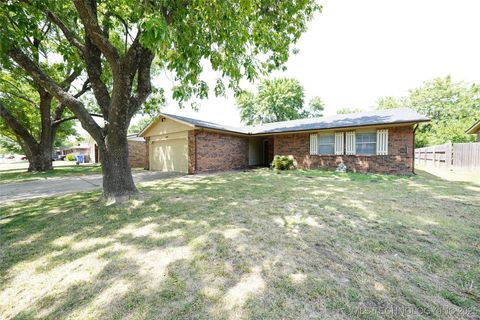
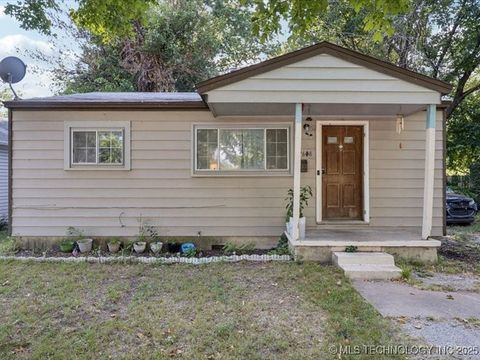
$75,000
3
bds
|
2
ba
|
1,396
sqft
|
built
1949
1003 N Urbana Ave, Tulsa, OK 74115
$550
Cash flow
38.3%
Cash-on-Cash Return
14.5%
Cap rate
1.9%
Rent to Value Ratio
Active
$66,500
2
bds
|
3
ba
|
1,114
sqft
|
built
1977
2219 E 67th St, Tulsa, OK 74136
$457
Cash flow
8.0%
Cash-on-Cash Return
8.2%
Cap rate
1.8%
Rent to Value Ratio
940 out of 1,256 properties for sale in Tulsa County
Limited Results Shown
Create a free account, or log in to reveal all property listings and enjoy the complete experience.

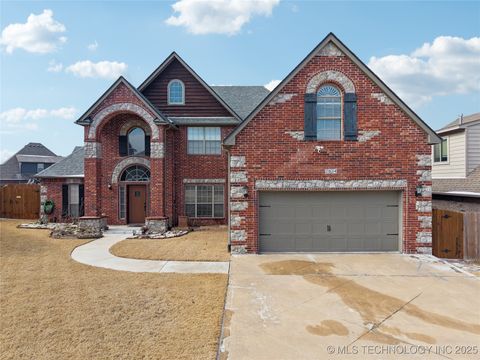
Active
$260,000
3
bds
|
2
ba
|
1,520
sqft
|
built
2005
13155 E 132nd St N, Collinsville, OK 74021
$-357
Cash flow
-7.2%
Cash-on-Cash Return
4.0%
Cap rate
0.6%
Rent to Value Ratio

Active
$619,000
3
bds
|
3
ba
|
2,615
sqft
|
built
1936
1208 E 29th St, Tulsa, OK 74114
$-1,681
Cash flow
-14.2%
Cash-on-Cash Return
2.4%
Cap rate
0.4%
Rent to Value Ratio

Active
$1,200,000
5
bds
|
4
ba
|
5,270
sqft
|
built
1935
1225 E 18th St, Tulsa, OK 74120
$-3,264
Cash flow
-14.2%
Cash-on-Cash Return
2.4%
Cap rate
0.4%
Rent to Value Ratio

Active
$1,475,000
4
bds
|
6
ba
|
5,012
sqft
|
built
2001
3661 S Lewis Ave, Tulsa, OK 74105
$-5,126
Cash flow
-18.1%
Cash-on-Cash Return
1.5%
Cap rate
0.3%
Rent to Value Ratio

Active
$999,500
4
bds
|
5
ba
|
5,340
sqft
|
built
2004
8403 S Allegheny Ave, Tulsa, OK 74137
$-2,337
Cash flow
-12.2%
Cash-on-Cash Return
2.9%
Cap rate
0.5%
Rent to Value Ratio

Active
$1,050,000
4
bds
|
6
ba
|
5,776
sqft
|
built
2006
10625 S Forest Ave, Jenks, OK 74037
$-4,286
Cash flow
-21.3%
Cash-on-Cash Return
0.8%
Cap rate
0.3%
Rent to Value Ratio

Active
$100,000
2
bds
|
2
ba
|
1,153
sqft
|
built
1970
4302 E 67th St, Tulsa, OK 74136
$-17
Cash flow
-0.9%
Cash-on-Cash Return
5.5%
Cap rate
1.3%
Rent to Value Ratio

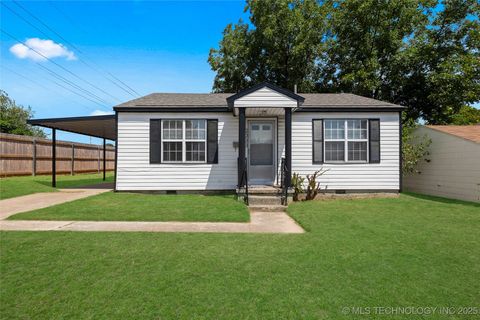
Active
$160,000
3
bds
|
1
ba
|
1,014
sqft
|
built
1935
416 N Franklin Ave, Sand Springs, OK 74063
$151
Cash flow
4.9%
Cash-on-Cash Return
6.8%
Cap rate
0.9%
Rent to Value Ratio
Active
$1,070,000
5
bds
|
6
ba
|
5,228
sqft
|
built
2012
4416 S Orange Ave, Broken Arrow, OK 74011
$-2,837
Cash flow
-13.8%
Cash-on-Cash Return
2.5%
Cap rate
0.5%
Rent to Value Ratio
Active
$335,000
5
bds
|
4
ba
|
2,700
sqft
|
built
1980
11033 E 66th St, Tulsa, OK 74133
$-323
Cash flow
-5.0%
Cash-on-Cash Return
4.5%
Cap rate
0.7%
Rent to Value Ratio
Active
$220,000
3
bds
|
1
ba
|
1,239
sqft
|
built
1968
12636 E 34th St, Tulsa, OK 74146
$-244
Cash flow
-5.8%
Cash-on-Cash Return
4.3%
Cap rate
0.6%
Rent to Value Ratio
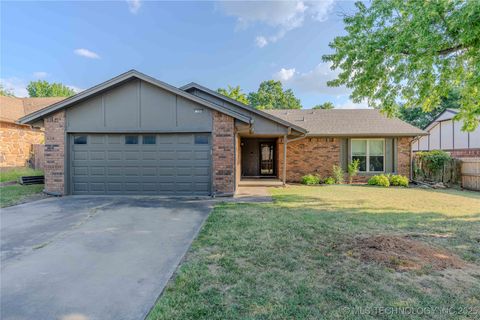
Active
$199,900
3
bds
|
2
ba
|
1,232
sqft
|
built
1978
1808 W Gary St, Broken Arrow, OK 74012
$13
Cash flow
0.3%
Cash-on-Cash Return
5.8%
Cap rate
0.8%
Rent to Value Ratio
Active
$138,500
2
bds
|
1
ba
|
846
sqft
|
built
1949
2333 W Easton Pl, Tulsa, OK 74127
$88
Cash flow
3.3%
Cash-on-Cash Return
6.4%
Cap rate
0.9%
Rent to Value Ratio

Active
$299,000
4
bds
|
2
ba
|
2,168
sqft
|
built
1978
12517 E 38th St, Tulsa, OK 74146
$-346
Cash flow
-6.0%
Cash-on-Cash Return
4.3%
Cap rate
0.6%
Rent to Value Ratio
Active
$235,000
3
bds
|
2
ba
|
1,497
sqft
|
built
1978
206 E 23rd St, Owasso, OK 74055
$-141
Cash flow
-3.1%
Cash-on-Cash Return
5.0%
Cap rate
0.7%
Rent to Value Ratio
Active
$115,000
1
bds
|
1
ba
|
720
sqft
|
built
1970
450 W 7th St, Tulsa, OK 74119
$-406
Cash flow
-18.4%
Cash-on-Cash Return
1.4%
Cap rate
1.2%
Rent to Value Ratio
Active
$335,000
3
bds
|
3
ba
|
2,967
sqft
|
built
1981
9337 S Lakewood Ave, Tulsa, OK 74137
$-265
Cash flow
-4.1%
Cash-on-Cash Return
4.7%
Cap rate
0.7%
Rent to Value Ratio
Active
$214,900
3
bds
|
1
ba
|
1,202
sqft
|
built
1928
707 S Knoxville Ave, Tulsa, OK 74112
$27
Cash flow
0.7%
Cash-on-Cash Return
5.8%
Cap rate
0.7%
Rent to Value Ratio
Active
$635,000
3
bds
|
3
ba
|
3,091
sqft
|
built
1939
3034 S Madison Ave, Tulsa, OK 74114
$-1,019
Cash flow
-8.4%
Cash-on-Cash Return
3.8%
Cap rate
0.6%
Rent to Value Ratio
Active
$175,000
3
bds
|
2
ba
|
1,222
sqft
|
built
1965
301 N 10th St, Broken Arrow, OK 74012
$89
Cash flow
2.7%
Cash-on-Cash Return
6.3%
Cap rate
0.9%
Rent to Value Ratio
Active
$145,000
2
bds
|
1
ba
|
720
sqft
|
built
1955
2638 N Maplewood Ave, Tulsa, OK 74115
$-21
Cash flow
-0.8%
Cash-on-Cash Return
5.5%
Cap rate
0.7%
Rent to Value Ratio
Active
$209,900
3
bds
|
2
ba
|
1,212
sqft
|
built
1976
10907 E 36th Pl, Tulsa, OK 74146
$-105
Cash flow
-2.6%
Cash-on-Cash Return
5.1%
Cap rate
0.7%
Rent to Value Ratio
Active
$250,000
3
bds
|
2
ba
|
1,409
sqft
|
built
1940
1328 S Yale Ave, Tulsa, OK 74112
$-180
Cash flow
-3.8%
Cash-on-Cash Return
4.8%
Cap rate
0.7%
Rent to Value Ratio
Active
$399,500
4
bds
|
3
ba
|
2,944
sqft
|
built
2007
2834 N Hickory Ct, Broken Arrow, OK 74012
$-310
Cash flow
-4.0%
Cash-on-Cash Return
4.7%
Cap rate
0.7%
Rent to Value Ratio
Active
$245,000
3
bds
|
2
ba
|
1,486
sqft
|
built
1977
2303 N Dogwood St, Owasso, OK 74055
$-247
Cash flow
-5.3%
Cash-on-Cash Return
4.5%
Cap rate
0.7%
Rent to Value Ratio

Active
$479,000
4
bds
|
3
ba
|
4,074
sqft
|
built
1968
7021 E 66th Pl, Tulsa, OK 74133
$-667
Cash flow
-7.3%
Cash-on-Cash Return
4.0%
Cap rate
0.6%
Rent to Value Ratio
Active
$698,000
4
bds
|
5
ba
|
4,922
sqft
|
built
1979
4510 S Birmingham Pl, Tulsa, OK 74105
$-1,230
Cash flow
-9.2%
Cash-on-Cash Return
3.6%
Cap rate
0.6%
Rent to Value Ratio
Active
$190,000
3
bds
|
2
ba
|
1,242
sqft
|
built
1966
11312 E 15th Pl, Tulsa, OK 74128
$-119
Cash flow
-3.3%
Cash-on-Cash Return
4.9%
Cap rate
0.7%
Rent to Value Ratio
Active
$280,000
3
bds
|
2
ba
|
1,849
sqft
|
built
1986
3421 S 73rd West Ave, Tulsa, OK 74107
$-272
Cash flow
-5.1%
Cash-on-Cash Return
4.5%
Cap rate
0.6%
Rent to Value Ratio
Active
$310,000
3
bds
|
2
ba
|
1,024
sqft
|
built
1933
715 S Quanah Ave, Tulsa, OK 74127
$-633
Cash flow
-10.7%
Cash-on-Cash Return
3.2%
Cap rate
0.4%
Rent to Value Ratio
Active
$935,000
4
bds
|
3
ba
|
3,350
sqft
|
built
2024
3917 S Madison Ave, Tulsa, OK 74105
$-3,683
Cash flow
-20.6%
Cash-on-Cash Return
1.0%
Cap rate
0.1%
Rent to Value Ratio
Active
$1,275,000
5
bds
|
4
ba
|
3,989
sqft
|
built
2025
1641 E 32nd St, Tulsa, OK 74105
$-3,973
Cash flow
-16.3%
Cash-on-Cash Return
1.9%
Cap rate
0.3%
Rent to Value Ratio

Active
$320,000
4
bds
|
3
ba
|
2,382
sqft
|
built
1994
9218 E 89th St, Tulsa, OK 74133
$-789
Cash flow
-12.9%
Cash-on-Cash Return
2.7%
Cap rate
0.5%
Rent to Value Ratio
Active
$279,900
3
bds
|
2
ba
|
1,665
sqft
|
built
1966
4949 S Maplewood Ave, Tulsa, OK 74135
$-326
Cash flow
-6.1%
Cash-on-Cash Return
4.3%
Cap rate
0.6%
Rent to Value Ratio
Active
$349,000
3
bds
|
2
ba
|
2,569
sqft
|
built
1971
12723 E 137th St S, Broken Arrow, OK 74011
$-437
Cash flow
-6.5%
Cash-on-Cash Return
4.2%
Cap rate
0.6%
Rent to Value Ratio

Active
$195,000
3
bds
|
2
ba
|
1,418
sqft
|
built
1965
10733 E 20th St, Tulsa, OK 74128
$-74
Cash flow
-2.0%
Cash-on-Cash Return
5.2%
Cap rate
0.7%
Rent to Value Ratio
Active
$539,900
4
bds
|
3
ba
|
2,796
sqft
|
built
2022
25 W 166th Pl S, Glenpool, OK 74033
$-753
Cash flow
-7.3%
Cash-on-Cash Return
4.0%
Cap rate
0.6%
Rent to Value Ratio
Active
$655,000
3
bds
|
4
ba
|
3,614
sqft
|
built
2019
12015 S Urbana Ave, Tulsa, OK 74137
$-1,143
Cash flow
-9.1%
Cash-on-Cash Return
3.6%
Cap rate
0.6%
Rent to Value Ratio